Sameer Mhaisekar
Developer Advocate, SquaredUp


Join me on my Azure Monitor journey as I learn all there is to know about the platform. Check out my series introduction for a brief overview and a bit about me (tl;dr former SCOM admin, avid tech blogger, SquaredUp tech evangelist).
In the previous post, we talked about connecting data sources to your Log Analytics workspace. While the data can be super useful, it is “unstructured” at this point – not really in the right shape to perform a specific task or enable useful monitoring of an application or a service. This is where “Solutions” come into picture (formerly called management solutions). Solutions can also leverage other services in Azure to perform many related actions, such as automation.
Before showing you what Solutions actually do, let me try to explain what they are with an analogy.
Before Azure was a thing, and still to this day for many of the IT organizations I know, Microsoft’s monitoring solution was System Center Operations Manager, better known as SCOM. If you’re familiar with SCOM, you already know that it’s an agent-based monitoring solution, and that it isn’t capable of doing much immediately after installation. To start monitoring the things that actually matter, SCOM relies on something called “management packs”. Management packs supply the logic to SCOM to make it possible to monitor services, applications, infrastructure, etc.
Now, think of the Log Analytics workspace as the SCOM management group which is freshly installed. It has resources connected but it doesn’t yet understand what data to collect or how to collect it. Now it’s time to supply the “logic” to the workspace so it can perform some specific monitoring tasks in relation to a particular application or service. The management packs in this case are the Solutions.
Admittedly this comparison may not be 100% perfect, but it should give you an idea of what Solutions are and why they’re necessary. Let’s enable a Solution now and see what it actually does.
Click here for Microsoft documentation on Solutions.
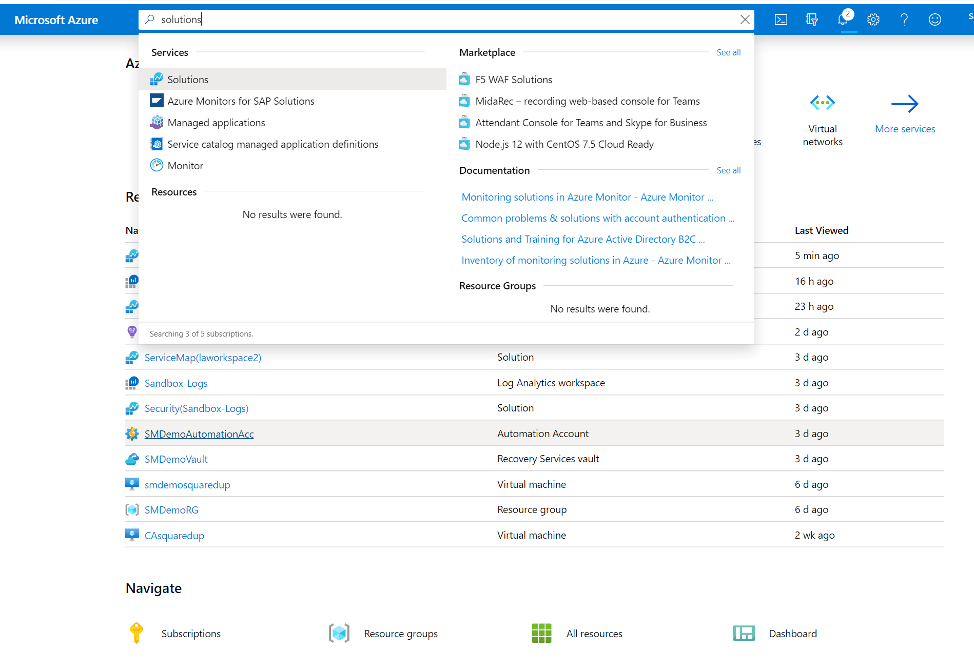
To deploy a Solution, start with searching for “Solutions” in the global search.
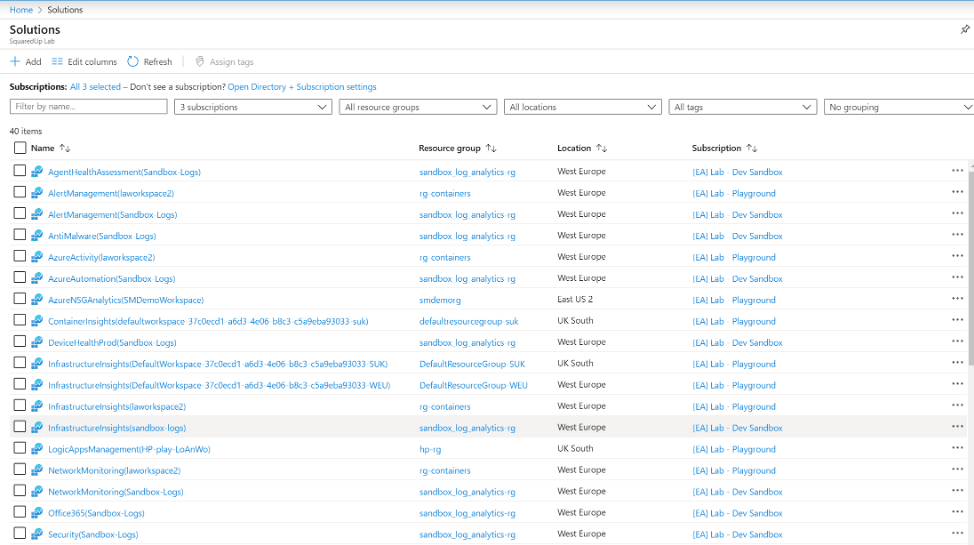
You’ll see a list of Solutions installed (note that if you’re entirely new to Azure Monitor Logs, the view won’t show you much at this stage). Let’s add a new solution by clicking the Add button at the top.
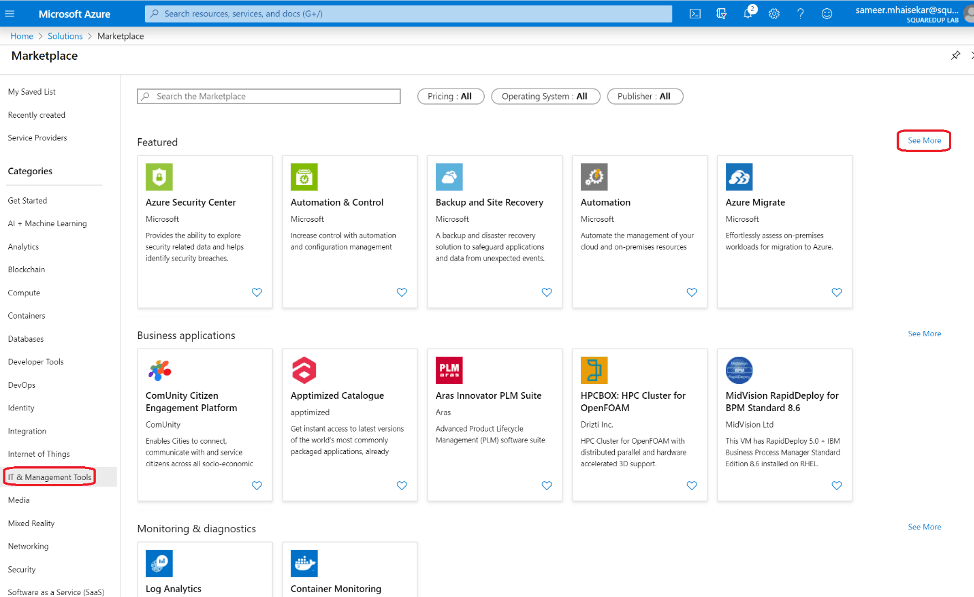
Now, this part can be a little confusing at first. After clicking the add button, it takes you to the Azure Marketplace. Here there are all kinds of services listed, not just Solutions. And if that’s not enough, there is no way to know which of these services are actually Solutions. Honestly, it took me a while, but I eventually figured out that Solutions seem to be contained in the “IT & Management Tools” category on the left.
Let’s start by clicking the “See More” option to the right of the “Featured” list.
NOT the easiest thing to find, and hopefully Microsoft will do something to make the difference more obvious.
Once you’ve clicked, you are presented with a list of services (again, not necessarily all of them are Solutions), like so:
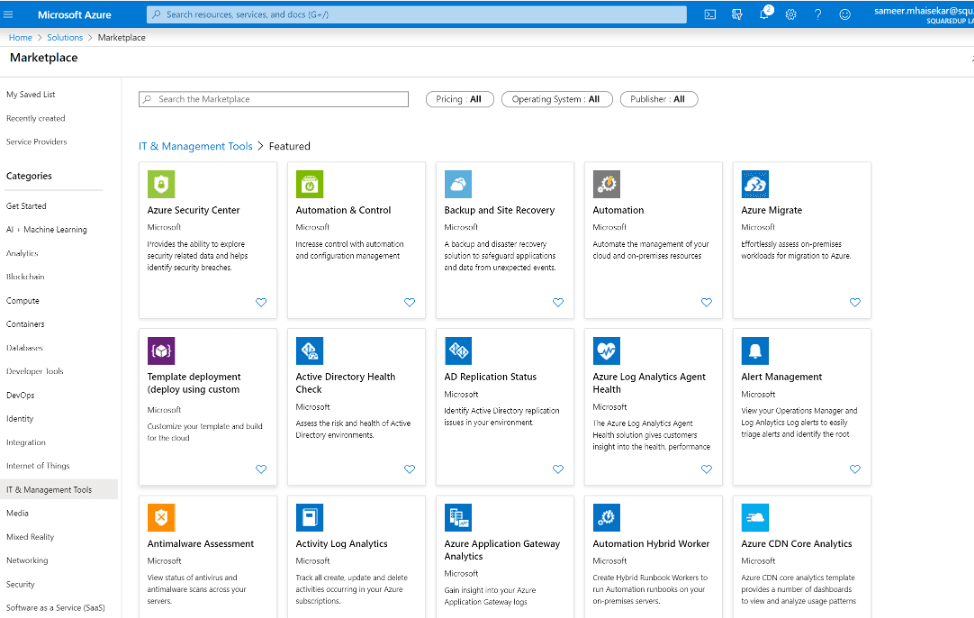
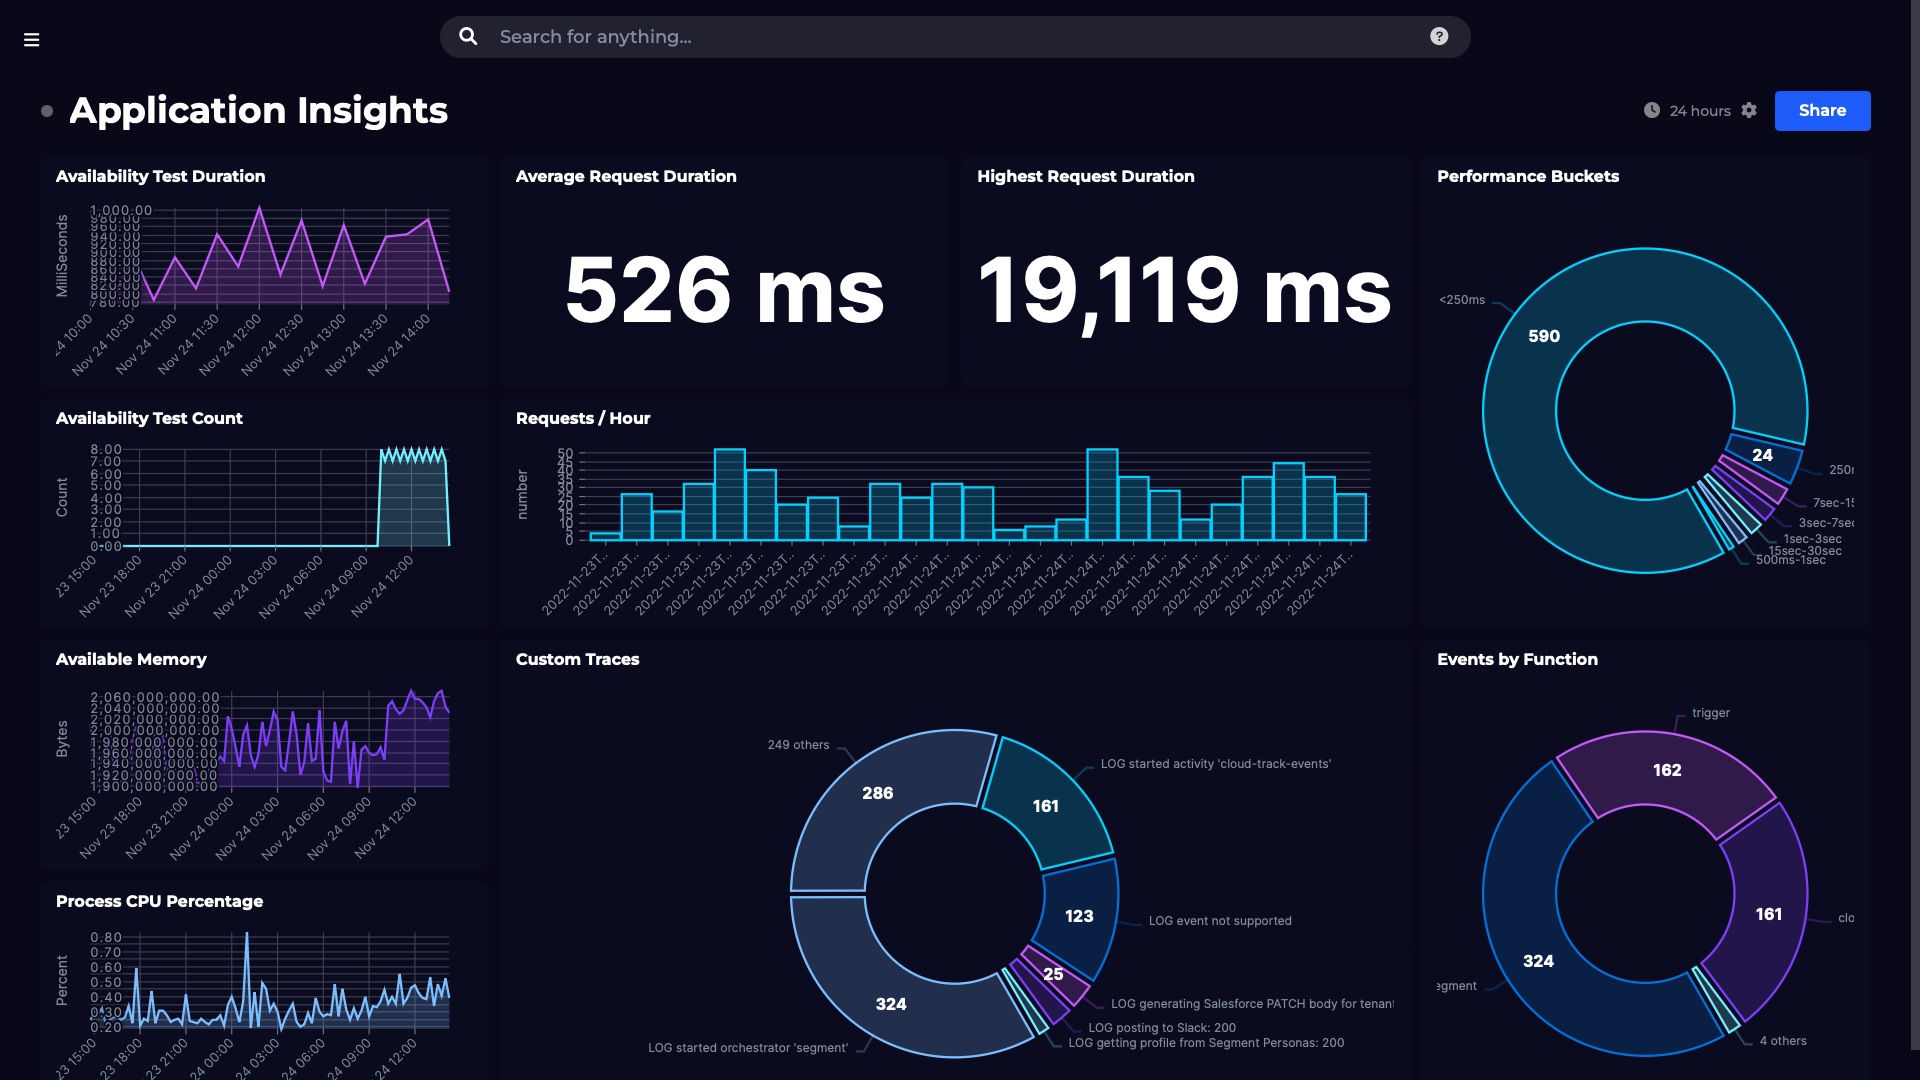
Generally, you can figure out if a service is related to monitoring by the name of the service. For example, “Active Directory Health Check”, “Alert Management” or “Activity Log Analytics” sound like they’re related to monitoring or analysis so there’s a good chance that they are Solutions. In contrast, “Azure Migrate” is in the same view but it’s a tool to migrate your workloads from on-premise to Azure so not exactly what we’re searching for here. The best way to know is to click on a service that sounds relevant and read through the description. Usually you’ll spot a sample dashboard showing donut charts or line graphs if it’s a Solution. Also, if you hit Create and it prompts you to specify the Log Analytics workspace to deploy to, it’s definitely a solution.
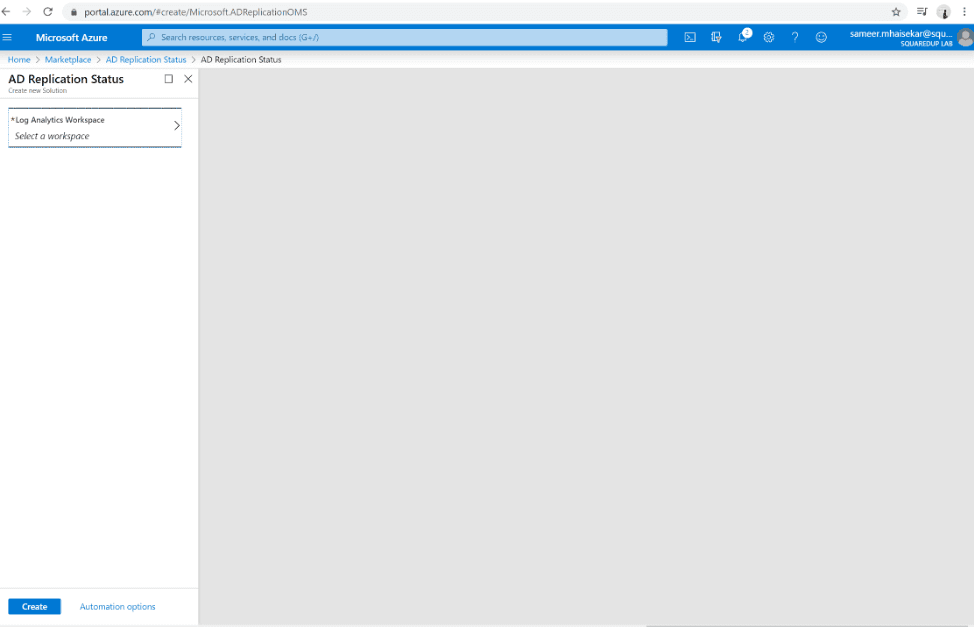
For example, this is a solution:
While this is not:
Alternatively, you can refer to Microsoft's full list of monitoring solutions.
Alright, now that we’ve hopefully figured out how to identify Solutions in the Marketplace – let’s try deploying the “Network Performance Monitor (NPM)” solution.
According to its description: Network Performance Monitor (NPM) is a cloud-based hybrid network monitoring solution that helps you monitor network performance between various points in your network infrastructure, monitor network connectivity to applications and monitor the performance of your Azure ExpressRoute.
The description explains in detail what this solution is for and what you can achieve by deploying it. At the bottom it also provides further reading material and an overview of the data it will collect.
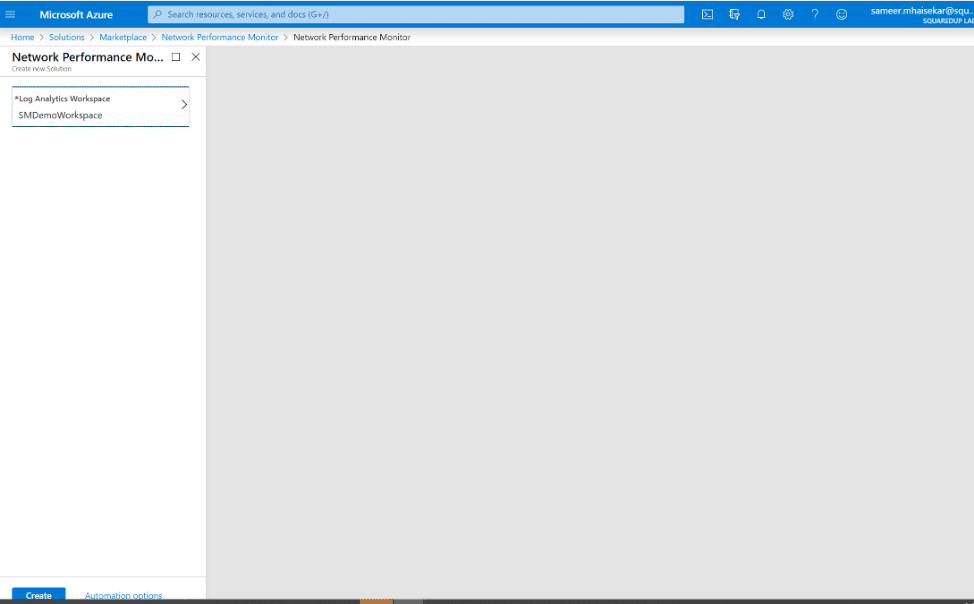
After hitting the “Create” button, it prompts you to select a workspace. I can select an existing workspace or create a new one. I’ll deploy it to the same workspace we’ve been using so far (refer to Part 2 where we set up a Log Analytics workspace).
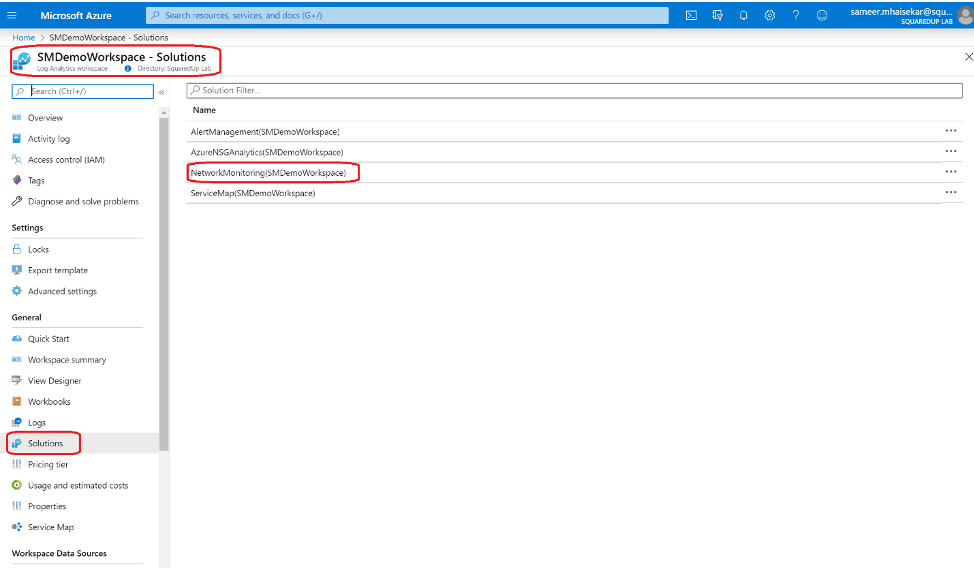
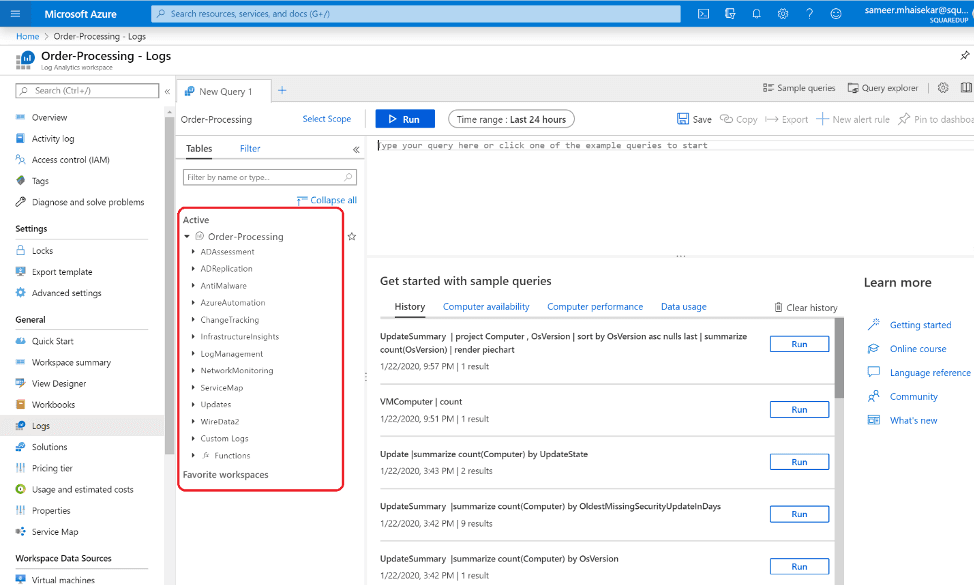
After successful deployment, the solution is ready to go! I can browse to it from the list we saw earlier under the Solutions blade, or if you browse into the Log Analytics workspace you chose, you can select it from the Solutions tab on the left:
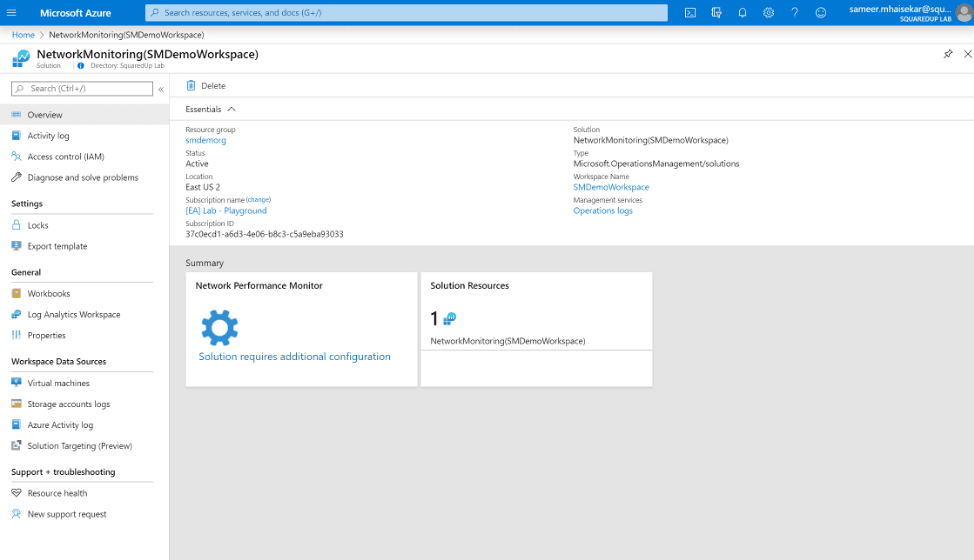
After selecting the Solution you just deployed, you’ll see a screen like this:
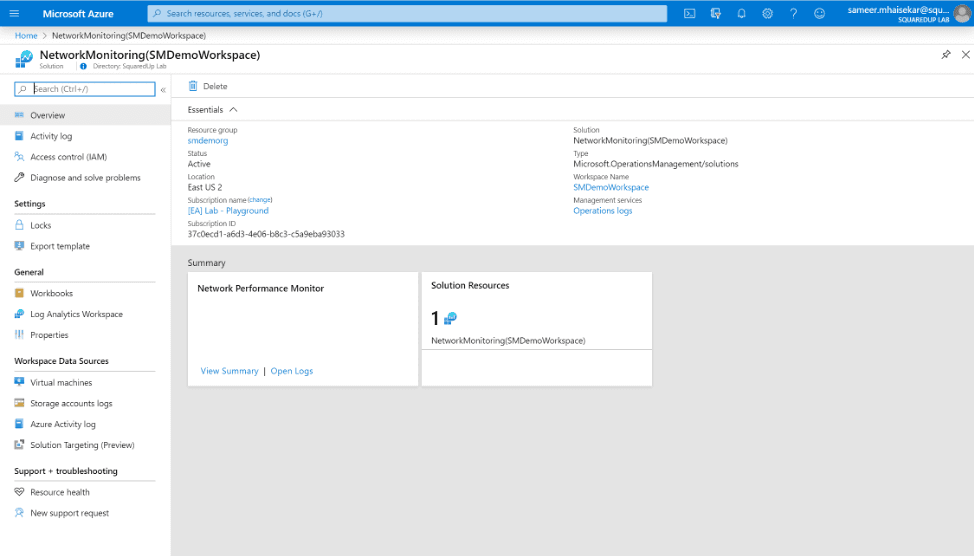
Now, certain Solutions require some additional configuration before they’re fully operational. If you click on the “View summary” tab, it’ll notify you that this Solution requires additional configuration.
Click on the blue text and you’ll get directed to the configuration section:
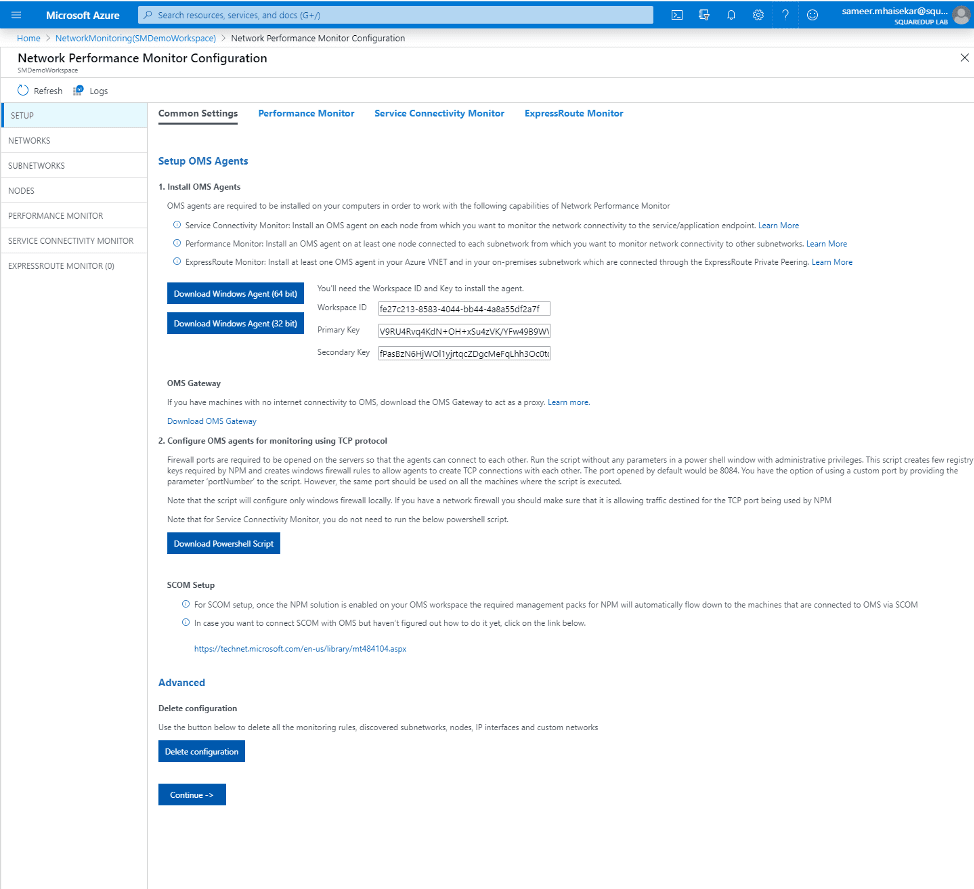
The next thing to do is – you guessed it – configure the NPM. I won’t bore you with the step-by-step details of how to configure it, but in summary, this solution uses the Log Analytics agent deployed on your connected virtual machines to perform typical network monitoring tasks, like pinging URL’s and measuring response time. There are also some very Azure-specific tasks it can perform like monitoring your Azure networks and ExpressRoute connections. The Microsoft documentation has a pretty thorough article about how to do it. Click here to see it.
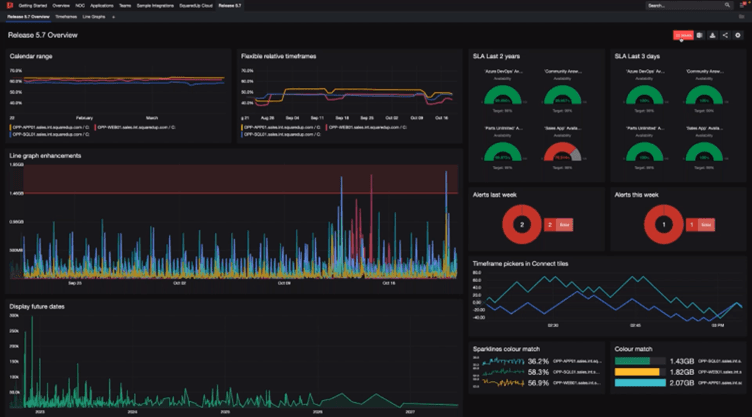
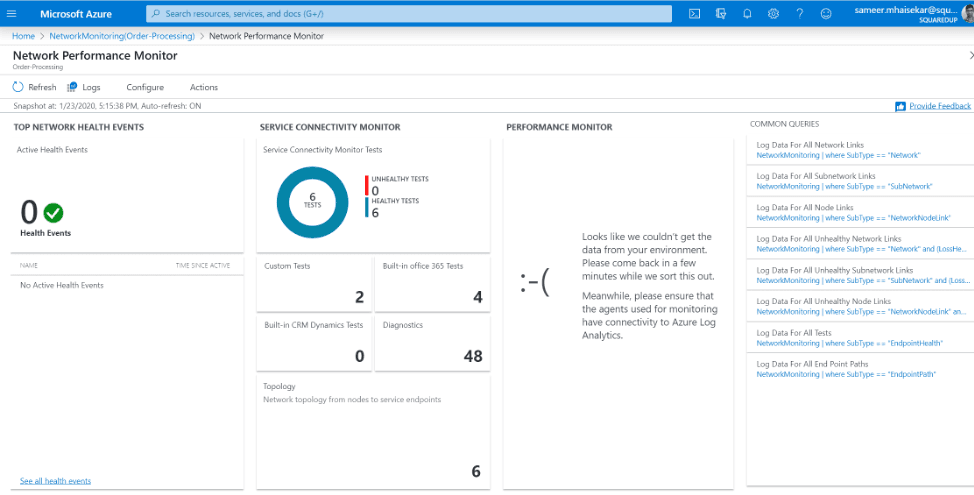
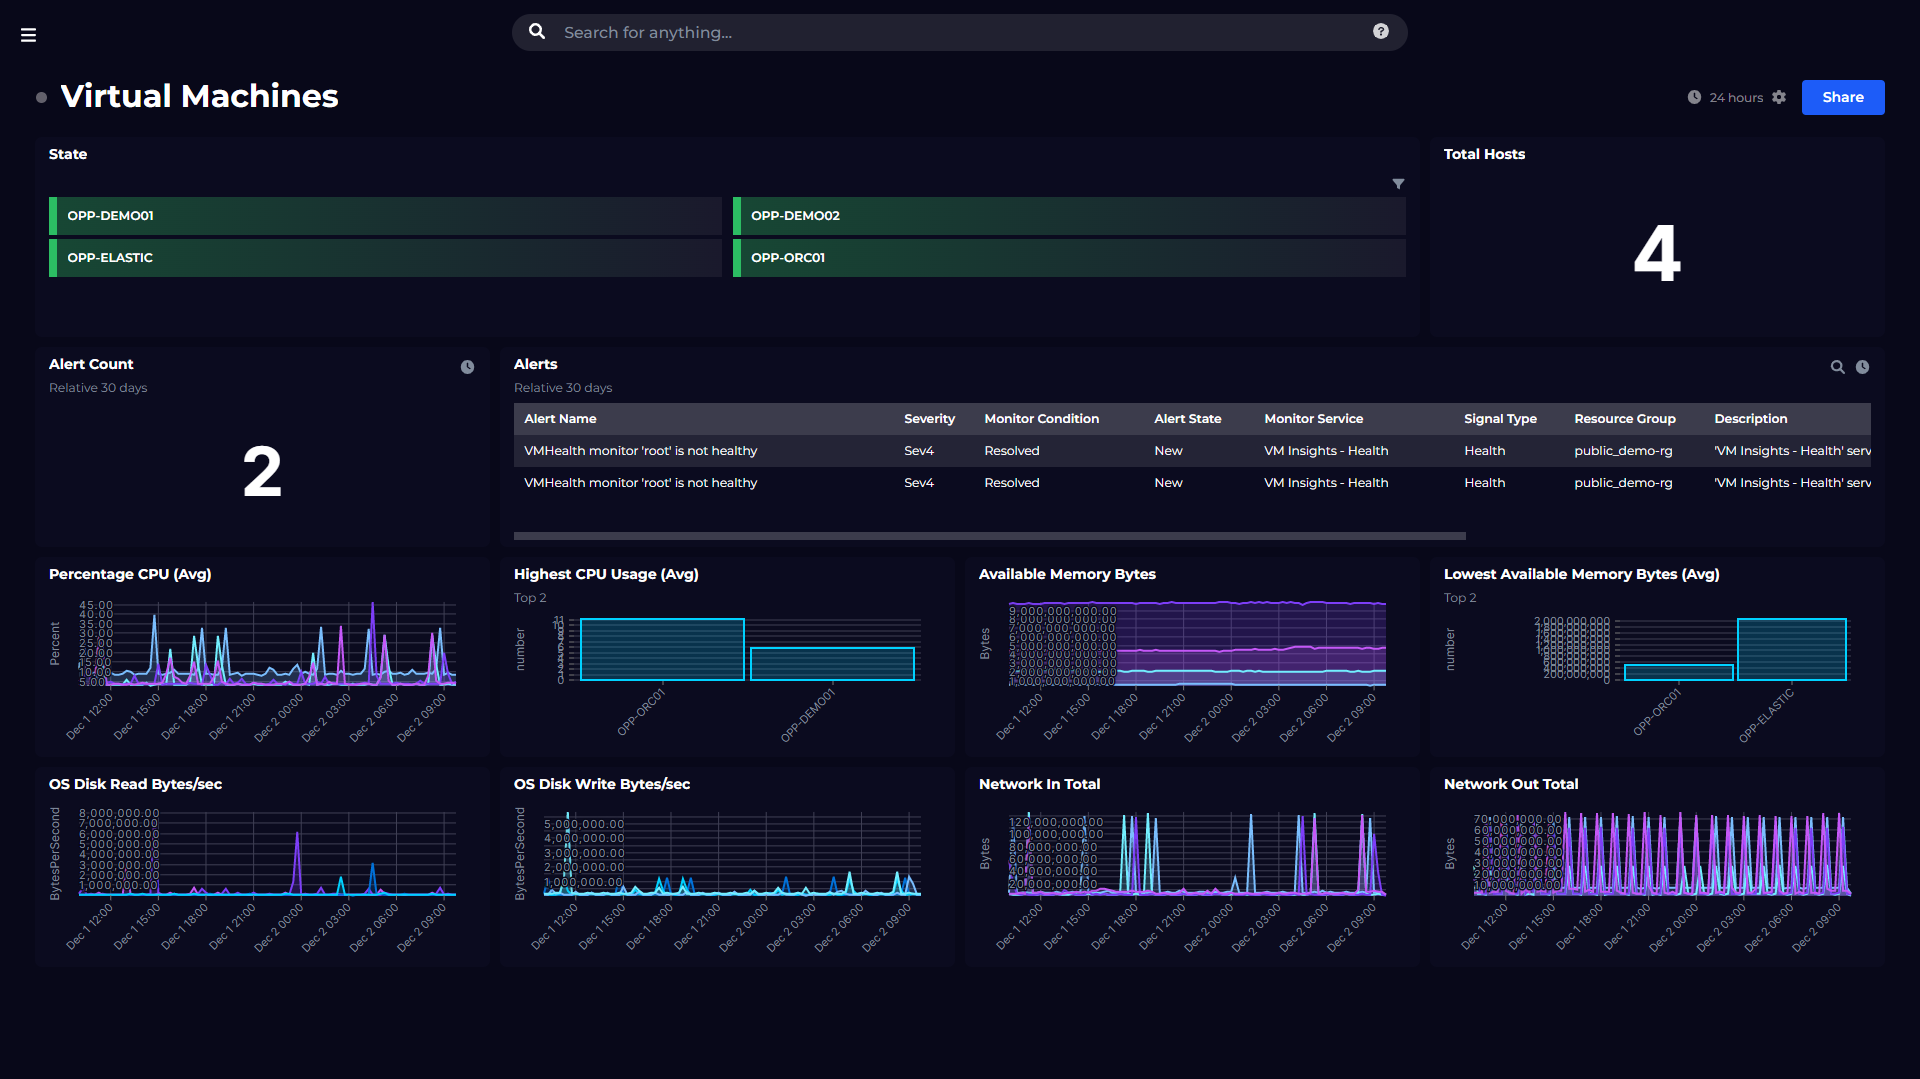
And there you go! You have deployed a solution to your workspace and you can now view the data it’s collecting from a pre-built dashboard, similar to this:
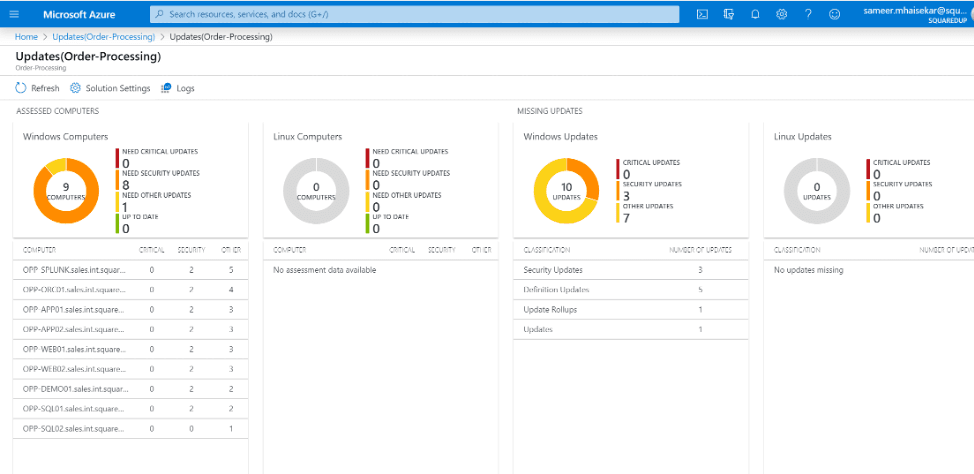
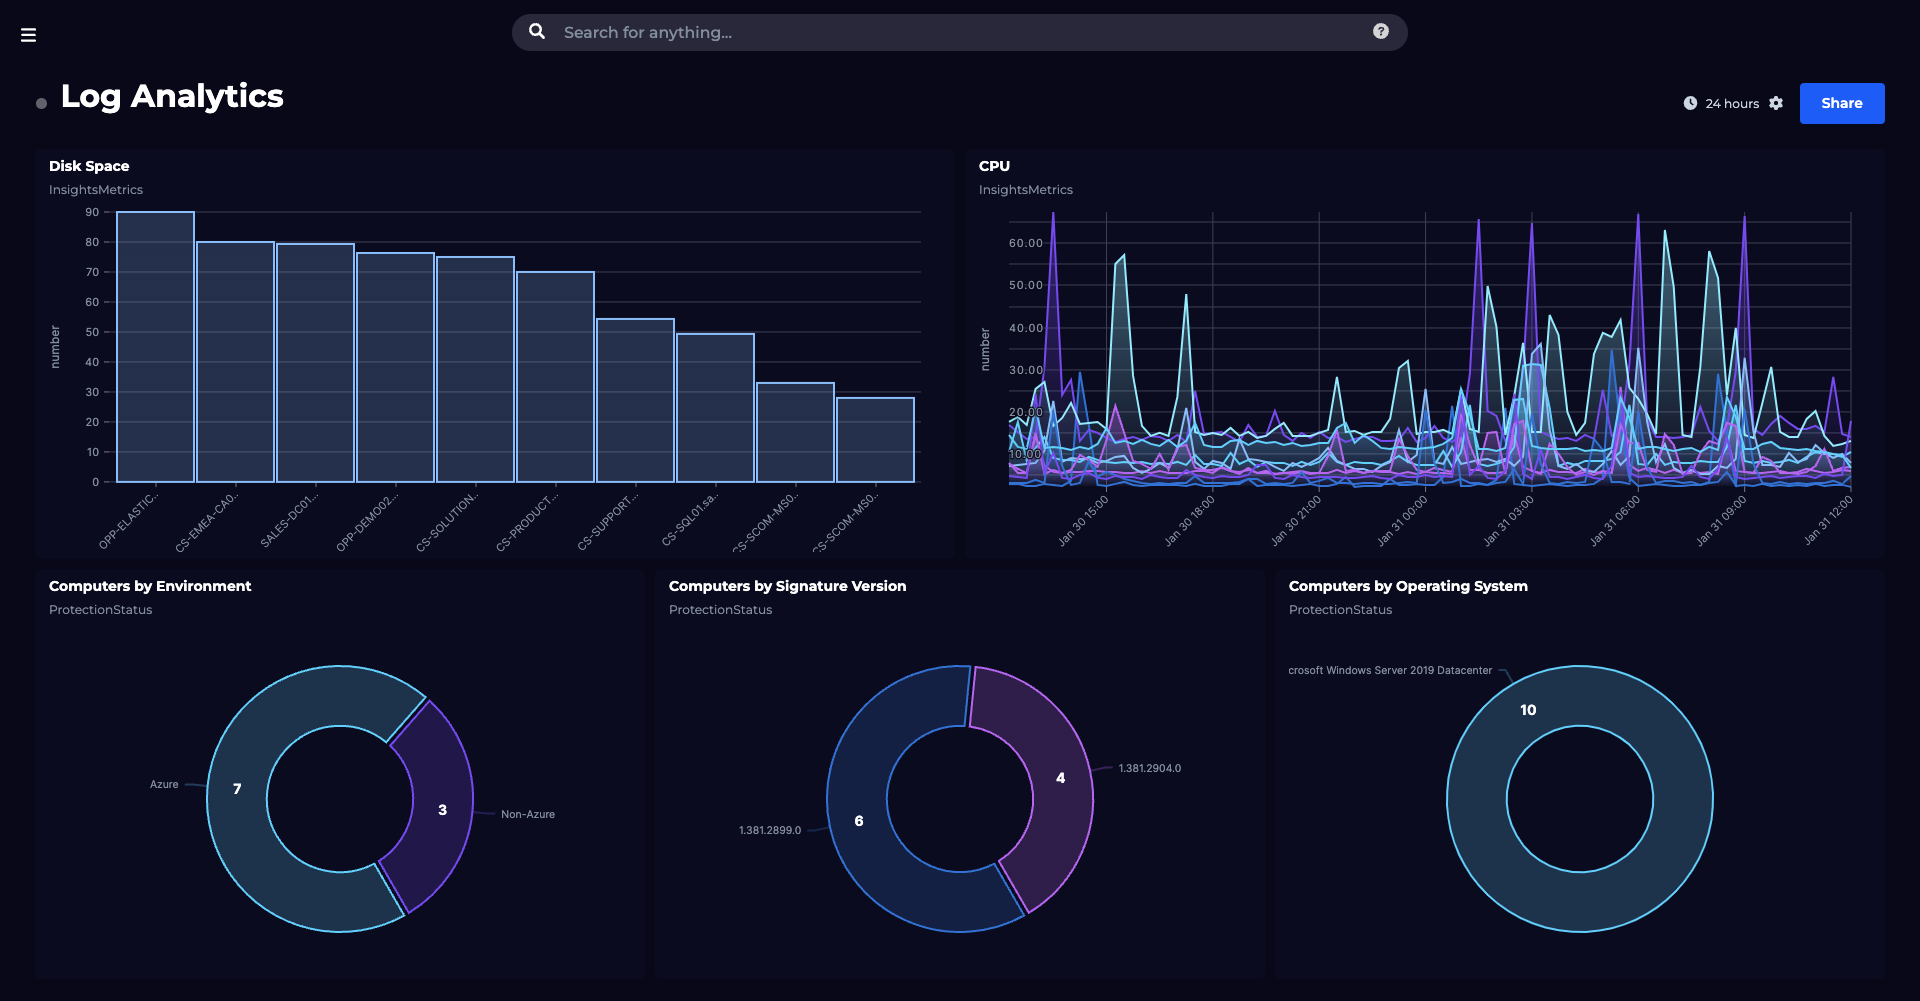
Of course, it will look much better when you have configured it properly and have some data flowing in. For example, this is one of the other solutions (Update management) that I deployed that keeps track of my patching compliance:
One thing to note is that as you add more Solutions, you’ll notice that each one creates new “tables” in your Log Analytics workspace. Remember that we mentioned that Azure Monitor Logs stores data in a similar fashion to a SQL database? Well that’s what these tables are, and you can perform queries using KQL on these directly.
Awesome. You can now play around and add more Solutions to your workspace which in turn collects more data that’s relevant to your monitoring goals!
Before we conclude, let’s talk about money... The majority of the Solutions you’ll find are free to deploy, but keep in mind that they all increase the amount of data you’re ingesting into your Log Analytics workspace, and that’s where the cost comes in. The more data you collect – in other words, the more data sources you connect and the more Solutions you deploy – the higher the cost of using Azure Monitor Logs. More details about pricing are available here from Microsoft.
Here are a few resources if you need help keeping your Azure costs down:
Tips from the field: Managing costs in Azure
6 steps we took to regain control of our Azure costs at SquaredUp
Azure cost management dashboards
Alright! That’s all for this part, and we’ve now completed the “getting data into Azure Monitor Logs” section of this series (Parts 2 and 3). In the next part, we’ll discuss how you can start to work with the data you’ve collected, mainly with the help of the Kusto Query Language, or KQL.
We’ll discuss a new topic each week, so stay tuned. Drop your email address in the box below to get notified with each new post, or join our dedicated Slack channel to be a part of the discussion.
Next chapter: Working with Azure Monitor Logs data using Kusto (KQL)
Monitor your Azure environment, including VM, Functions, Cost and more.
SquaredUp has 60+ pre-built plugins for instant access to data.
Dashboard Story
Dashboard Story