Sameer Mhaisekar
Developer Advocate, SquaredUp


Join me on my Azure Monitor journey as I learn all there is to know about the platform. Check out my intro note here for a brief series overview and a bit about me (tl;dr former SCOM admin, avid tech blogger, SquaredUp tech evangelist).
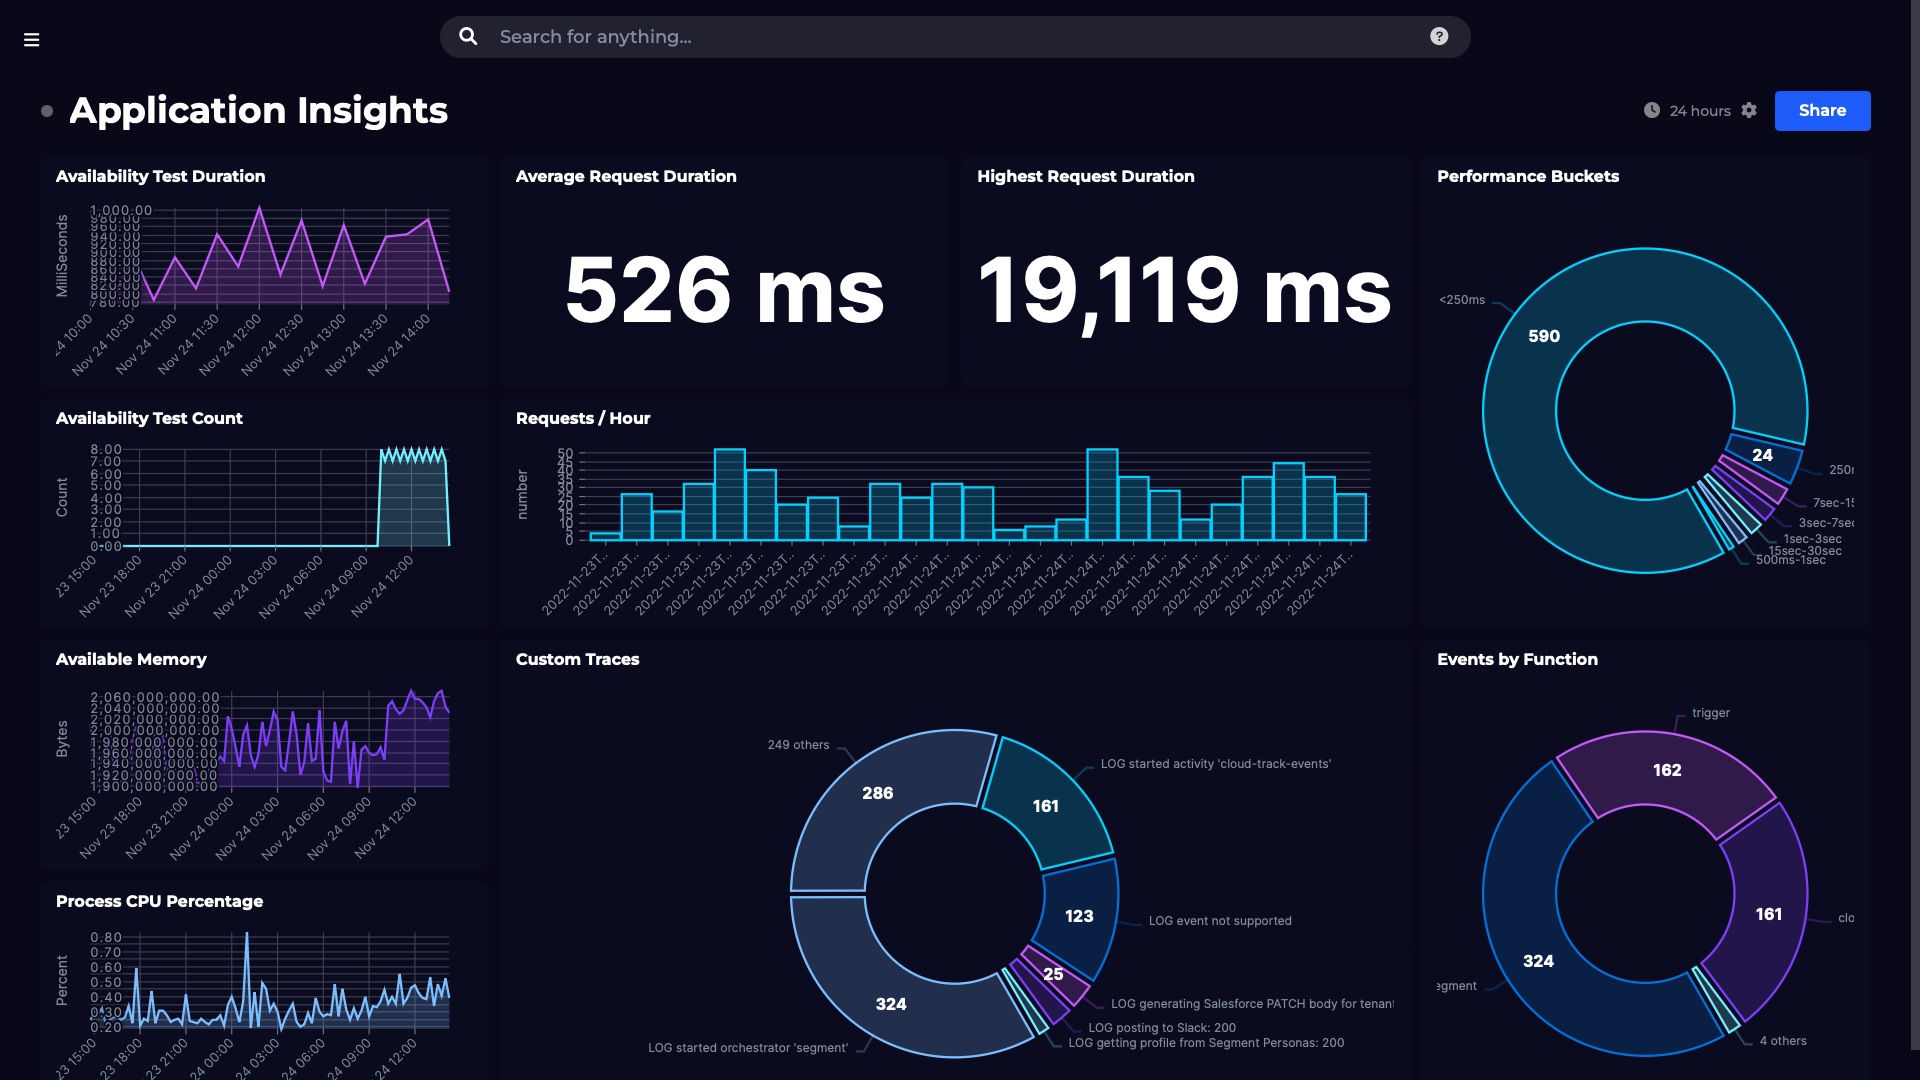
Now that you've learned your way around Log Analytics and Application Insights, let’s move on to discuss how you can set up alerting in Azure Monitor.
Azure Monitor is the centralized console where you can create alerting around various resources in your subscription and also manage it. Alerting in Azure Monitor includes:
Let’s talk more about them one by one.
Alert rules are basically your monitoring logic. Here you can choose the resource type, the condition for alerting, name and description of the alert and what actions you want to initiate when the alert is fired.
Let’s see that in action:
1. Navigate to Azure Monitor, and select “Alerts” from the menu on left. It will display a little summary dashboard of the alerts you’ve configured.
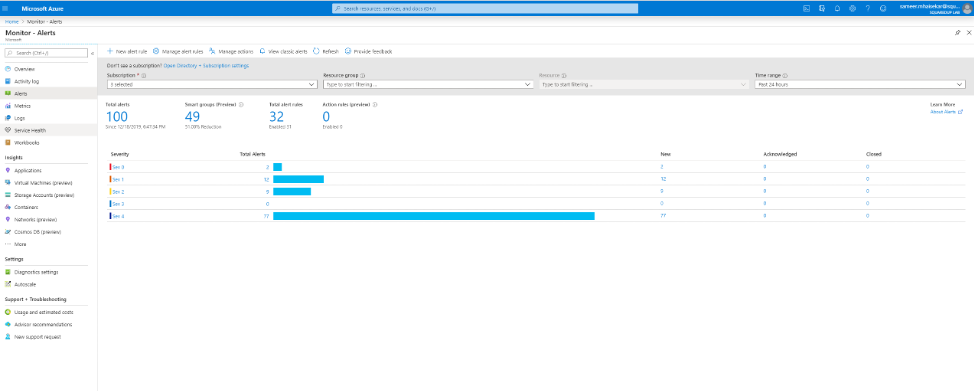
You’ll see the scope on top, with the total number of alerts, total number of alert rules and the number of active rules, and below that, a distributed visualization of the alerts with their severity and resolution states.
2. To create a new rule, hit the + sign on the top that says “New alert rule”.
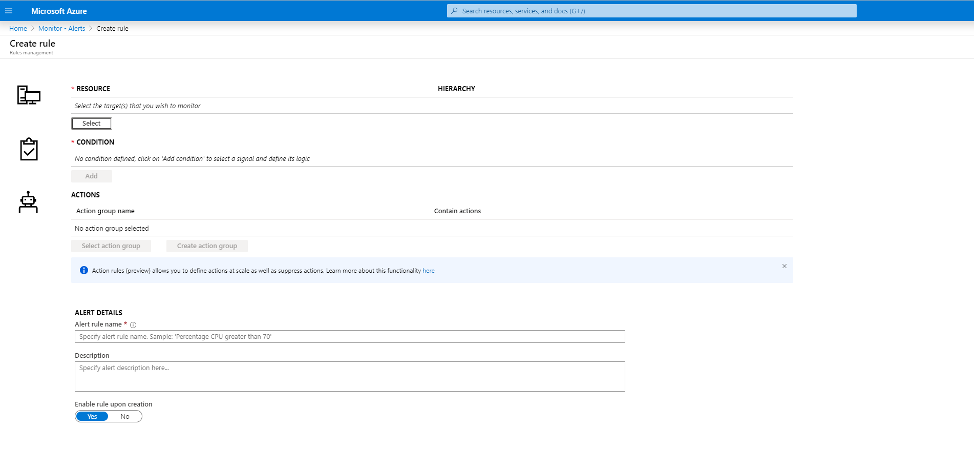
3. Here you can choose the type of resource you want to monitor. We will take Virtual Machines, for example.
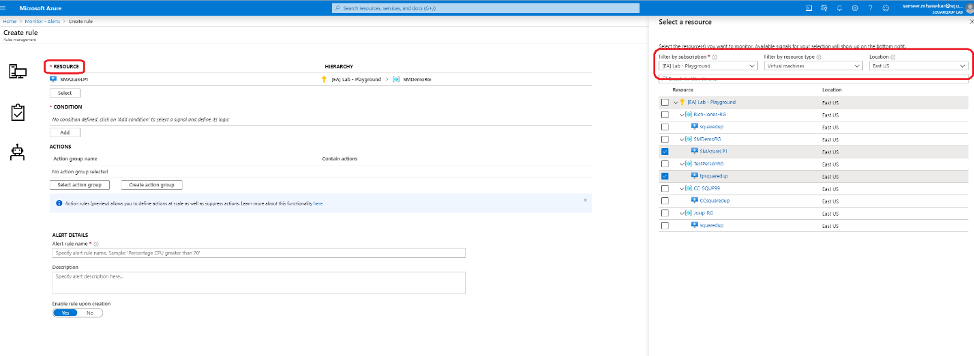
As you can see, you can select one or multiple resources, based on the scope filter you’ve applied.
4. Once selected, you can now choose the condition on which you want to create an alert. Here you select the “signal” that you want to monitor. “Signals” are basically the entities that you want to monitor, and these may include metrics, activity logs, or log search queries. The choice of signals you get varies by the choice of resource selected.
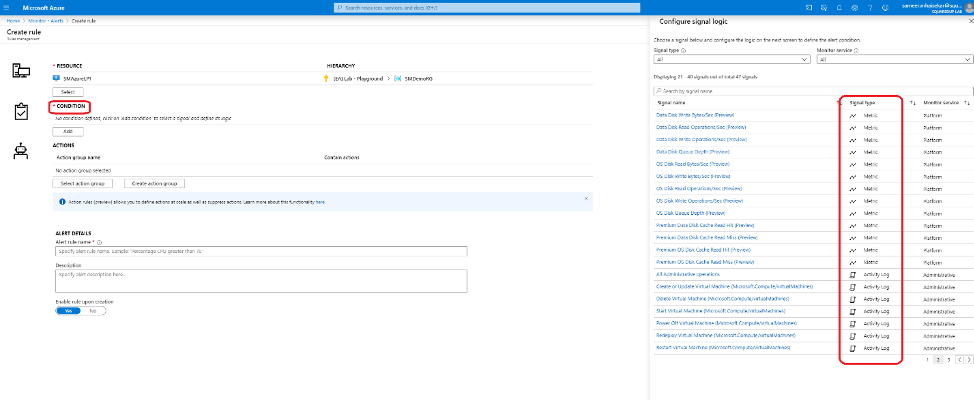
For the purposes of this demo I will select a metric that I want to alert on if it crosses a threshold.
5. I’ve selected the “Data read bytes” as my signal and configured it to fire an alert if it crosses a threshold of 1 GB.
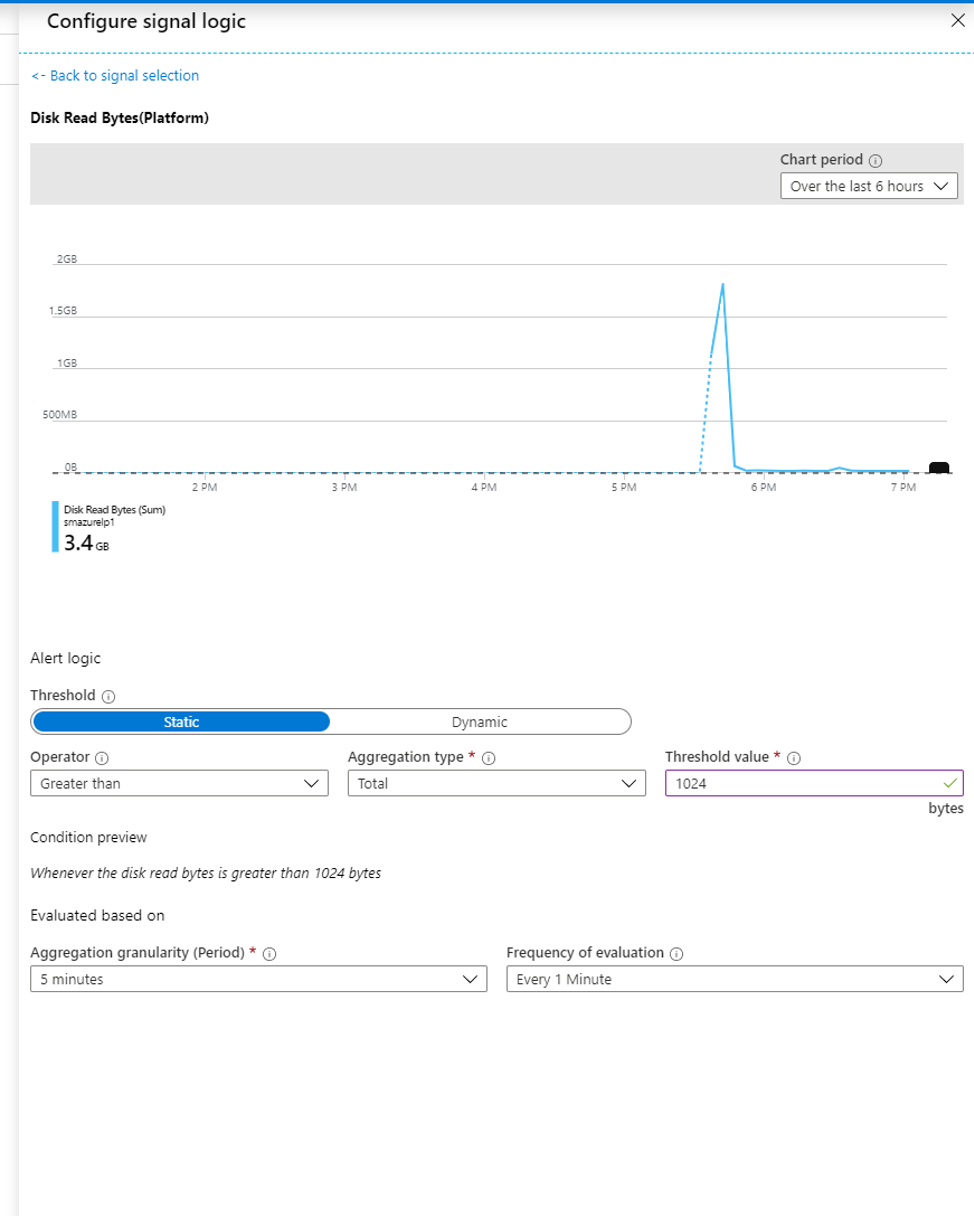
You’ll also notice that you can select the aggregation period you want for the raw data points and how frequently you want to collect them.
Next up is to create action groups. Action groups are the responses you can run when an alert is detected.
Action groups define the operation you choose to take in response to an alert, such as send out an email, or trigger a workbook or a function app, etc.
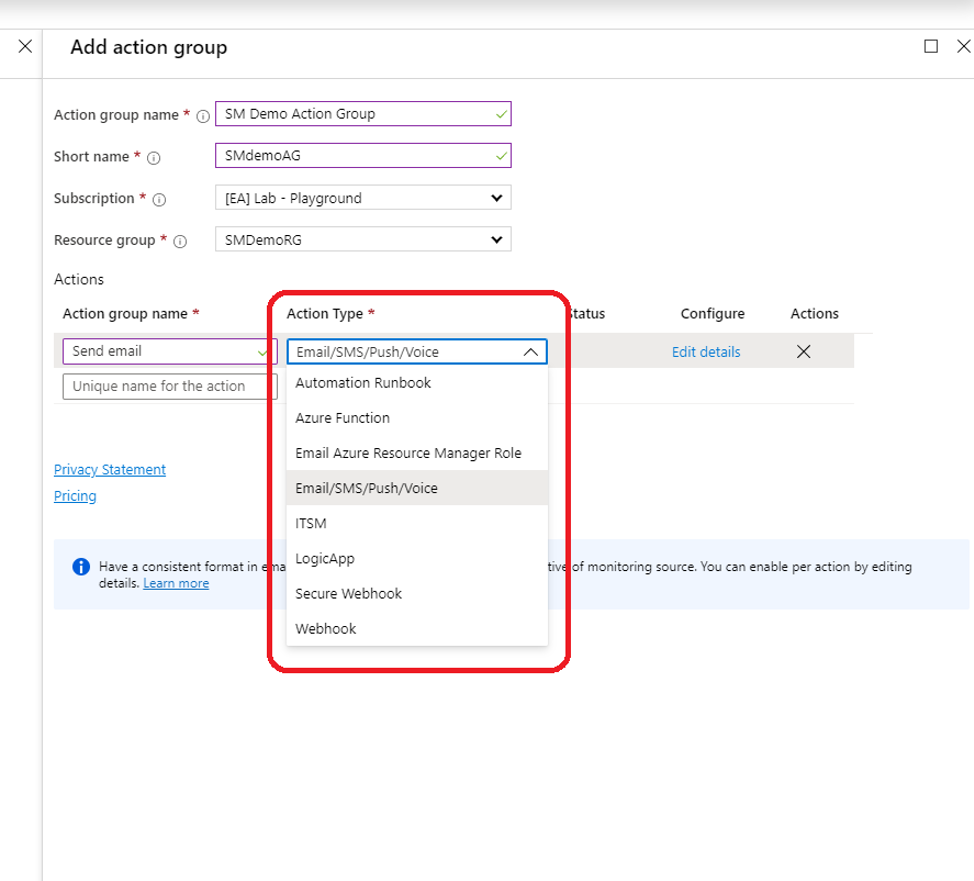
6. There are a bunch of options for operations you can choose from, like:
To learn more about each of these options, refer to this bit of Microsoft documentation:
Create and manage action groups in Azure portal
I’m going to select the Email/SMS/Push/Voice option and configure an email to be sent to me if this alert is raised.
7. Lastly, enter a name for the alert, a description (optional), the severity of the alert and whether or not you’d like to enable it immediately.
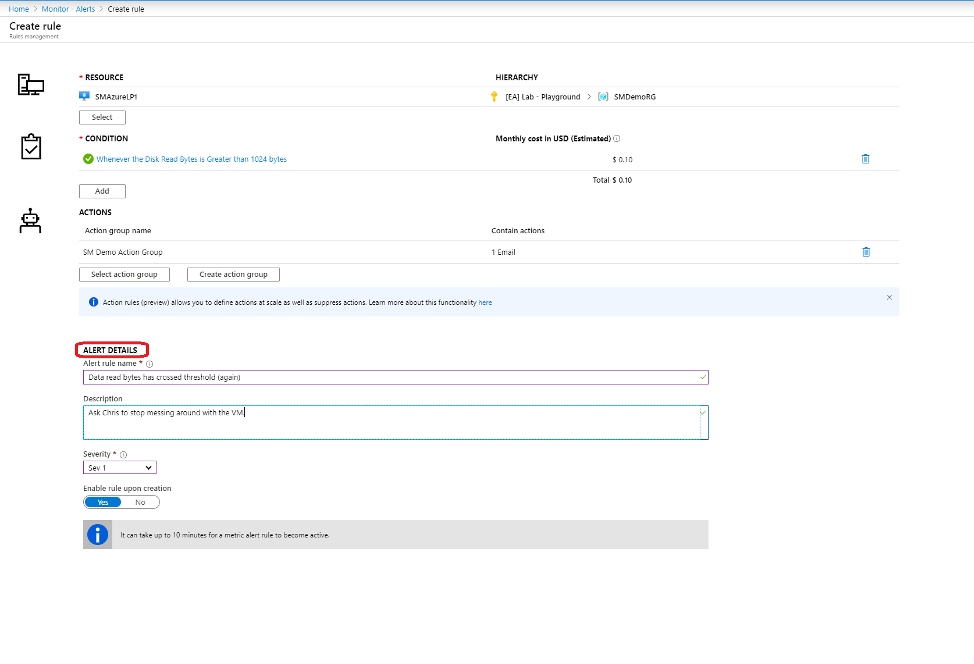
There you go! That was easy. Now you’ve created a rule and also set actions to run in response.
Now all that’s left is to repeat this for the other alerts you’d like to have. Once you’re done, you will see alerts starting to flow in:
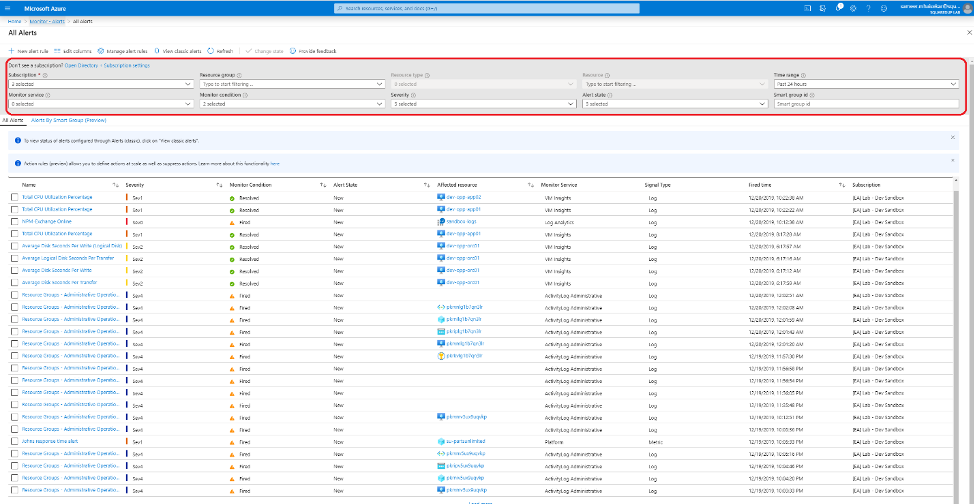
The area highlighted at the top is where you can change the scope, apply filters, etc.
For further reading, check out Microsoft’s overview of alerts:
Overview of alerts in Microsoft Azure
In the next chapter (which is incidentally also the final chapter in this series!) we will talk about Azure Service Health and how to monitor Azure itself. Catch you next week for one final episode!
We’ll discuss a new topic each week, so stay tuned. Drop your email address in the box below to get notified with each new post, or join our dedicated Slack channel to be a part of the discussion.
Next chapter: Azure Service Health
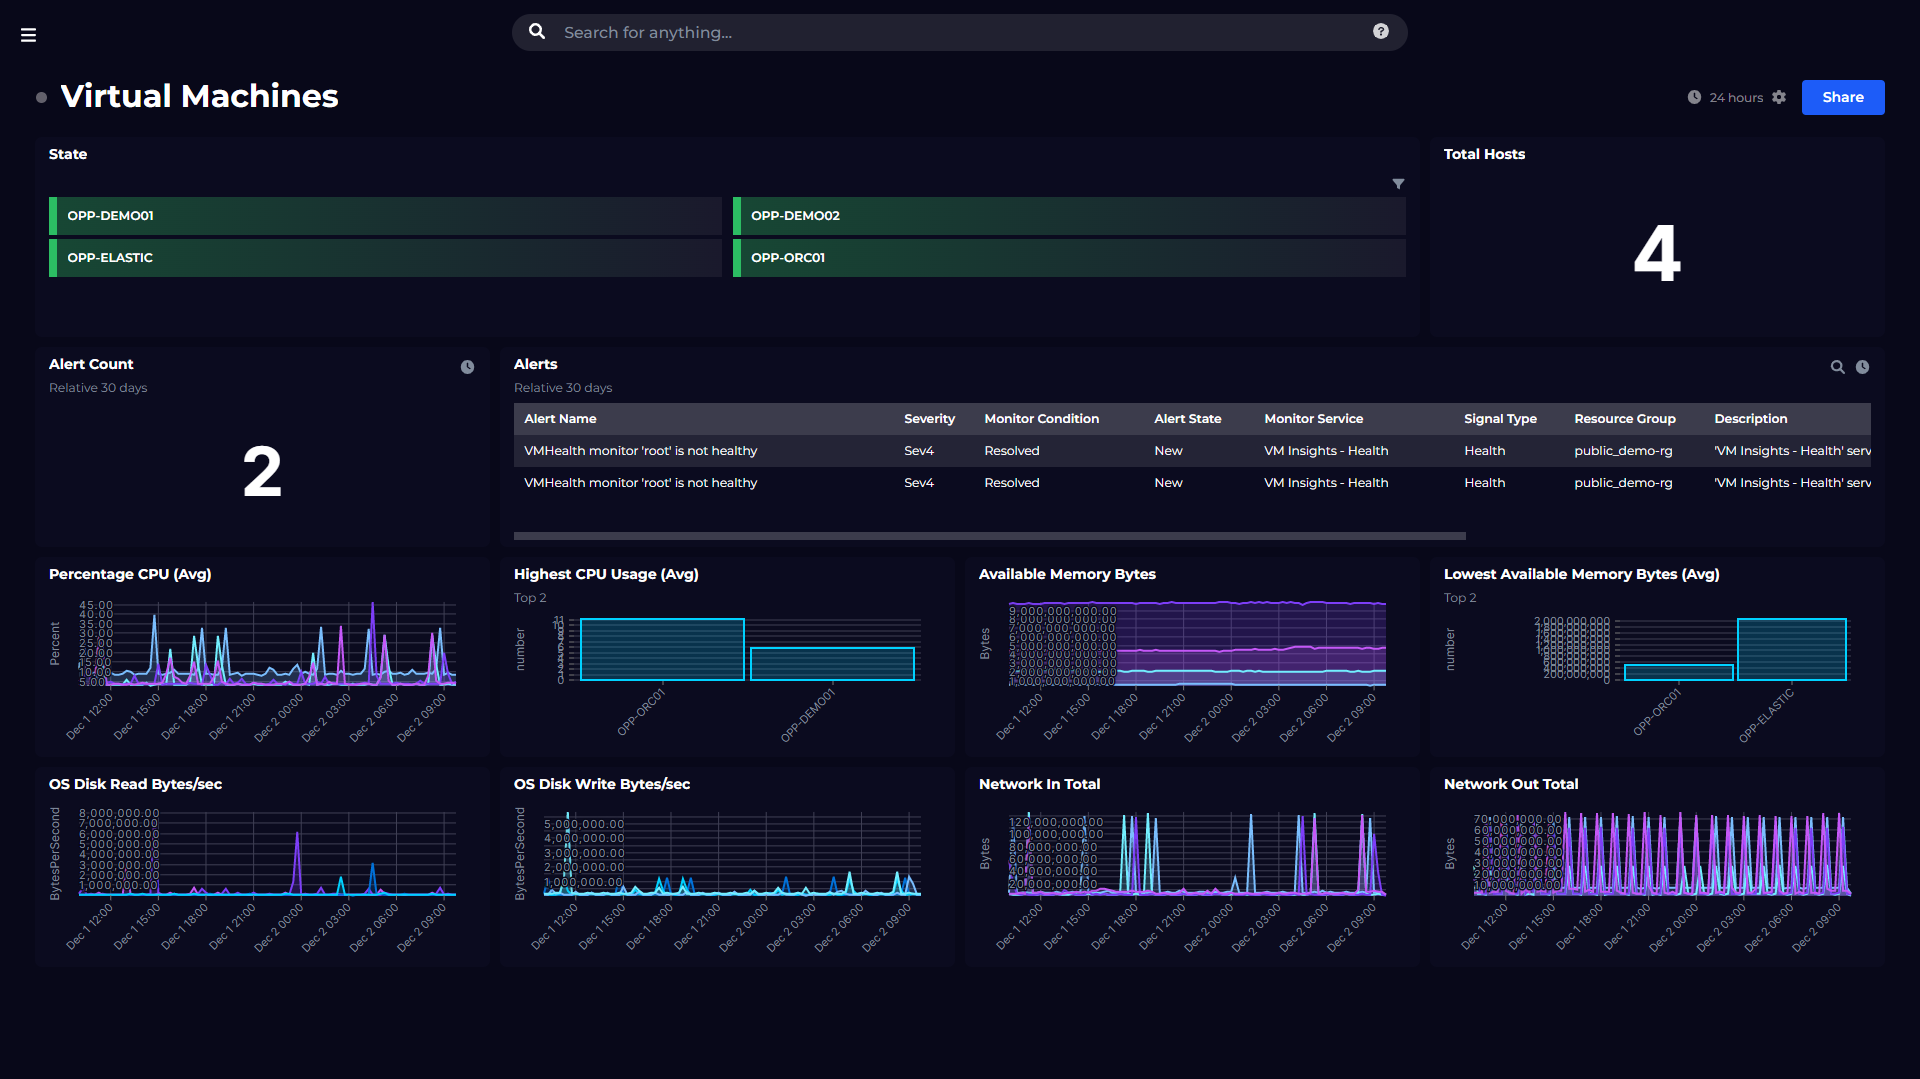
Monitor your Azure environment, including VM, Functions, Cost and more.
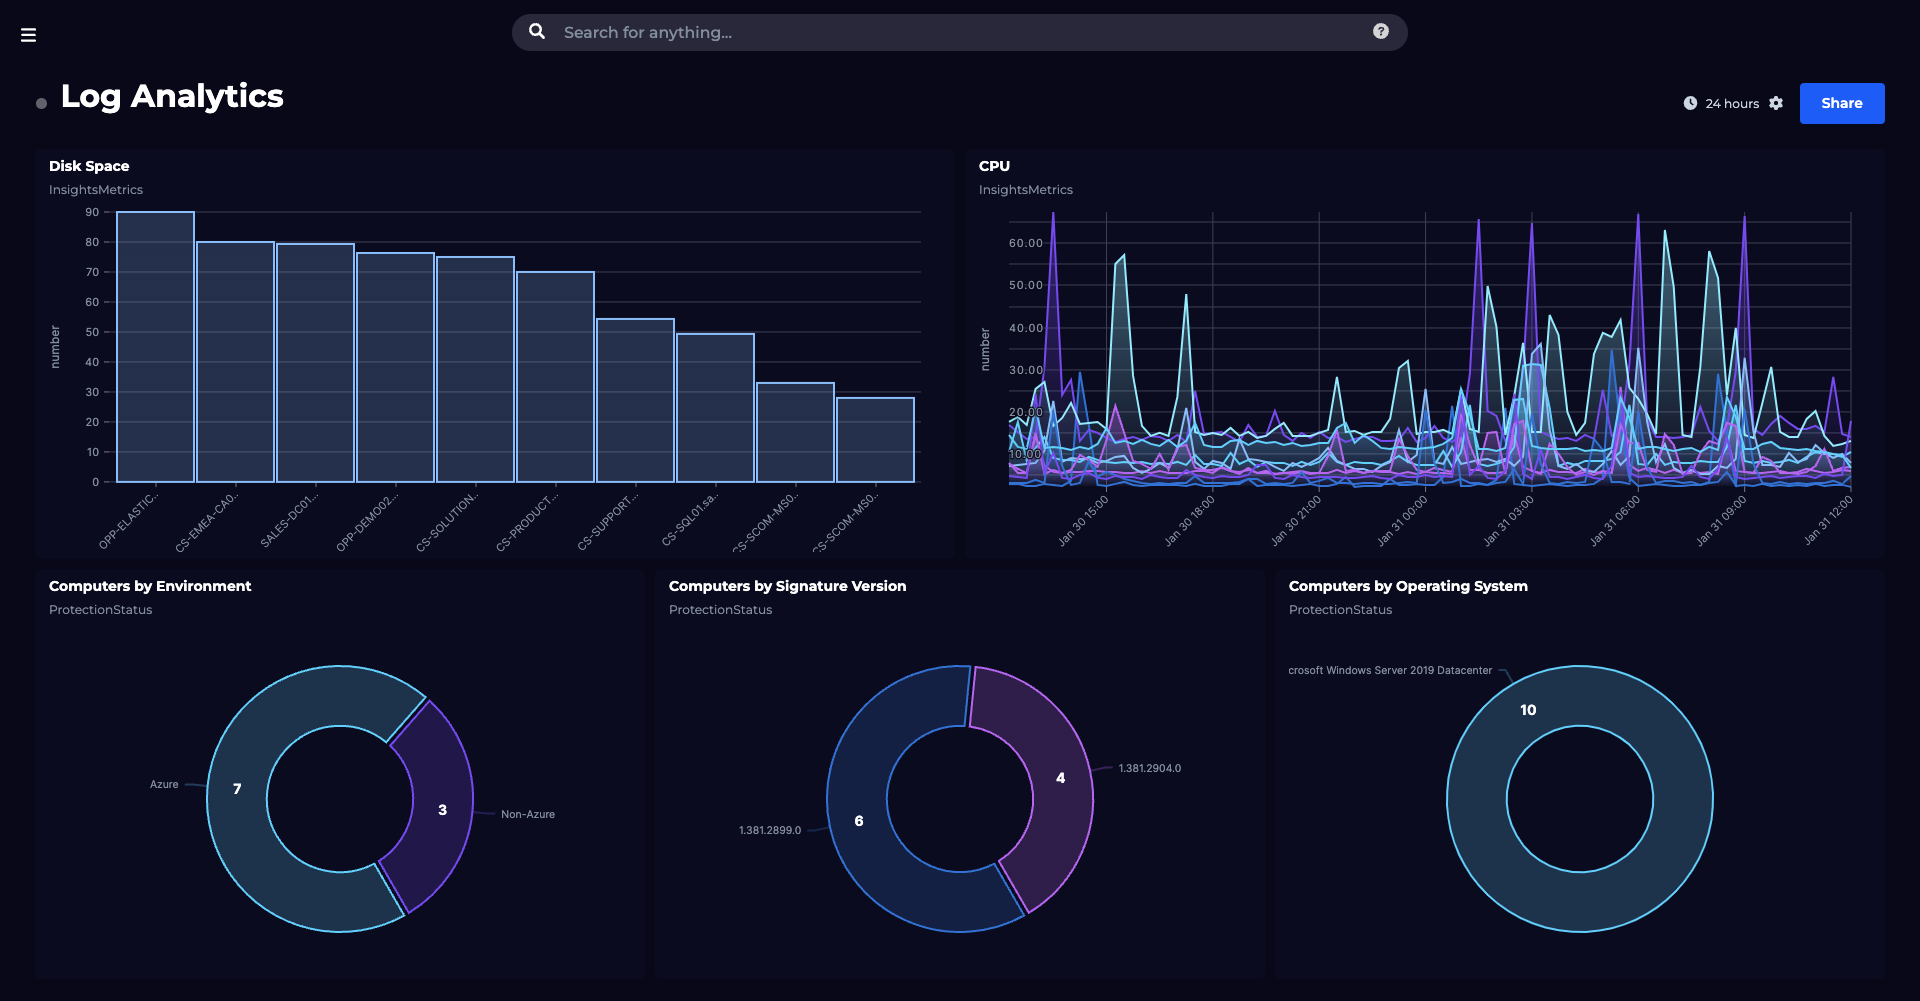
SquaredUp has 60+ pre-built plugins for instant access to data.
Dashboard Story
Dashboard Story