Stephen Townshend
Developer Advocate (SRE)
This is part three in a series where I learn OpenTelemetry (OTEL) from scratch. If you haven't yet seen them yet, part 1 is about setting up auto-instrumented tracing for Node.js and part 2 is where I initially implemented the OTEL collector.
Today we are going to begin experimenting with sampling. We need to sample traces because we capture so much data! It would be impractical to process and store it all (in most cases).
Head based sampling means that we decide whether to keep or discard each trace as early as possible (before the trace is completed).
Head based sampling often uses randomization. For example, we might decide to keep 50% of all traces. The benefit of head based sampling is that it is easy to implement and requires very little in terms of CPU and memory resources. The down side is that we're unable to apply any kind of intelligence to which samples we keep.
Tail based sampling occurs after the full trace is complete. Because of this we can decide whether or not to keep the sample based on what happened. For example, we may decide to keep every single trace when an error occurs so that we can go back and see what happened, but only keep 1% of successful transactions.
Tail based sampling is great because we can be thoughtful about which traces we keep and which ones we discard, but it can be computationally expensive at massive scale.
Today we are going to introduce one new component, a simple script to generate load against the Datapool Manager. I'm going to write this in Go (for no other reason than I've never programmed in Go before and want to try it).
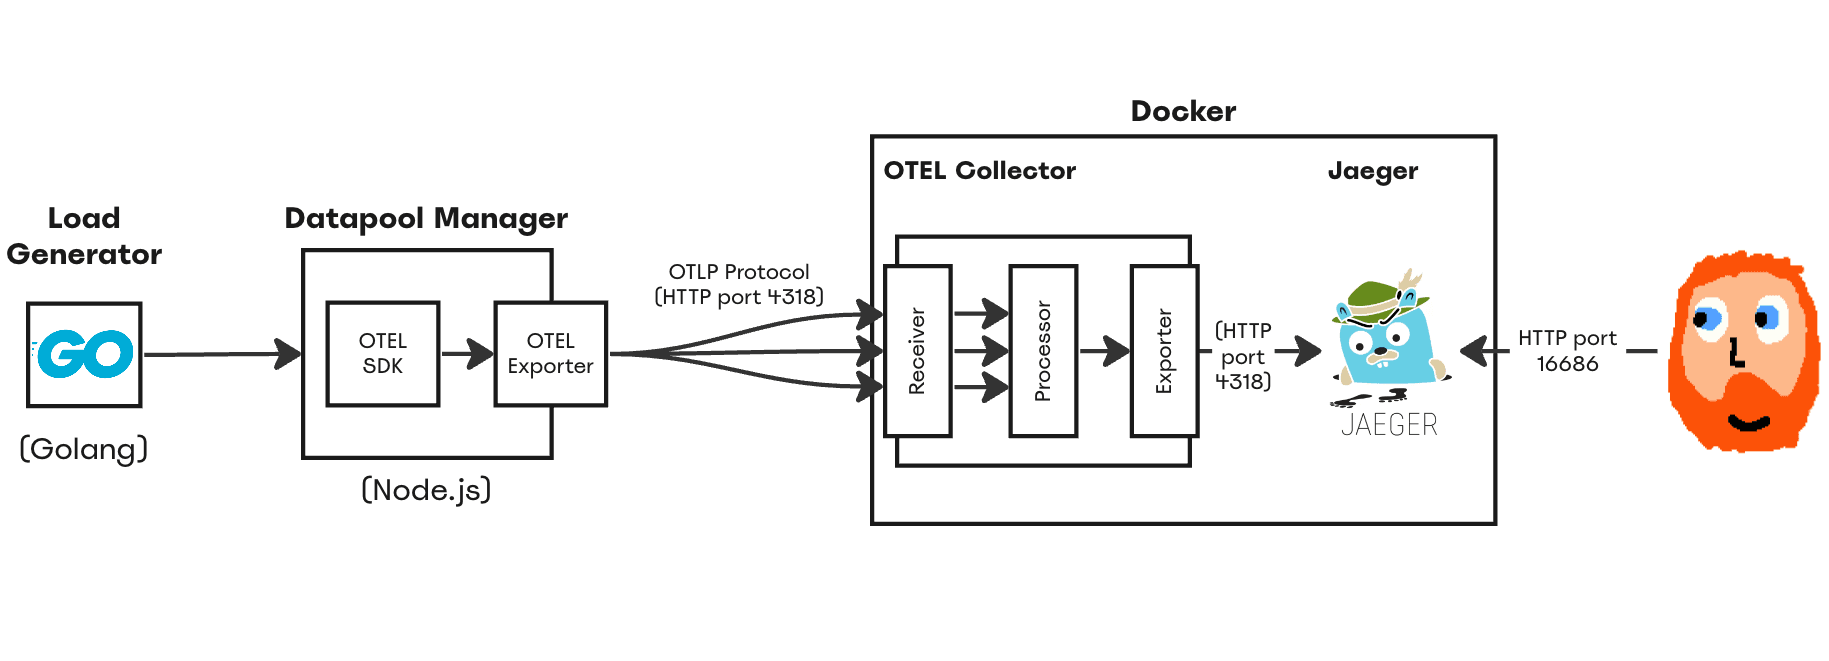
The only other change we are going to make is some configuration changes to the OpenTelemetry collector (YAML config).
The end result is that we're going to make a lot of requests to the Datapool Manager but only keep 5% of the captured traces (to send to Jaeger).
Because I wanted to experiment with sampling I needed a way to fire off lots of requests to my app. To keep it simple, I wrote a small Go module to do that:
package main
import (
"io"
"log"
"net/http"
"time"
)
func main() {
for i := 0; i < 100; i++ {
resp, err := http.Get("http://localhost:9192/DPM/STATUS")
if err != nil {
log.Fatalln(err)
}
//We Read the response body on the line below.
body, err := io.ReadAll(resp.Body)
if err != nil {
log.Fatalln(err)
}
//Convert the body to type string
sb := string(body)
log.Print(sb)
//time.Sleep(time.Second)
}
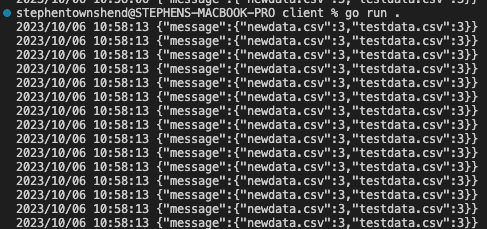
}Now... I've never written Go code before so forgive me if it looks rough. All this does is request the Datapool Manager status page a hundred times. It's a far cry from the elaborate performance test suites I used to build years ago, but it'll do for now!
When I run my Go program I see the JSON response of each request being logged to the terminal:
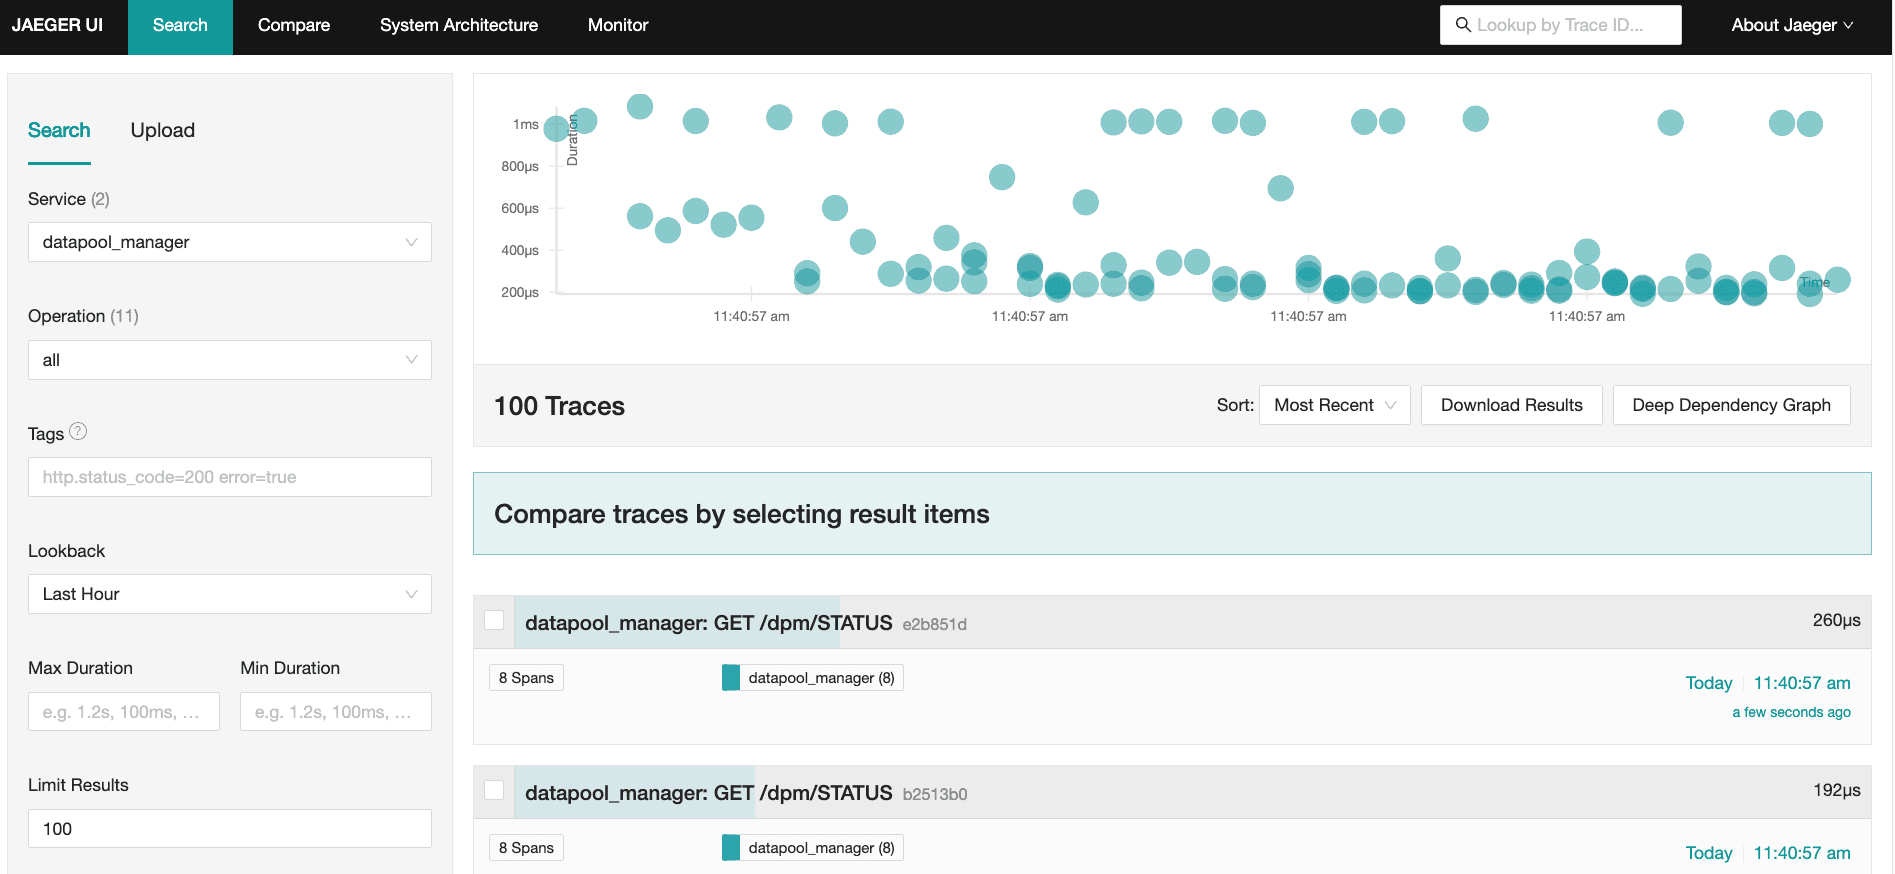
To make sure it's working I started Jaeger, the OTEL collector, ran my app, then fired off 100 requests using my Go module. I could immediately see all 100 traces in Jaeger:
Last time we created a simple OTEL collector config that included a receiver and an exporter. In order to implement sampling we need to add a third element called a processor.
A processor takes telemetry collected by receivers and changes it in some way before passing it on to the exporters. There's all kinds of processors (and you can write your own). Some common use cases might be to remove customer sensitive data from telemetry, or in our case to apply sampling.
For this guide I'm going to apply a very simple rule: Let's keep 5% of the traces we collect, and discard the rest. To achieve this we just need to add three lines to our YAML configuration file:
processors:
  probabilistic_sampler/tracing:
    sampling_percentage: 5
Then under service we need to enable our processor:
service:
  pipelines:
    traces:
      receivers: [ otlp ]
      processors: [ probabilistic_sampler/traces ]
      exporters: [ logging, otlphttp/jaeger ]
Then restart the OTEL collector to apply the changes.
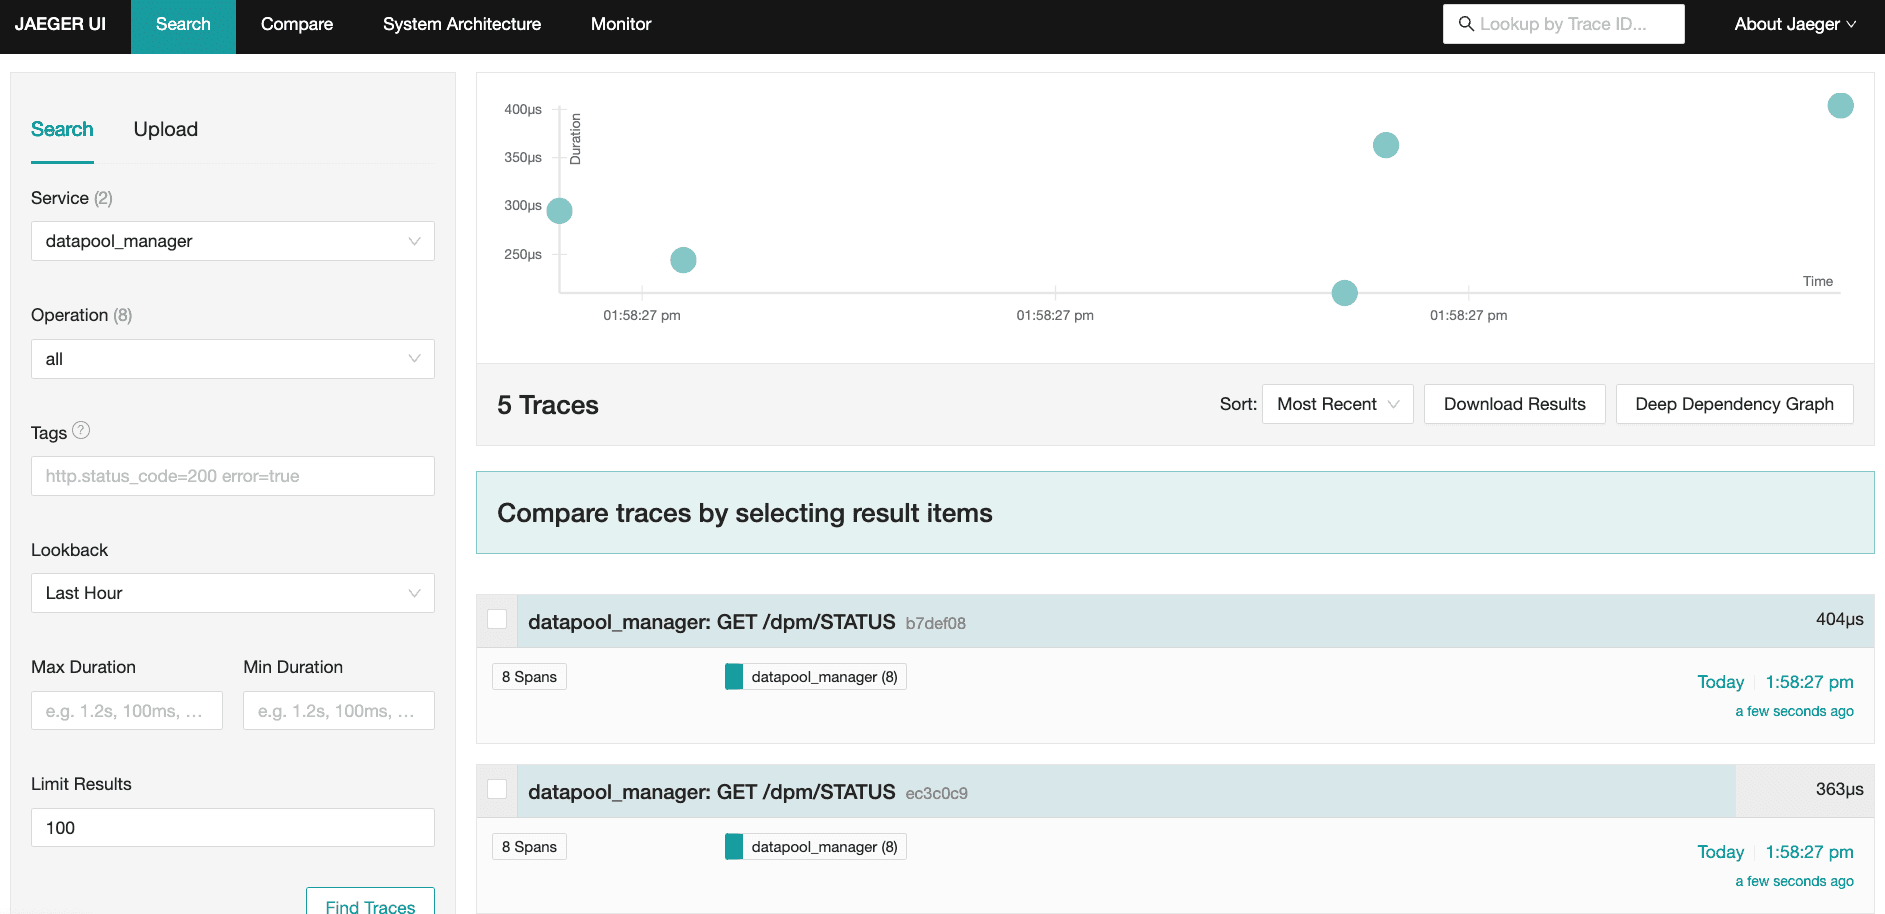
I restarted Jaeger and the OTEL collector and then ran my Go program again to hit the Datapool Manager with 100 requests.
As expected, only 5 out of 100 of the traces captured were passed on to Jaeger to be stored:
That's all there is to it!
Jaeger is a pretty simple tool, and I couldn't find a way to check this... but I believe that consumers of OTEL tracing data are made aware of your sampling algorithm. They take this into account when calculating metrics.
This means that although we are only keeping a small percentage of the traces we capture, our metrics are still representative of the overall workload hitting our services.
Head based sampling is very straightforward to understand and implement, but has limited application in the real world. However, at very high scale, tail based sampling can consume substantial compute resource. Once you hit this level of scale, complimenting your tail based sampling with head based is the way to go.
Next time we're going to implement tail based sampling. I'd also like to instrument our Go client (load generator) for tracing too so we can see the end to end flow of our requests.