How to monitor Citrix NetScaler using SquaredUp
We're pleased to present another guest blog from rising star of the SCOM community and all round good guy, Jasper Van Damme.
Jasper's been busy publishing loads of great, new content on his blog including a step-by-step guide on how you can supplement your SCOM data with insights into the performance of your Citrix NetScalers by using SquaredUp's WebAPI tile.
We've provided a copy of Jasper's awesome work below, but if you'd like to read the original or take a look through Jasper's other posts, you can access his blog directly here.
If you'd like some additional insight into what other systems and tools customers are integrating into SquaredUp via WebAPI, we recommend checking out the following thread on our Community Answers platform.
Enjoy!
Extending monitoring with SquaredUp Web API – A Citrix NetScaler example
By Jasper Van Damme
Today I will talk about an interesting use case for Citrix NetScaler monitoring with the SquaredUp Web API tile. Keep in mind that this is only used for visualization purposes, as the Web API tile will not alert on anything. I am using the Web API tile to supplement the NetScaler management pack with additional data.
The example I’m showing today is fairly straight forward, I had a few Citrix NetScaler counters missing in SCOM, which are available through the NetScaler API.
I wanted to see the current connections and data throughput for each load balanced service. As NetScaler licensing is based on throughput, it is interesting to know which load balanced service is consuming most bandwidth.
Keep in mind that you’ll need the Citrix NetScaler Management Pack (which was previously owned by Comtrade) if you want a virtual server specific statistic perspective. But, depending on how you set it up, this is not a requirement.
I have tested and implemented this with Netscaler v11.0 and up.
Configuration
To get API data in SquaredUp, the first thing you’ll have to do is create a read-only user in NetScaler. I’m not going to cover this as this process is fairly straight forward.
Once the user is created, we can create a new Web API Provider in SquaredUp.
Creating the provider
- Go to Settings
- Select Web API
- Click Add new provider (this can be done for each NetScaler environment you have)
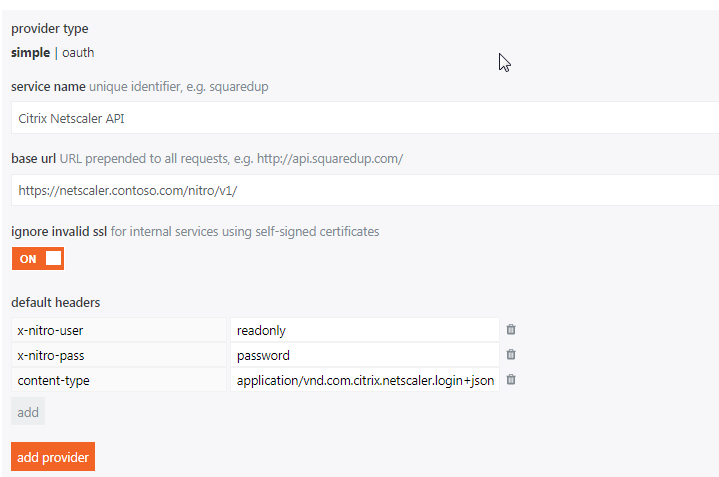
- Fill in the Service Name
- Base URL is: https://<yournetscaleraddress>/nitro/v1/
- Ignore valid SSL: ON, unless you do have a valid certificate for this
- Add the following default headers:
- x-nitro-user - <username that you created earlier>
- x-nitro-pass - <password that you created earlier>
- content-type application/vnd.com.citrix.netscaler.login+json
- Finally, click Add Provider
Visualizing the NetScaler API data
Once the provider is added, let's create a dashboard!
- Start by clicking the plus (+) icon at the top
- Select Web API tile
- Select the provider we created earlier
In this case, I want statistics for all my virtual servers created on the NetScaler.
- The API documentation says you can do this by adding /stat/lbvserver
- Leave headers and data empty
- In reponse data, fill in lbvserver as key path
The API returns JSON data in this case, and the values we need are contained in lbvserver. If you want to show statistics for other types of objects, an overview can be found here.
- Once the key is filled in it should show all the available data
- In Grid Columns we can hide certain columns and rename titles if required
After fiddling with the columns and giving the column headers a more friendly name, it looks like this:
Show data using the scalar view
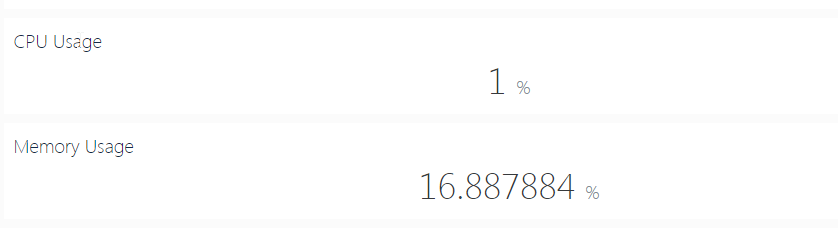
Let's add CPU Usage:
- Select the same provider as previous
- This time fill in stat/systemcpu
- Go to Response Data and add systemcpu.0.percpuuse
This reflects the first value that is returned for percpuuse
- Select the Font Size and Unit (in this case %)
The end result loos like this:
Creating a perspective for each load balanced virtual server
The last thing I want to cover is creating a perspective for each load balanced virtual server in SquaredUp. This does not require the Comtrade Citrix NetScaler MP!
- Create a dashboard containing your Load Balancers - start by using the column icon
- Add a new status tile
- Choose advanced scope -> Citrix NetScaler Appliance
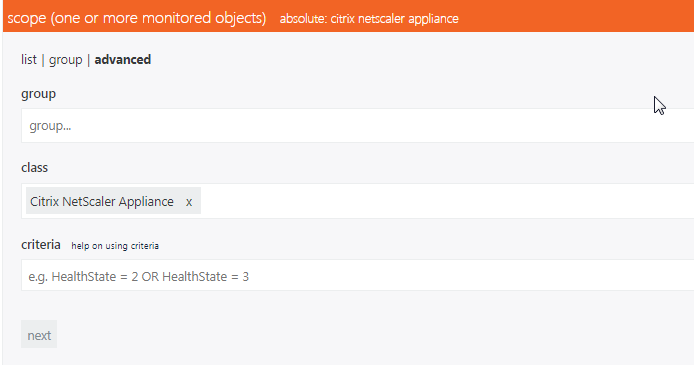
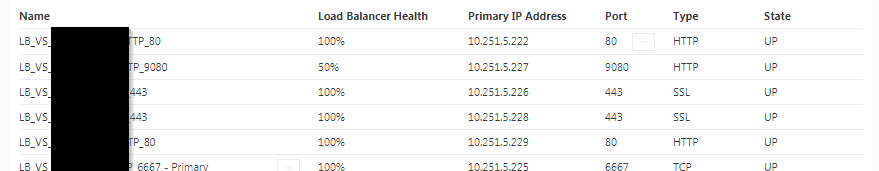
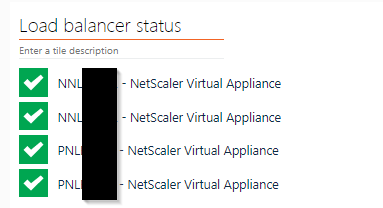
The end result should be a list containing all your monitored NetScaler appliances - something like this;
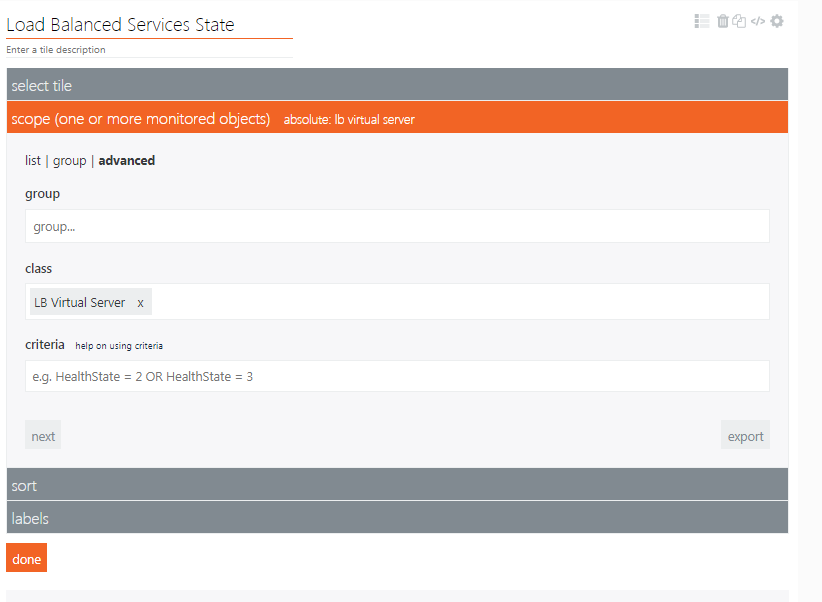
- Add another State Tile with this scope;
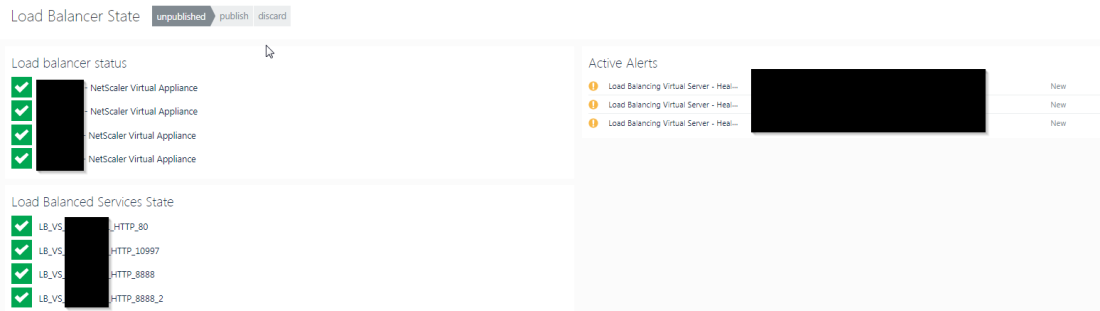
- In the right hand column we'll add an Alert tile using the same advanced scope
- This should result in a very simple dashboard
Configuring the perspective
- Click on the state of one of the Load Balanced virtual servers
- Create a perspective by clicking the plus (+) icon
- I'll call this perspective 'API Statistics'
- The rest can remain default
- Click Done
Now create two columns in the perspective. I'll walk you through creating this perspective:
To achieve this result, we'll create seven Web API (Scalar) tiles. You can download the configurations required to get this data here.
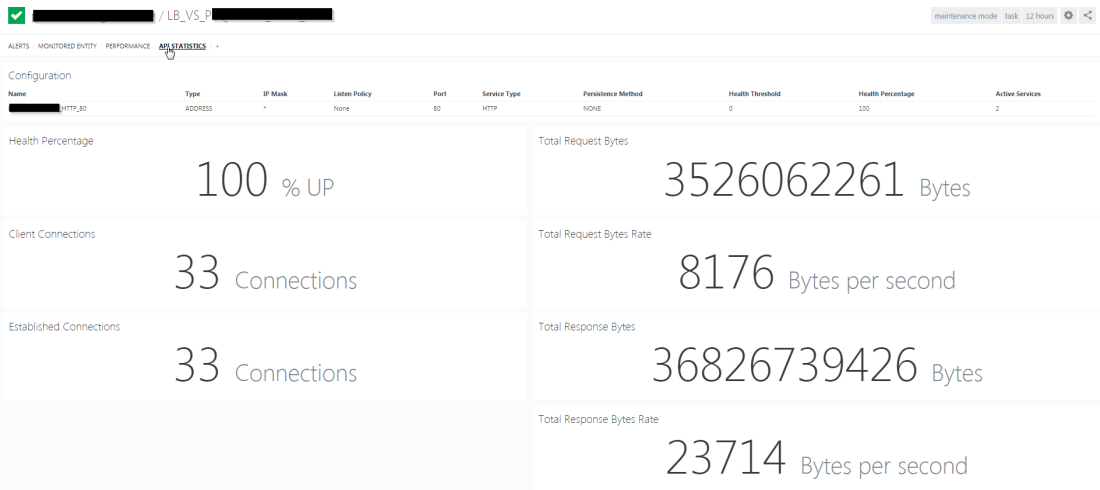
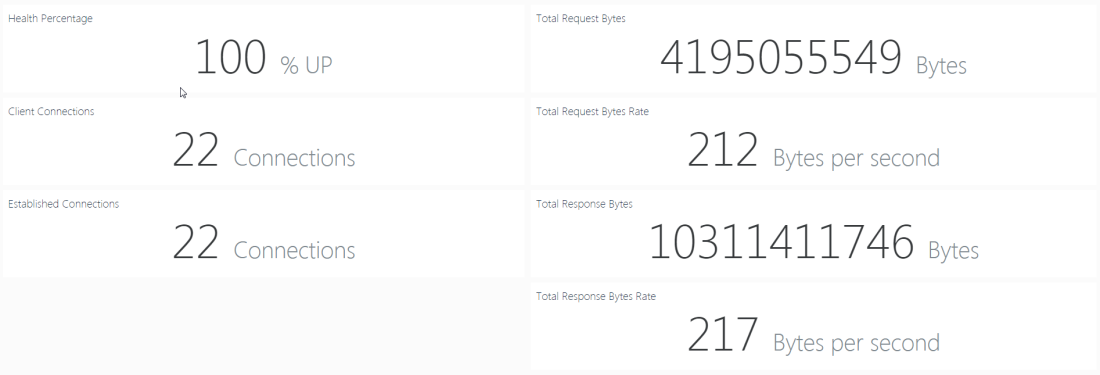
Once configured and published, you should see this data for each virtual server.
The {{displayName}} value will make sure that the statistics are changed based on the virtual server you drilldown into. The ‘0’ in the response data represents the first value of the API response.
Summary
Hopefully that gives you an idea of the usefulness of the Web API tile. Remember you can combine SCOM data and Web API data as well, like this:
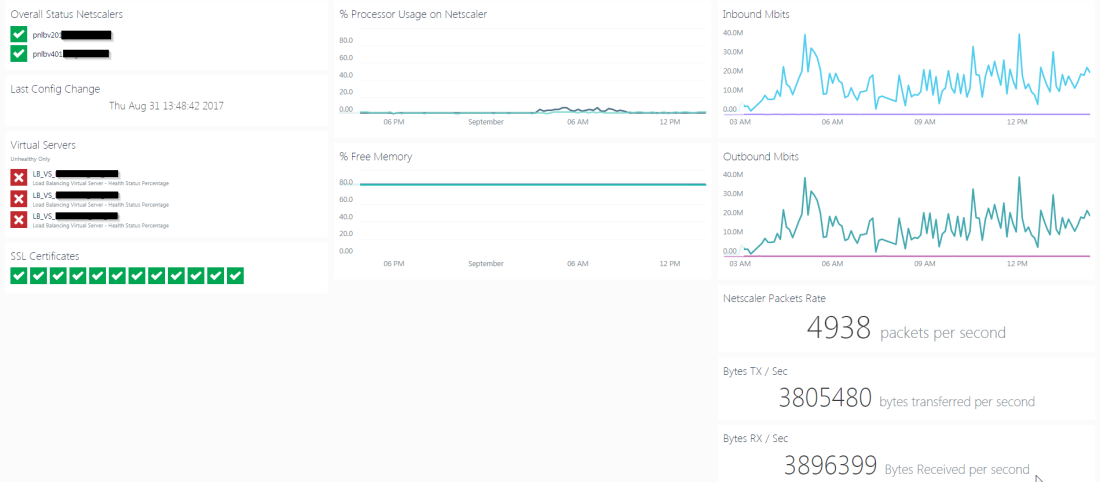
Obviously this is merely scratching the surface of what is possible with the NetScaler API, I just thought I’d share my insights with a few possibilities.
Best regards,
Jasper