Simply awesome dashboards for total visibility
Visualize and monitor any data from any tool, all in one place.


Thanks to my dashboards in SquaredUp, we can have discussions based on facts, not fiction
Maxime Michel, Engineering Manager, Magnolia International
Surface the insights you need, from the data you already have
Connect
Instantly connect to any data
What really impacts your business? Our easy to use plugins connect your data for total oversight, from code changes to customer interactions. Or, get creative with our Web API plugin to connect to any data source.


Surface
Build the perfect picture
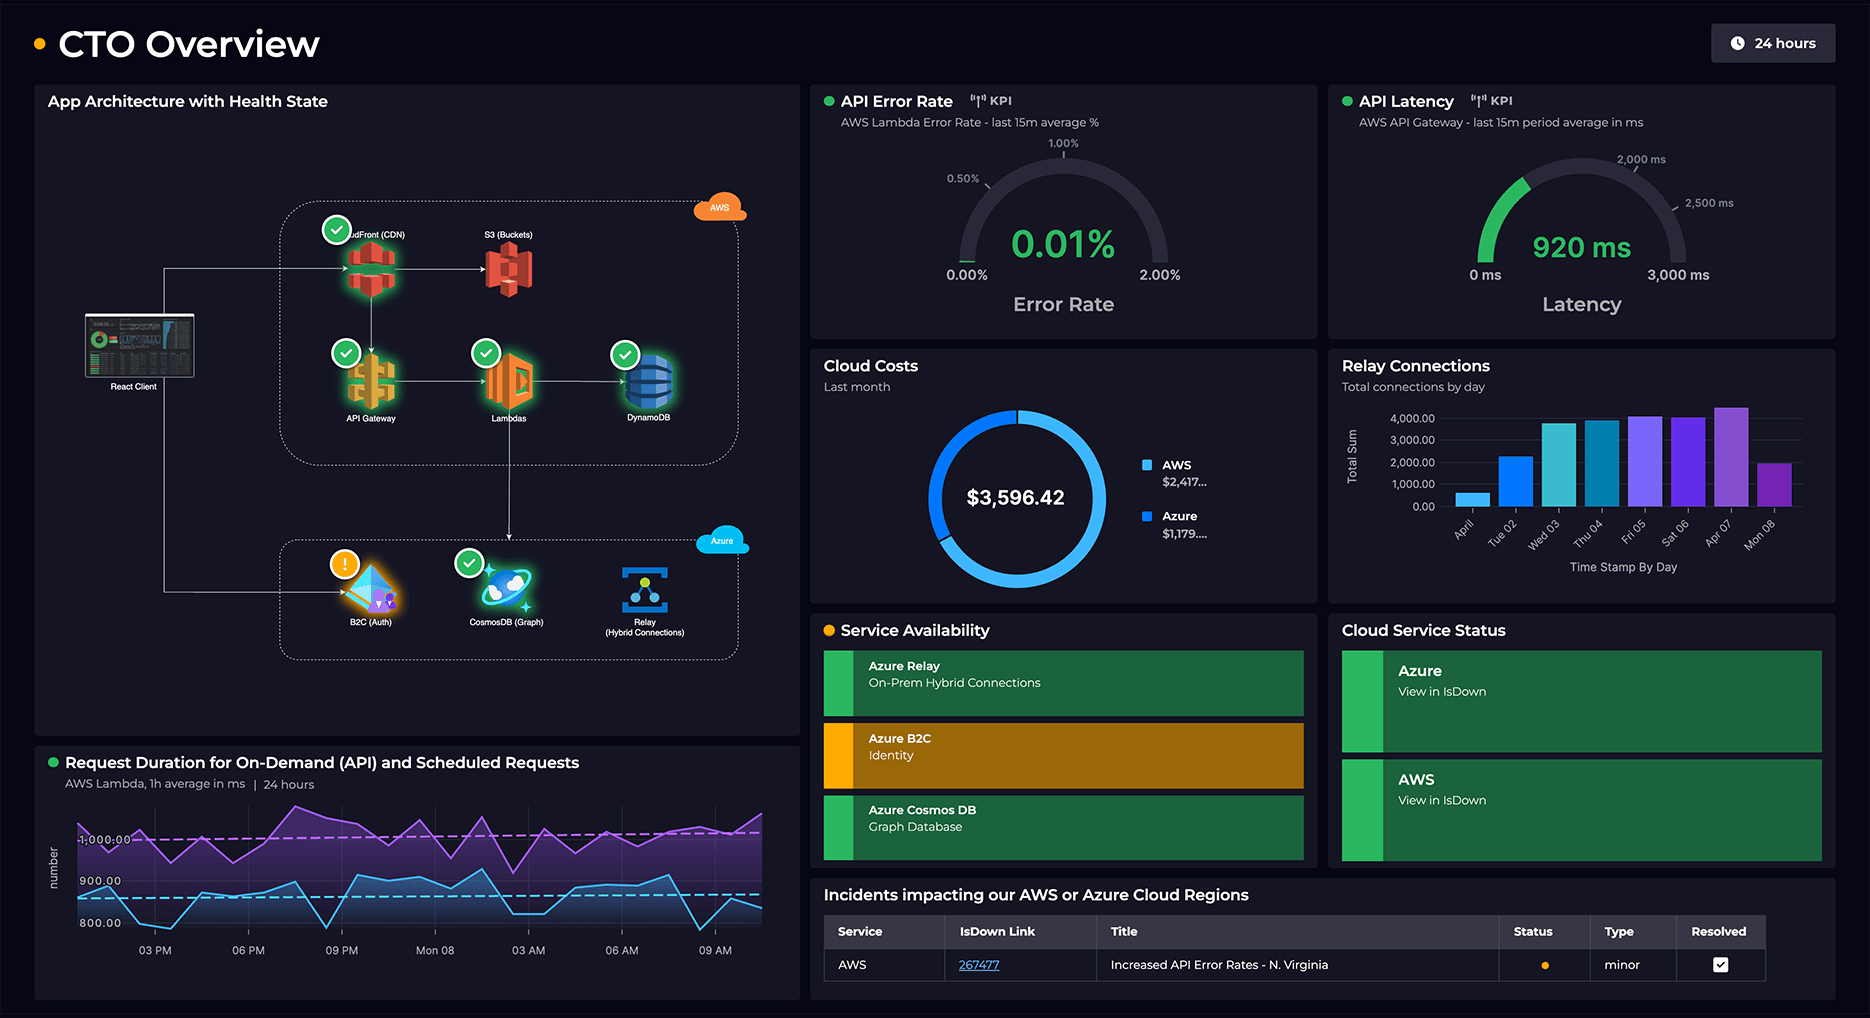
No matter where your data hides, our user-friendly interface makes discovering, analyzing, and visualizing your data as easy as pie. Get ready to make your data work for you!
Visualize data your way and keep dashboards private or share with the rest of the team.
Monitor any data from any tool and get notified in Slack, Teams, or ServiceNow to proactively respond.
Combine multiple data sources and run advanced SQL queries to unlock deeper insights.
Search for objects and data across all of your tools for answers at your fingertips.
Share
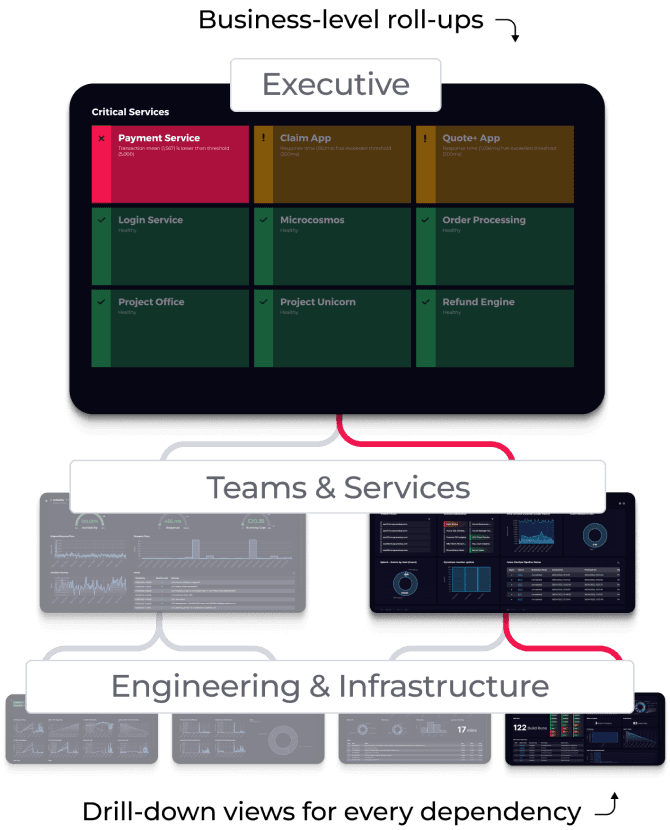
Aggregate, summarize and share
It's easy to get lost in the noise. SquaredUp's unique roll-up architecture gives individual teams ownership over their tools and data, while providing status and KPIs to management and stakeholders.


The smart way to achieve unified observability
Get full-stack observability with the data you already have.
"We wanted to create a modern observability platform with the tools we already had.
SquaredUp provided the missing visibility piece."
Anthony Ashmead, Enterprise Monitoring Lead
We build more than just awesome software
3000+
community members
Connect with a community of experts to share and find answers
Figures taken from the average of the last 12 months, as of the end of August 2023
Bad Observability
There’s plenty of content out there telling you how to implement observability, or what good looks like. But what about bad observability?

Grafana vs. Power BI vs SquaredUp
Compare Grafana vs. Power BI, and SquaredUp. See feature comparisons and the best use case for each platform. See the comparison

How to build the ideal engineering team dashboard
What makes a good software development dashboard? Learn how to visualize all your key engineering metrics in one actionable dashboard.

How Arup achieved unified visibility across teams and tools
Learn how Arup unified visibility to deliver better services for their customers. No data warehouse. Fully self-serve and scalable.

How to measure engineering team health
As engineering managers, we want to understand our team’s “health” to help them be happier and more productive. But what should we measure and track?

Introducing the Notification API
Everyone loves a dashboard, but real magic is when your awesome dashboard comes to you – where you need it, when you need it.

DORA Metrics Considerations
DORA metrics are not a framework that can be mindlessly applied. In this article we explore some considerations to take into account.

We are officially a Great Place to Work!
We’ve been ranked in the top five on the list of UK’s Best Tech Workplaces (Medium). Hurray!