Shawn Williams
Technical Evangelist, SquaredUp


In my position, I get to work with a wide variety of organizations that each have a different level of monitoring maturity. But I’ve noticed an emerging pattern that I’ll call the ‘Critical Service Offering’ or ‘Executive Level Status’ dashboard. At their most basic level, these dashboards should communicate the current health of the application, provide some historical context and, most importantly, not be tied to infrastructure monitoring.
But why is not tying these dashboards to traditional level monitoring important?
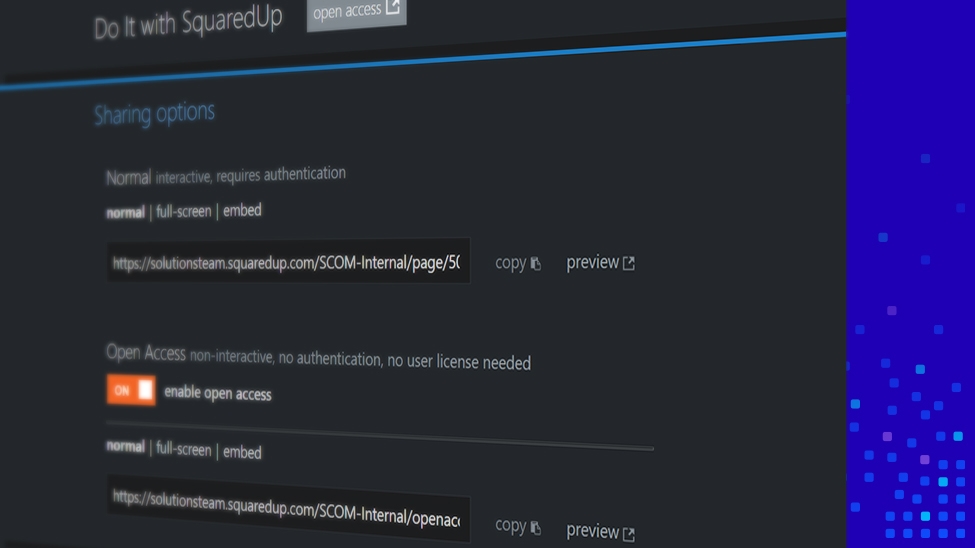
When a Critical Service Offering dashboard is presented to the user, the application’s status should be from the end user’s perspective. In other words, the application status should not show the health from an individual server, system, switch etc., but should show that the service is ‘as a whole’ up and available, end-to-end. At its core, you should be communicating in binary terms, like available or not available. If you also want to share with your users, you can increase to a trinary value, for example, available/problem reported/not available.
Keep in mind that this does not mean infrastructure monitoring doesn’t matter. It matters a lot but to a different audience. And recognizing that there are at least three distinct audiences is your key to success. “Three different audiences?” I hear you ask. Yes, three:
Each team has a different need but uses similar data. That means, if you’re savvy enough, you can build something flexible that will satisfy all three audiences. Indeed, if you have the EAM edition of SquaredUp for SCOM, you already have all the necessary building blocks.
On a related note, this whole concept dovetails with the presentation by SquaredUp Founder and CEO Richard Benwell on the Manifesto for SCOM Success. What we’re describing here would fit neatly into the “Dashboard, Dashboard, Dashboard” section. Engage your business stakeholders with the wall monitor dashboards that show the health of critical applications. Then, ask each infrastructure team what they need to see on a drill-down dashboard to support the application.
Are you ready to make something special? Let’s begin!
For this illustration, we need a couple of ground rules. These are going to provide a focus for what we’re trying to accomplish. These are rules that YOU should define for YOUR organization. If you disagree with the rules I wrote, write your own; that’s the beauty of the EA framework. We also need a list of services that we’re going to model. Since my role is no longer supporting an enterprise infrastructure, I will need to go back to my roots and use some servicesfrom my days working at a university, in a fictitious way, to demonstrate this topic.
The ground rules:
The Critical Service Offerings (CSO)
| Ariba | Cognos | SAP EAM |
| Banner | High-Performance Computing | SAP Finance |
| Banner ODS and DW | Lon-CAPA | SharePoint |
| Blackboard Learn | Office 365 | SuccessFactors |
| BrightSpace | Data Warehouse | Tableau |
The Supporting Service Offerings (SSO)
| Support Team | Offering |
| Database | SQL Server Database |
| Network | DNS & DHCP |
| Network | Wired network services |
| Network | Wireless network services |
| Security | Active Directory |
| Security | BoilerKey |
| Security | CAS (Central Authentication Service) |
| Security | SAML (Security Assertion Markup Language) |
| Storage | Administrative File Services |
| Storage | Career Account Storage |
Since the same team supports one or more of the Supporting Service Offerings, we will create four parent groups to add to the Critical Service Offerings list.
That means we will create 29 Enterprise Applications (EAs). 15 CSOs, 10 SSOs and 4 support teams.
As I mentioned earlier, we’re going to use SquaredUp’s Enterprise Application (EA) functionality for this. But if you need more information, there are also a couple of Support documents and an “Enterprise Application Availability Monitoring” video available.
Start your browser and head to your SquaredUp homepage.
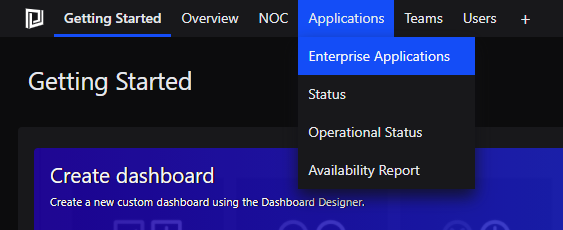
Click on Applications, then Enterprise Applications.
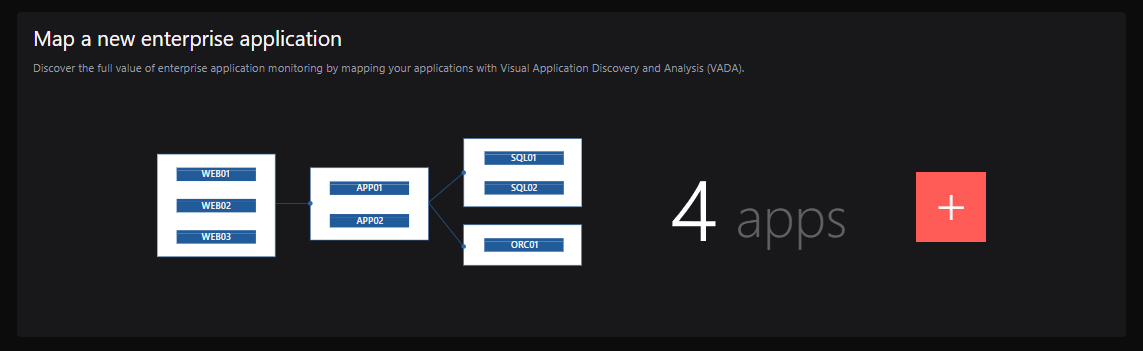
Click on the orange plus button.
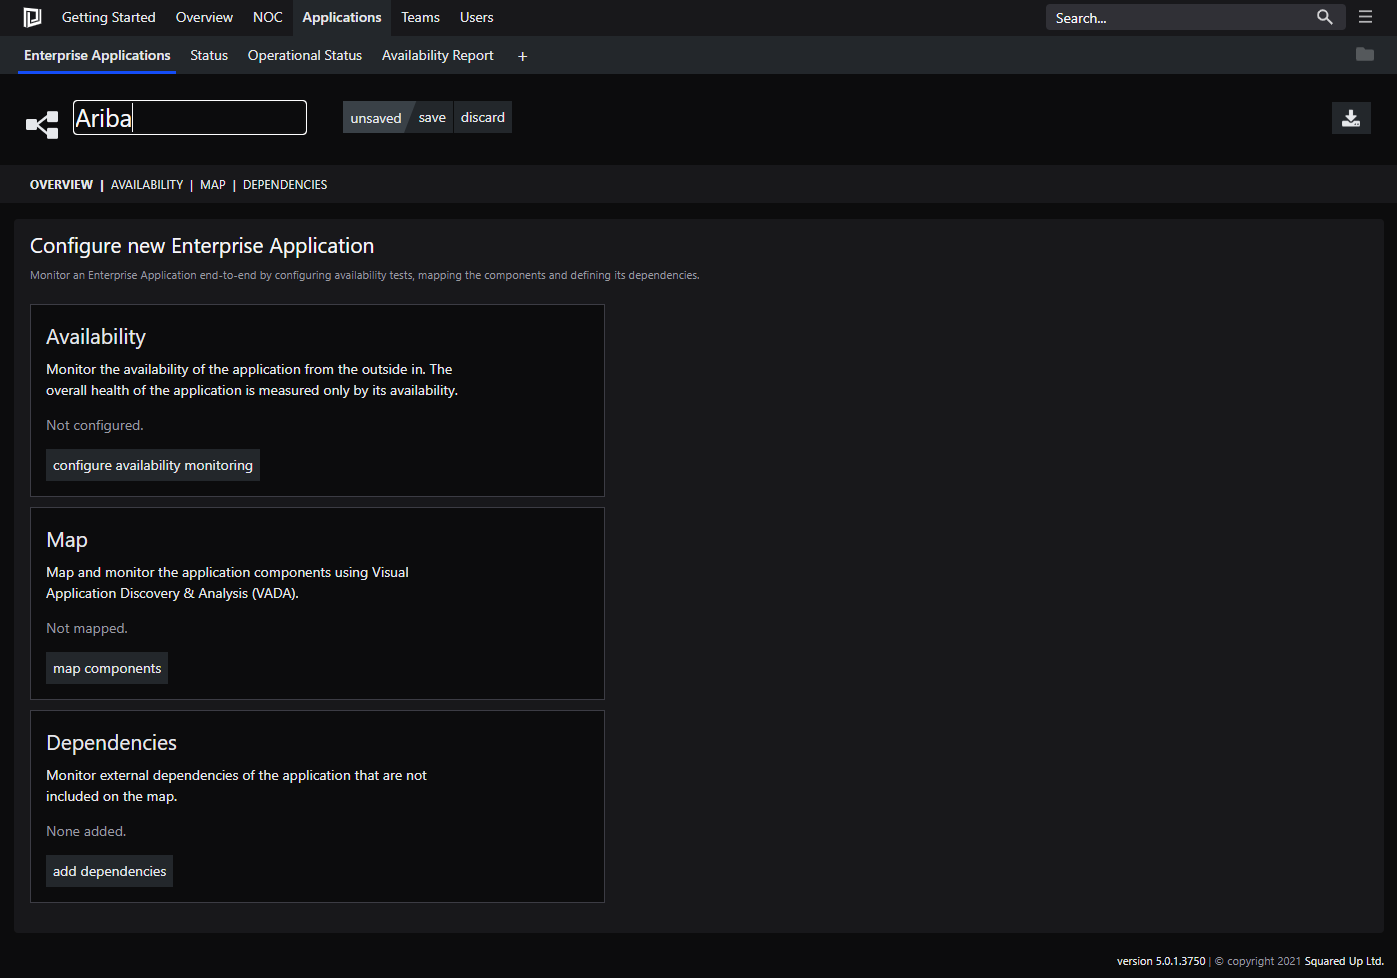
Give our Enterprise Application a name; For our first EA, we will create the Ariba service.

Click “save”.
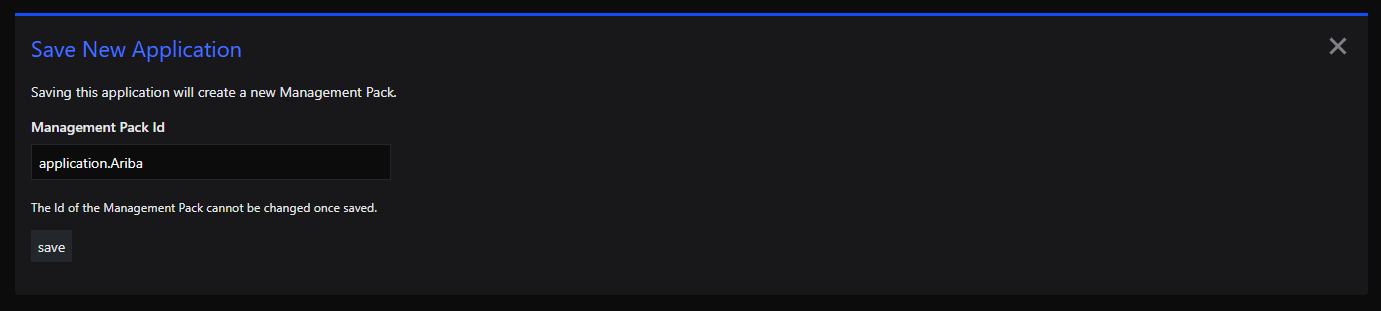
Now give the EA a destination management pack name.
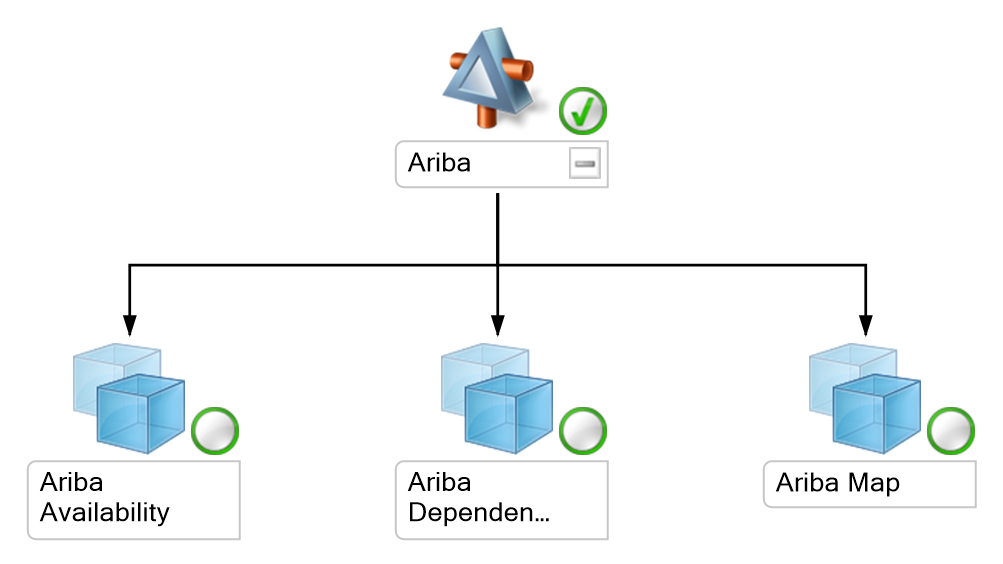
Give the EA a little bit of time to cook, and we will eventually see this dashboard:
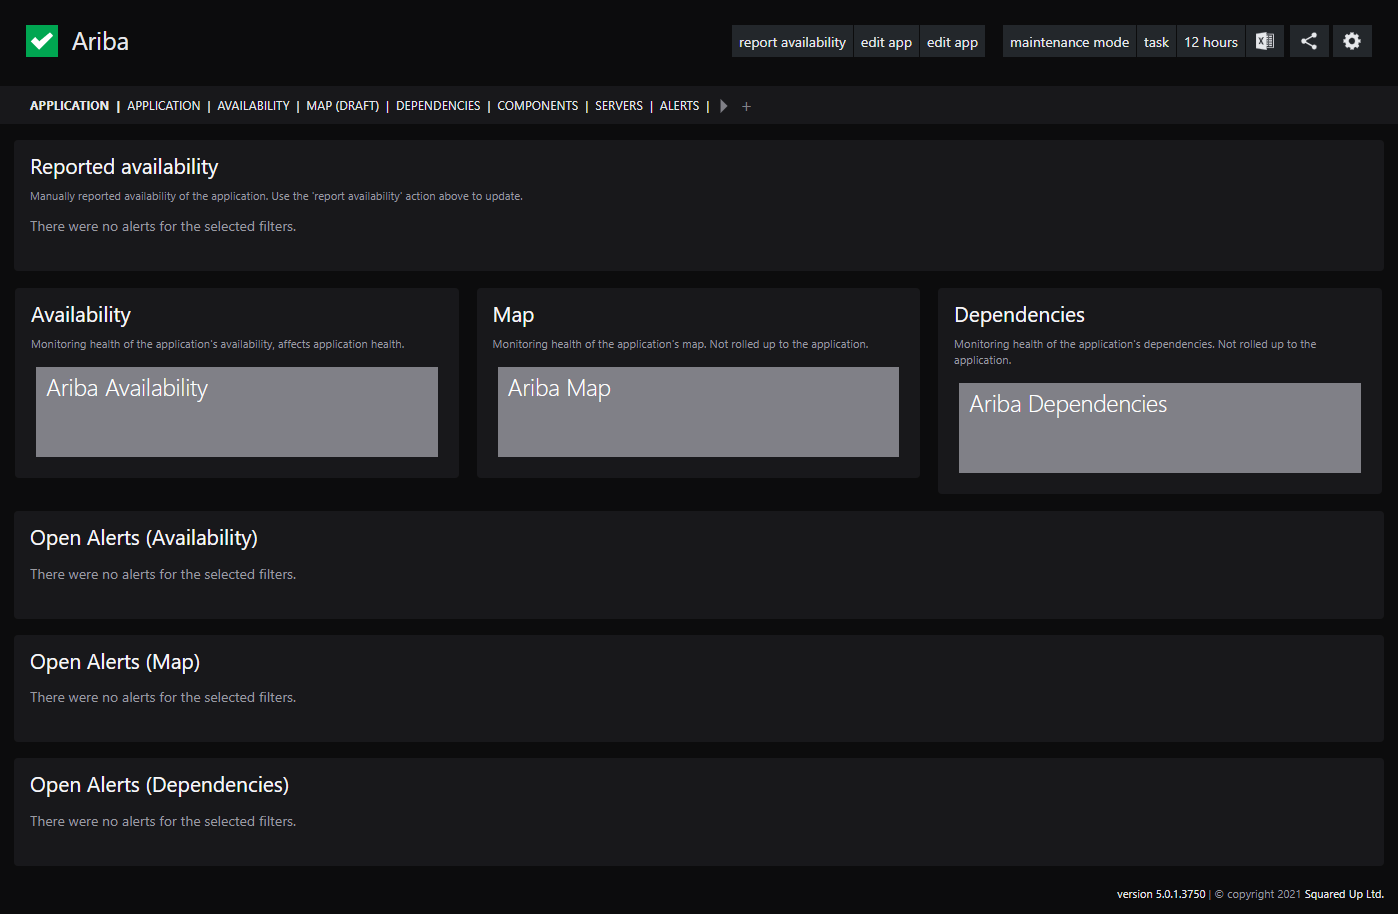
And if you look at the Ariba EA in SCOM, you will see this:
Now, repeat these steps 28 more times! (For those of you who groaned about creating 29 Enterprise Applications, the total clock time was less than 30 minutes. How’s that for speedy?)
Now that we have all 29 Enterprise Applications (EAs) created, we should take a few seconds to review three crucial out-of-box dashboards for Enterprise Applications. The first one is called the “Status” dashboard.
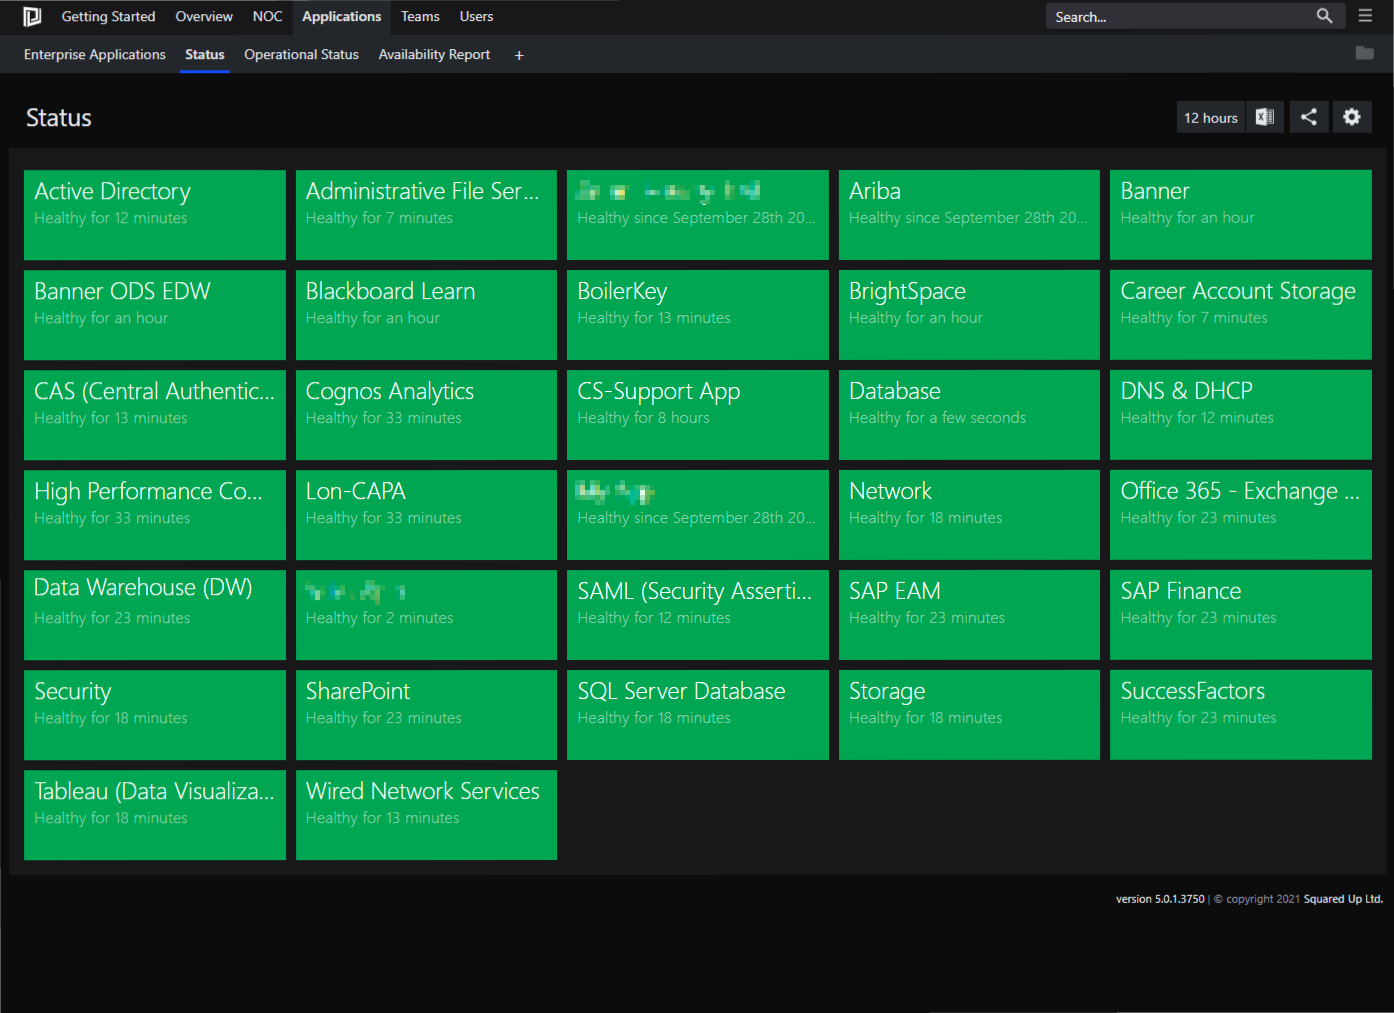
The Status dashboard shows all the Enterprise Applications we created in a simple green/yellow/red colored block style. These blocks show the name of the enterprise application with the last state change underneath. The Status dashboard is an excellent dashboard to use if you need to share health status with your users immediately.
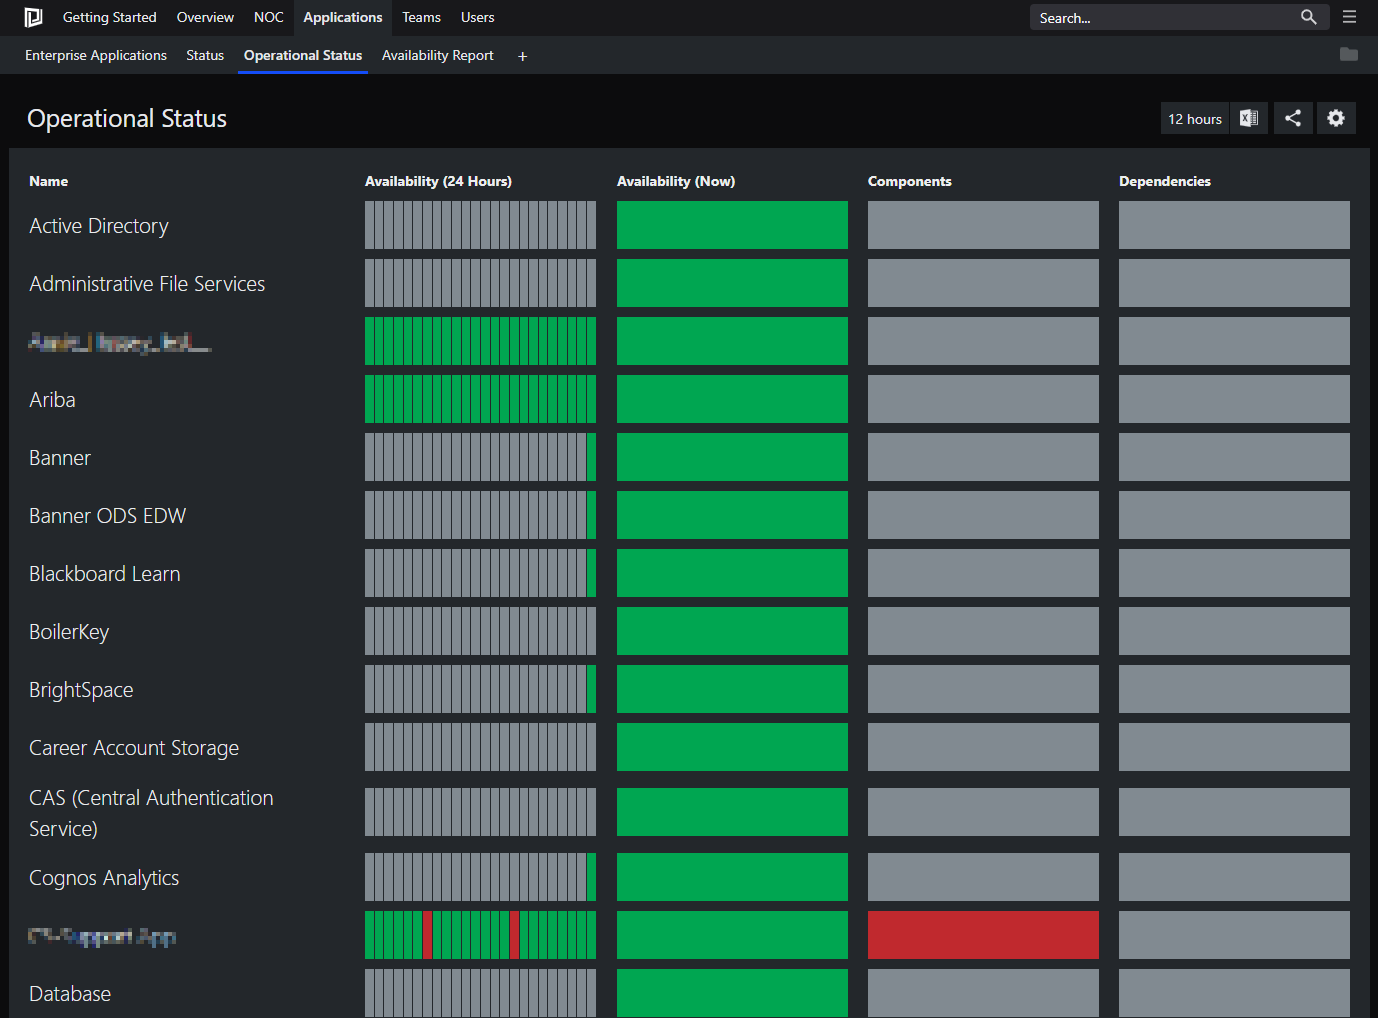
Just like the Status dashboard, the Operational Status dashboard shows all your Enterprise Application. Except this time, it highlights each of the different component groups that make up your EA.
We’ll cover each of these component groups in a later blog, but what is important to show here is the ‘signal strength’ visualization of the application’s Availability. Even though these are ‘empty’ applications, the application’s default availability is ‘available’. And that’s important because if you manually change the health state, you impact the application’s availability.
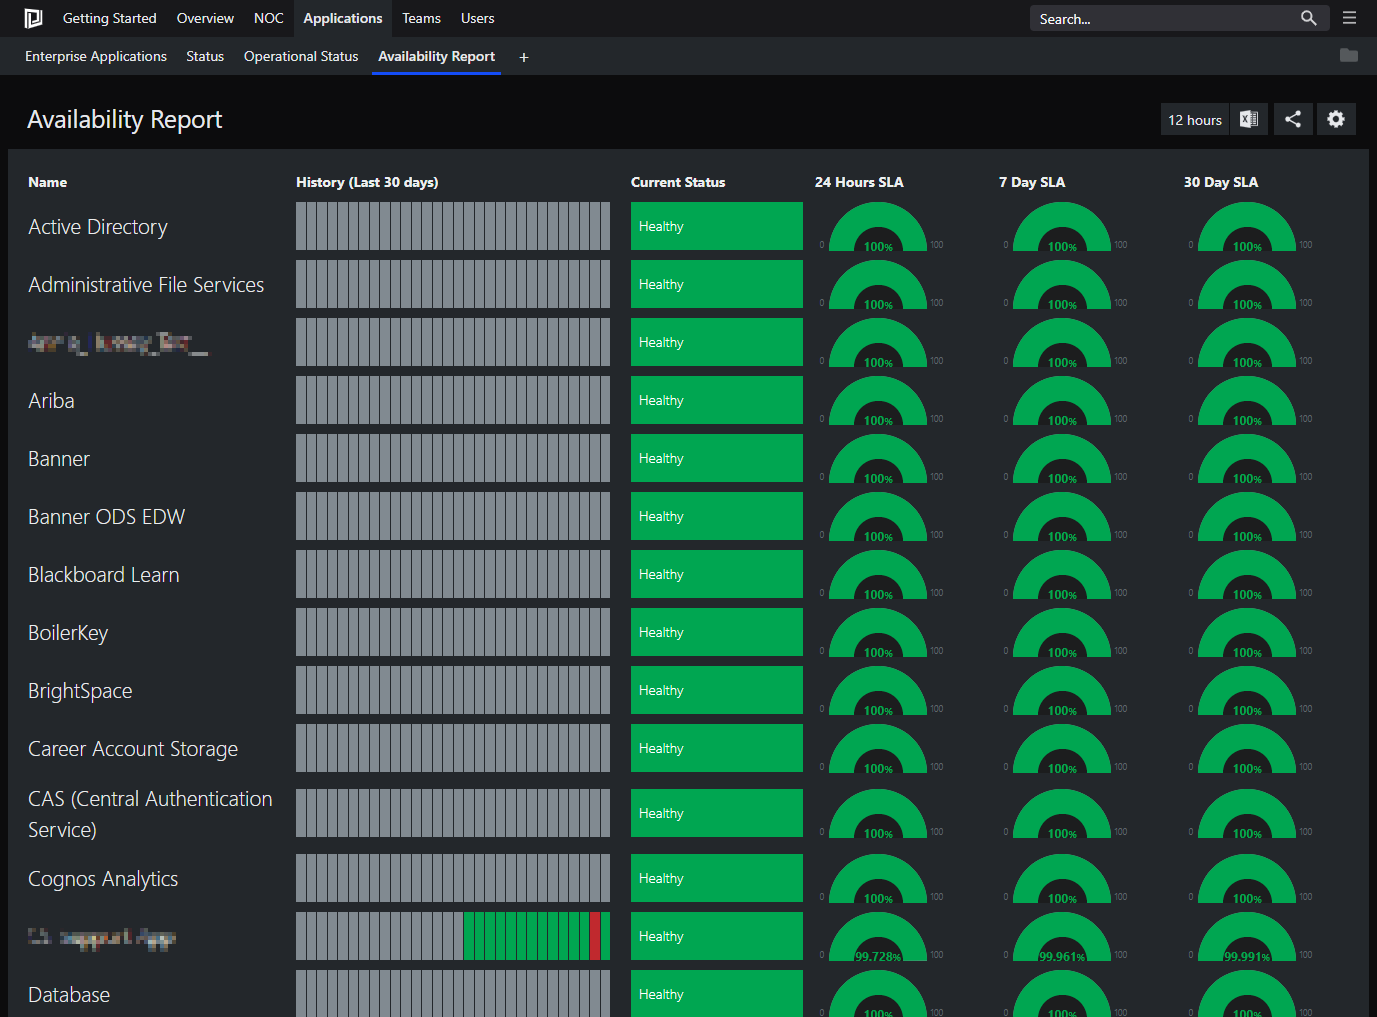
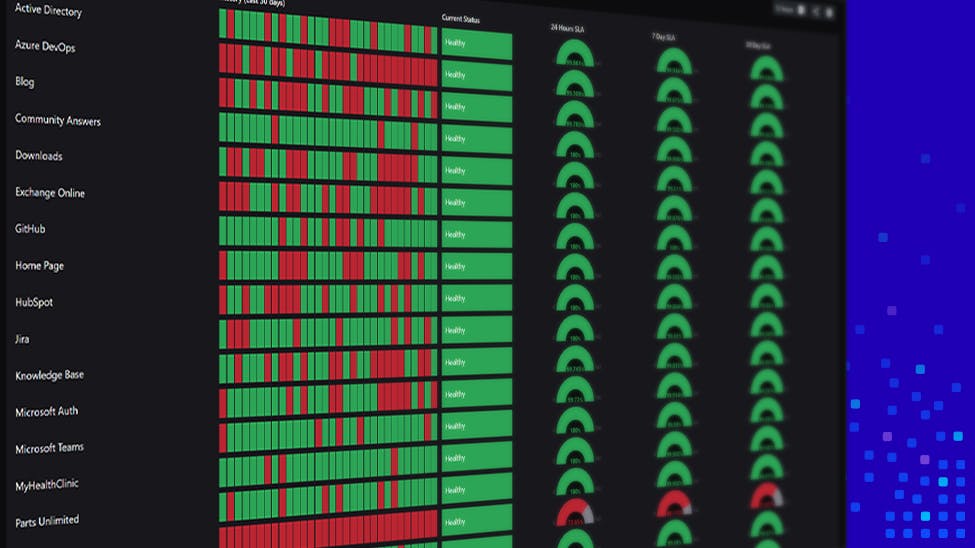
The last dashboard is the Availability Report. When you created the Enterprise Application, a Service Level Objective was created in SCOM. At this point, your Enterprise Applications can only change state if someone manually changes its health state, so that everything will show at 100% by default.
In this blog post, we focused on how to quickly set up crucial dashboards for three different audiences, using SquaredUp’s Enterprise Application feature.
We set some ground rules, identified our Critical Service Offerings (CSO), our Supporting Service Offerings (SSO), created a bunch of Enterprise Applications, and used three out-of-box dashboards. And as a result of our actions, we accomplished the following:
And we were able to do all this in about 30 minutes!
In my next post, I’ll demonstrate how to ‘nest’ our Supporting Service Offerings (SSOs) so that their health rolls up to a parent EA. I will also provide some PowerShell code to toggle the ‘IsBusinessService’ flag, along with an explanation on why that’s important. Finally, we’ll demonstrate how to set the health status to see it all in action.
Till next time!
-Shawn

Coffee Break Series