- Share application status with the Business
- Communicate with Service Status Messaging
- Monitor your Network with Link Dependency Monitoring
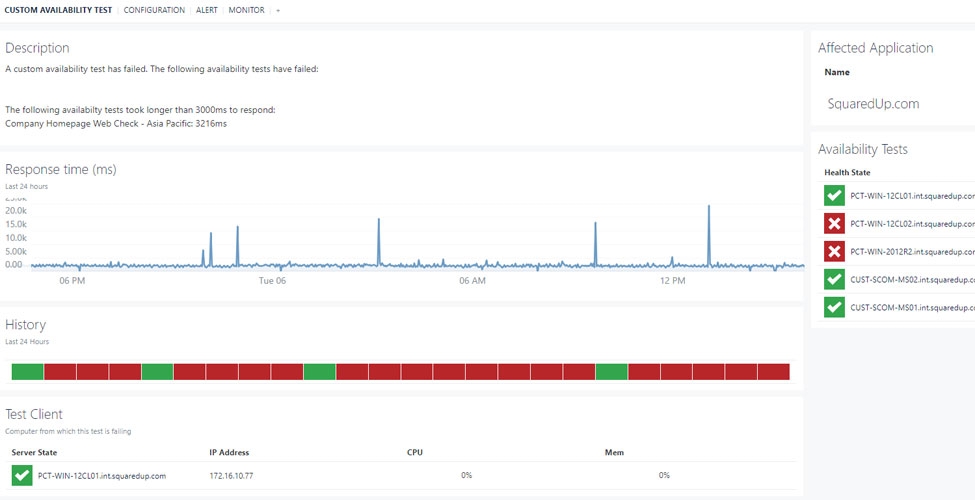
- Set up Availability Monitoring from the end-user’s perspective
- How to automatically map your applications and easily fix server issues

- Share dashboards with the business

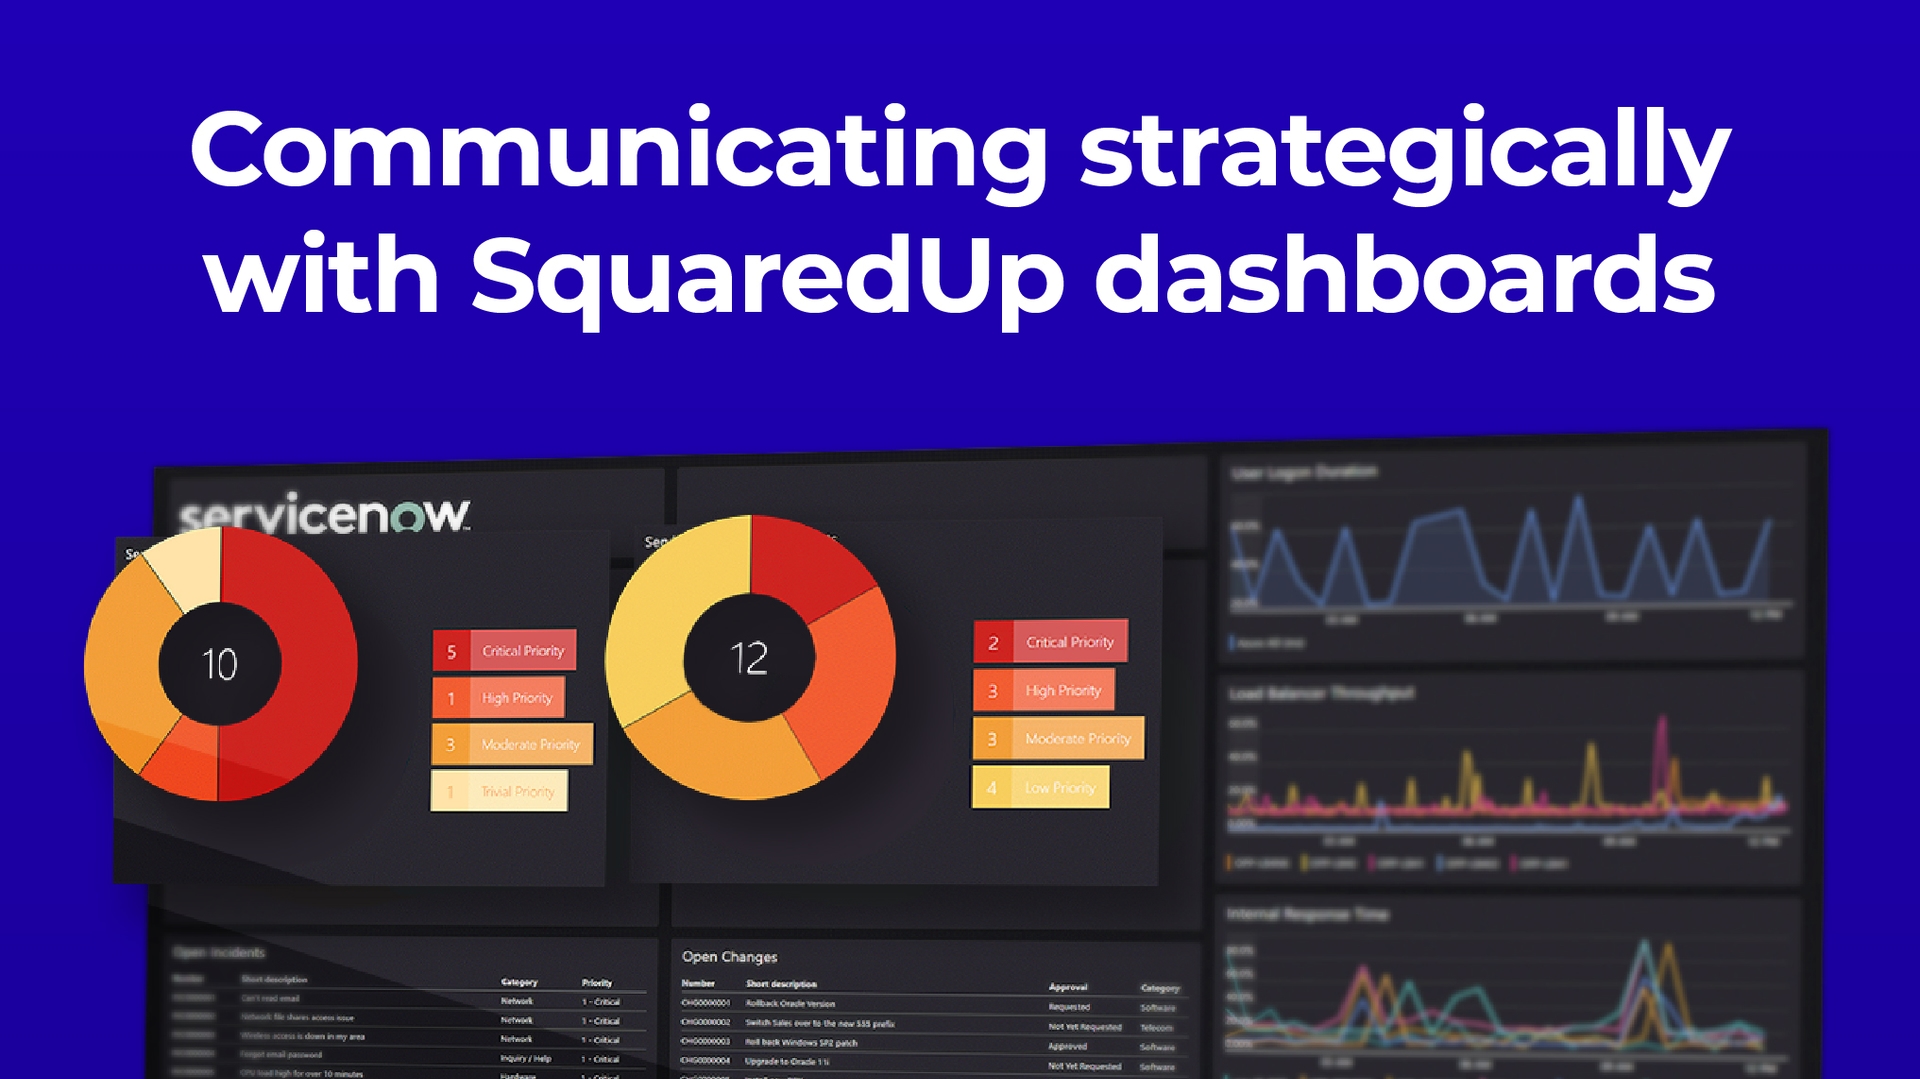
Communicate with Service Status Messaging
Sometimes an organization gets bogged down with the details. It happens. You have all of this fantastic data in SCOM, and you’re trying to share it, but your users don’t care. That’s not true. They care, but what they don’t care about is the server. To put it another way, they care if the service or application they depend on is working.
But here’s the catch, you can’t do this in SCOM. Oh, you can create some pretty slick monitors or rules, but there isn’t an in-box method to manually flip your Distributed Application from Healthy to Unhealthy. And forget about making a dashboard for your users to look at, the SCOM console doesn’t have a feature for that either.
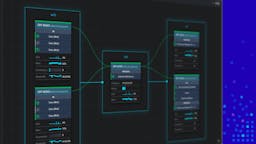
With SquaredUp, though, you can quickly create an Enterprise Application (EA) in about two clicks. And when you do, you immediately get a bunch of dashboards right out of the box.
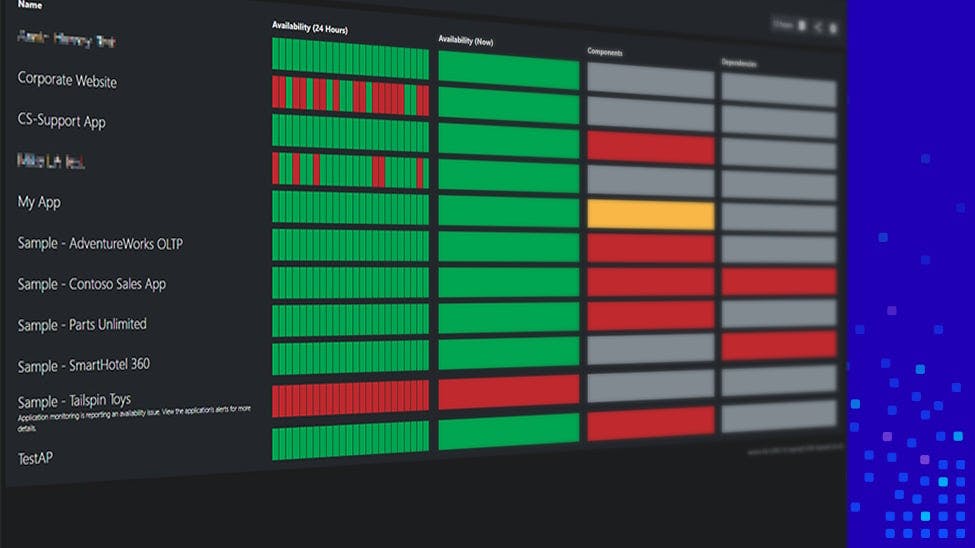
Status dashboards
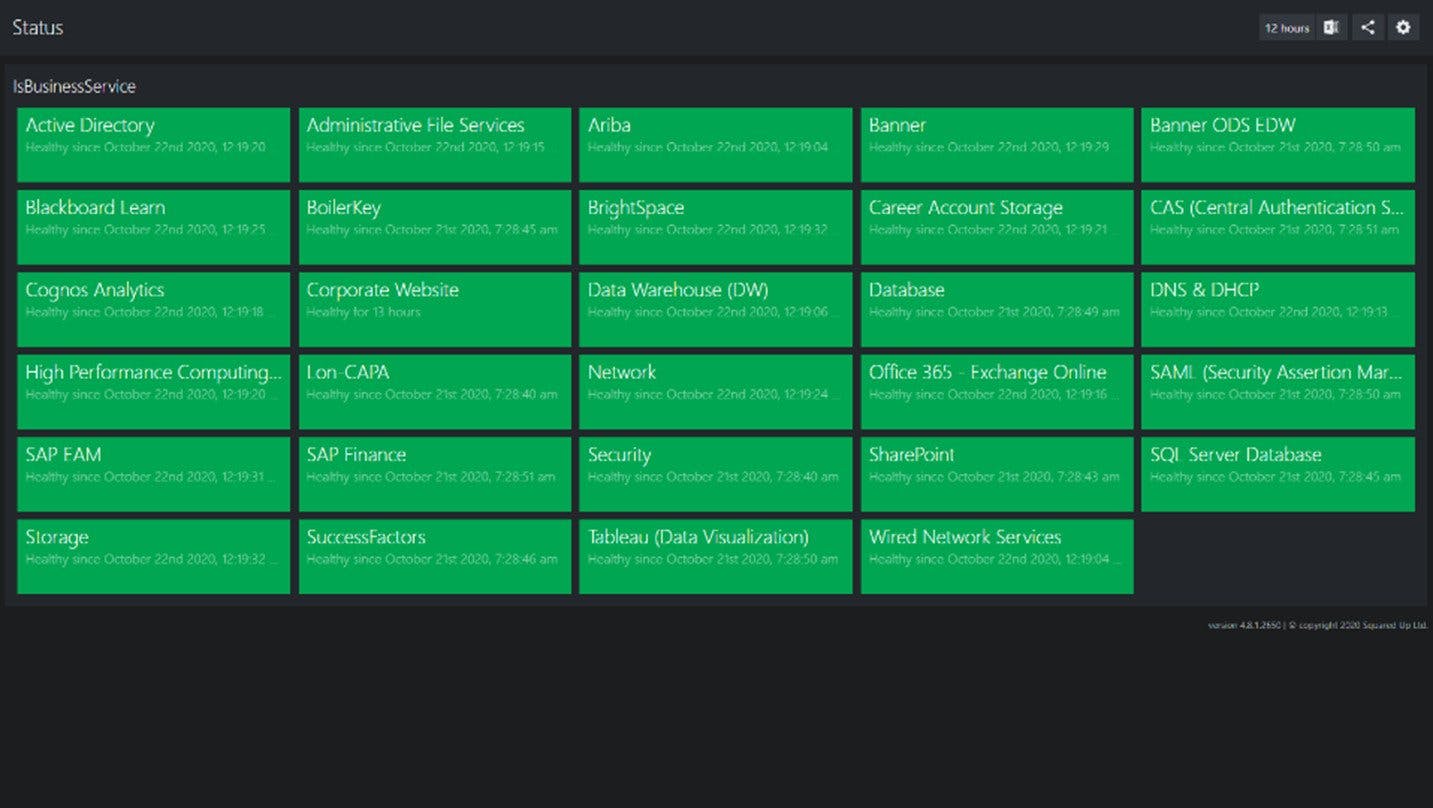
The out-of-box Status dashboard of all of your Enterprise Applications.
The Status dashboard shows all of your Enterprise Applications and their current health. And when there’s a problem, it is immediately apparent which applications are experiencing an issue.
Operational Status dashboards
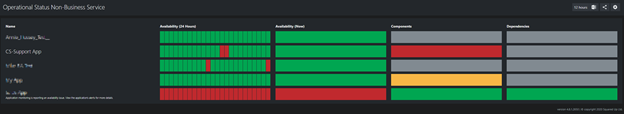
The out-of-box Operational Status dashboard.
With the Operational Status dashboard, you can look at all of your enterprise applications and any related components and dependencies (if you have linked your infrastructure monitoring).
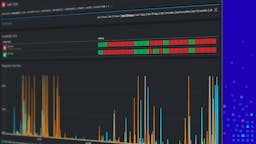
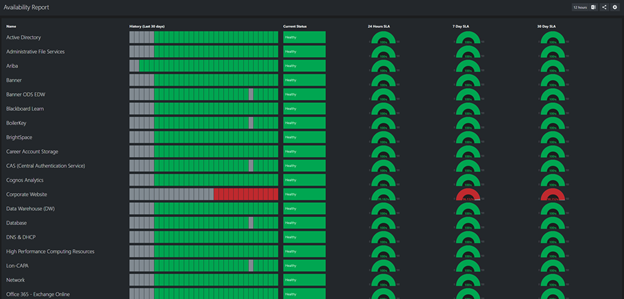
Availability Report dashboards
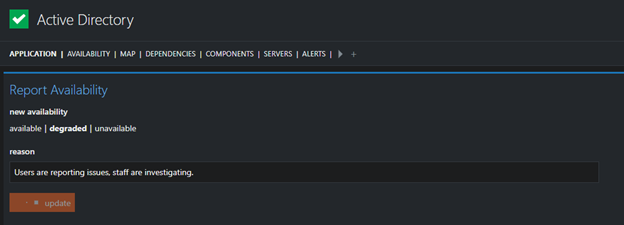
Manually changing the health state of an Enterprise Application.
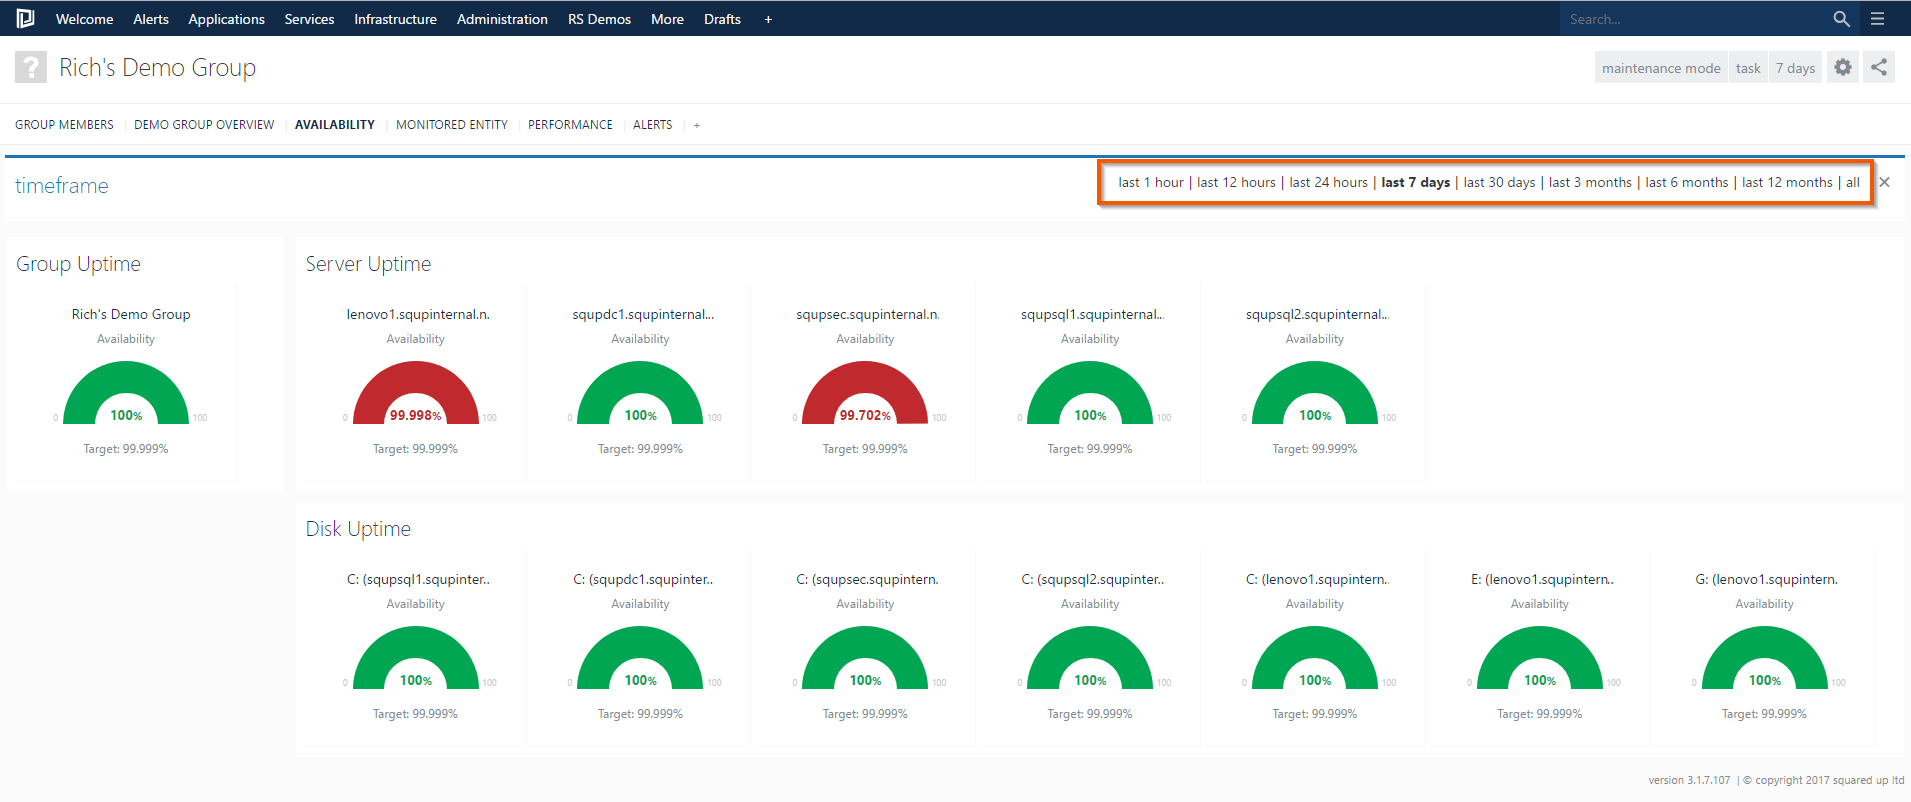
Finally, there’s the Availability Report. This report is unique because when you initially created the Enterprise Application, SquaredUp automatically created some SLA’s for you. Now you can easily see your Service Levels!
How’s that for an easy button?
But what if none of those three cool out-of-the-box dashboards fit the bill? That’s where SquaredUp makes it super easy to customize any dashboard to your specific purpose using our dashboard designer. With a few simple clicks, you can take one of these out-of-the-box dashboards and make it uniquely yours.
With our dashboards, you can also monitor your network with Link Dependency Monitoring and set up Availability Monitoring from the end-users’ perspective. The best part is you can share all the dashboards you create with the rest of the business – on unlimited wallboards, at no additional charge!
Also, don’t forget to check out how we can transform your SCOM console and drastically reduce monitoring silos through integrations and improved visibility. Ready to test it out yourself? Take out a 30-day free trial using the form below or book an introductory call with a member of our technical team.