

Get detail AND insight from your metrics
We who use SCOM know about its extensive monitoring capabilities, but the static nature of the SCOM console is not one of its strong points. You can’t drill down to see the data, or correlate data with other data types or alerts for the same object. To the delight of our customers, SquaredUp allows you to do all that and much more – so that you can get all the detail and insight you need, from the metrics you are already collecting.
Let’s compare the SCOM Console against the equivalent SquaredUp dashboard, in terms of the level of insight you’re getting from the same data.
How much insight are you getting from your dashboards?
SCOM
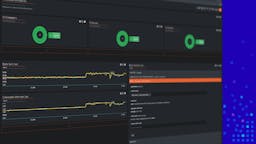
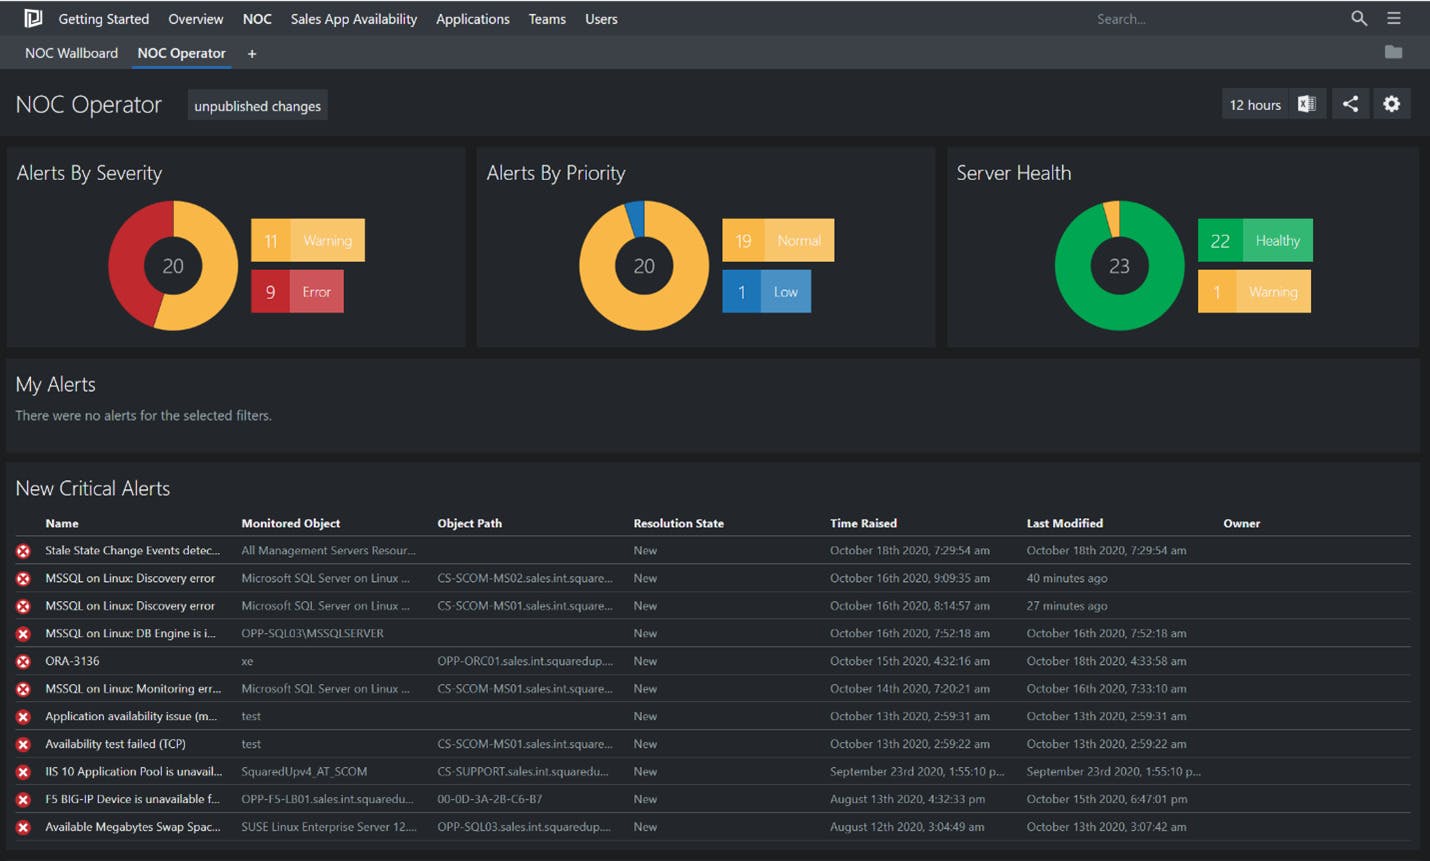
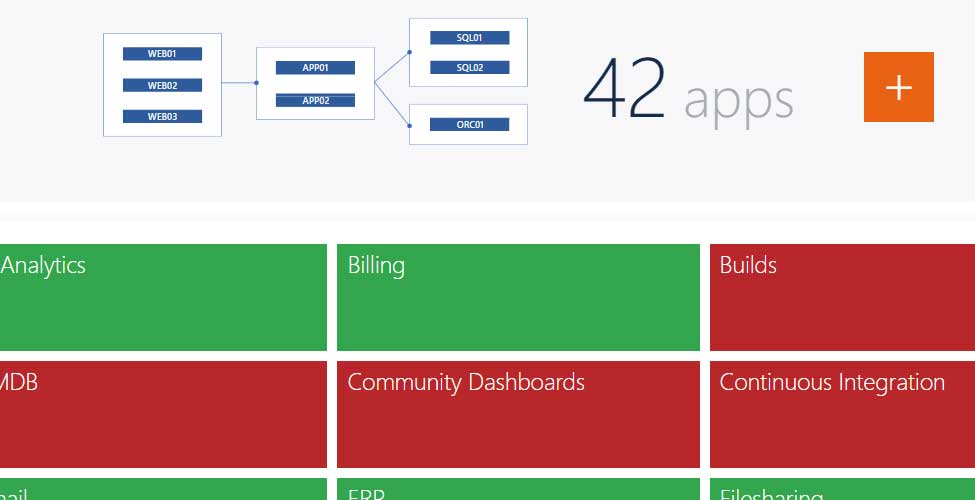
Let’s look again at the NOC dashboard example from my earlier blog.
You can see the data, you can see there’s an issue somewhere but you can’t do much about it. There’s very little to no drilldown at all, and no correlation with other alerts on the same object or different data types (status vs performance vs alerts etc.).
Also, everything you see here is coming from SCOM, so if you have a different set of data being collected from a different tool, or simply track the alerts as incidents in an ITSM tool, you have no insight into it at all. This translates directly into MTTR (Mean Time to Response/Resolution). And a high MTTR is no good.
Let’s compare that with the SquaredUp dashboard example
SquaredUp
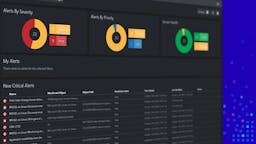
You can see the list of alerts – same as the SCOM console. The difference is how you can work with those alerts. You can drill down to see more details.
Drilldowns, custom perspectives, and more
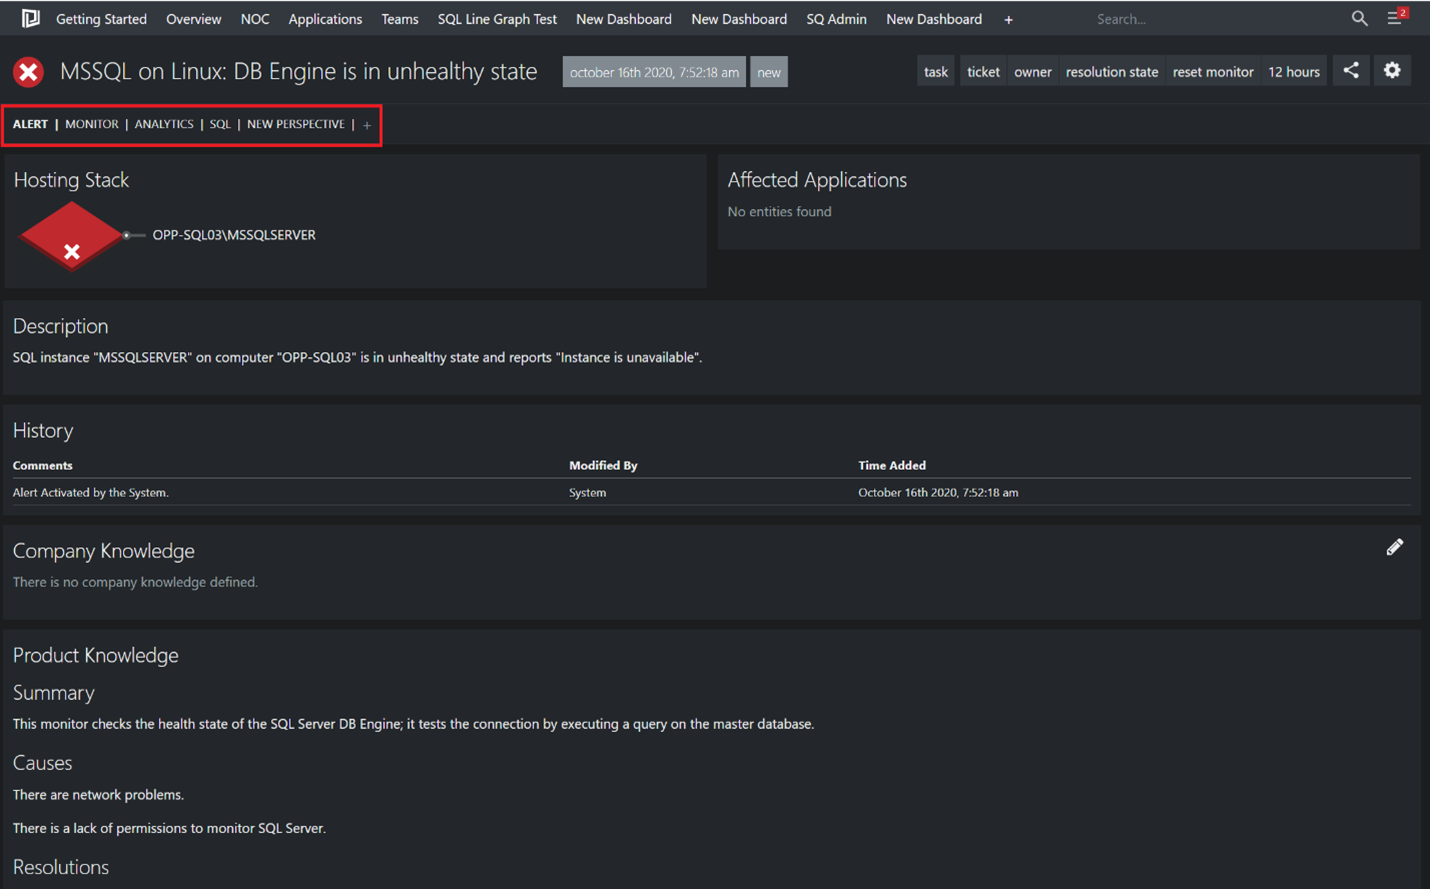
Once you click through, you can change the resolution state, reset the monitor, or run any recovery tasks, etc.
What’s more interesting here though, are the sections in the red box in the screenshot above. They are called “Perspectives”, and you can use them to collect more insight about this alert from different sources. Perspectives are scoped to the specific objects that you’ve drilled into, to only retrieve the data related to that object.
In addition to the Perspectives provided out of the box, you can also create your own custom Perspectives to bring in data from external sources like the ITSM tool you’re using, most commonly ServiceNow. Learn how to get the full picture with SquaredUp's ServiceNow tile.
Under that, you’ve got the “Hosting Stack”, which actually tells you where exactly the alert is coming from, along with all the levels this object is hosted on.
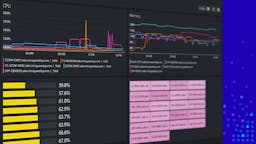
Example: root cause perspective
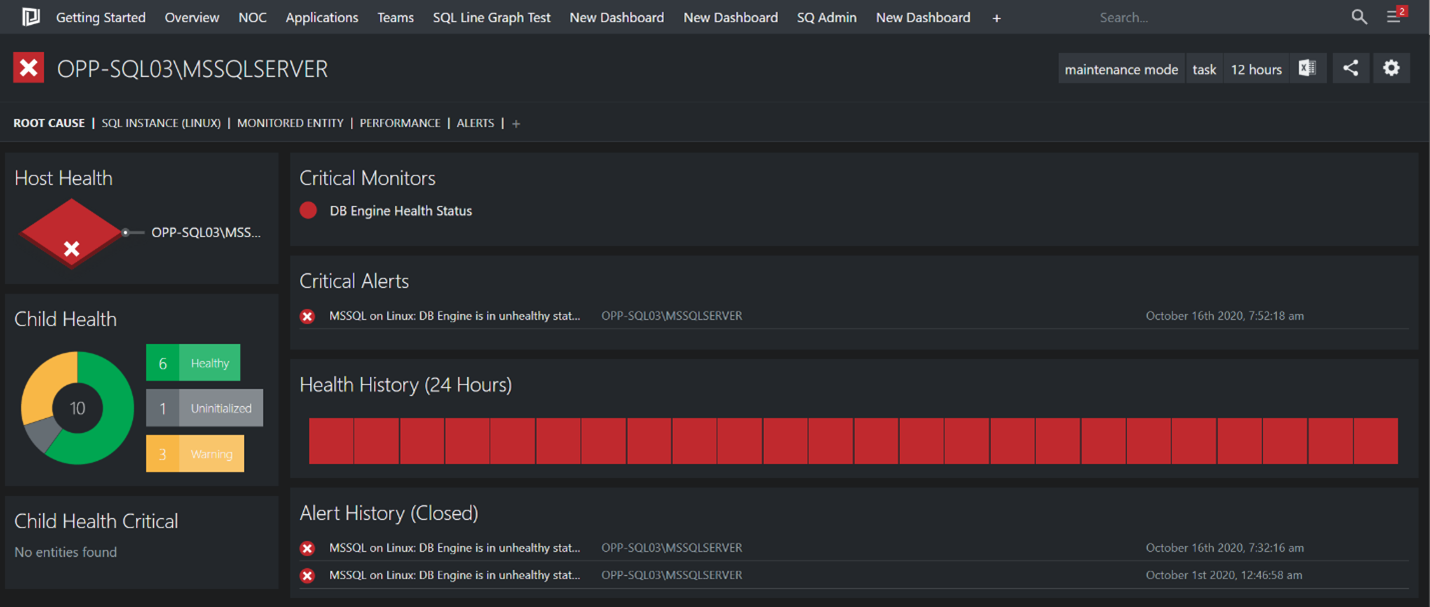
Clicking on the red object gives a different set of Perspectives. The image above is the “Root Cause” Perspective, which as the name suggest, helps you identify what the root cause of this alert could be, by trying to relate it with its child objects and other alerts on this object that may be related. Again, all of this is drill downable and you can gather all the information about this alert and the underlying sources right from SquaredUp, all in the matter of minutes.
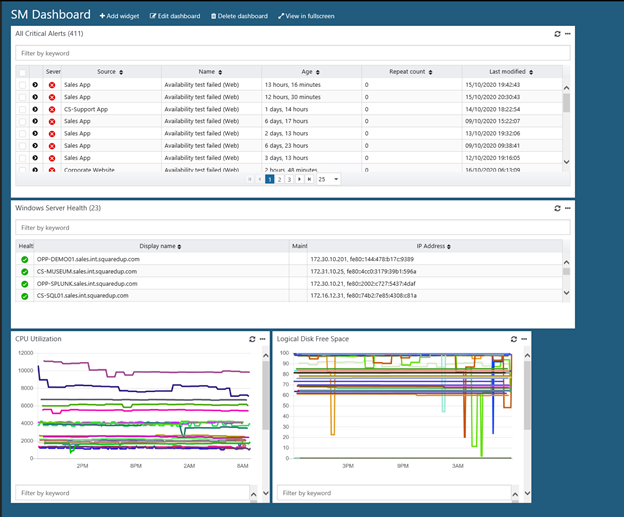
Same applies with any other SCOM objects, like a Windows server.

Awesome, your data gathering process is already done, within minutes! You’ll never have to even log in to the SCOM console, and start working towards the resolutions of the alerts right away.
The only interaction you’ll have with the SCOM console is when you’re doing some authoring like creating new monitors, rules, etc. and/or administrative tasks like deploying agents, configuring run-as accounts, etc. and trust me, it’s not a bad thing! Speaking of authoring/administration, fine-tuning SCOM can be a tedious task, and I’d highly recommend taking a look at Cookdown’s free tool, Easy Tune which will save hours and days of your time and frustration trying to fix the alert volume.
Learn how you can reduce monitoring silos across teams and elevate your SCOM monitoring. If you’d like to see how exactly SquaredUp can work for you, take out a 30-day free trial using the form below or book an introductory call with one of technical team.
Editorial Team
Related content

Release Webinars
Release webinar: Dashboard Server v6.1


Coffee Break Series