- Share application status with the Business

- Communicate with Service Status Messaging
- Monitor your Network with Link Dependency Monitoring

- Set up Availability Monitoring from the end-user’s perspective

- How to automatically map your applications and easily fix server issues

- Share dashboards with the business

How to automatically map your applications and easily fix server issues
When troubleshooting a SQL Server issue, you don’t need all of those single-use dashboards in the SCOM console. You really only need one interactive diagram to help you identify the root cause in a few clicks – and SquaredUp’s Visual Application Discovery and Analysis (VADA) tool is just that.
With this tool, you can also quickly and easily look at all of the servers that make up an application. In just a few clicks, you can map an application end-to-end, add availability monitoring, and even add dependencies to other objects!
Read on to find out how it all works as we compare SCOM and SquaredUp for these two use cases.
Troubleshooting server connections
SCOM
When working with SCOM, everything is organized into neat folders. For example, if you need to research what is happening with your SQL Server, you drill into the “Microsoft SQL Server” folder. But what do you do next? Because when that folder opened, a multitude of dashboards and folders appear, waiting for you to click. And if you have worked with SCOM before, you will know the pain of drilling into a folder, waiting for the dashboard to load, clicking, waiting, clicking, and waiting some more, just to find the dashboard that has the data you need. Now, ramp up your stress level by doing this during a production outage. Not fun, is it?
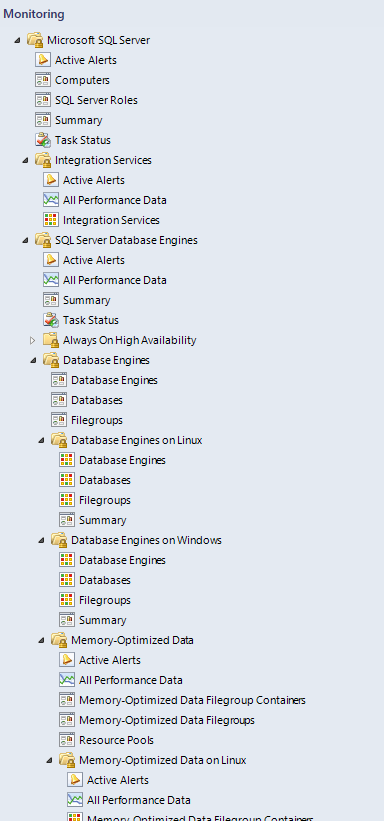
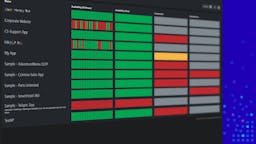
Lots of single-use dashboards!
SquaredUp
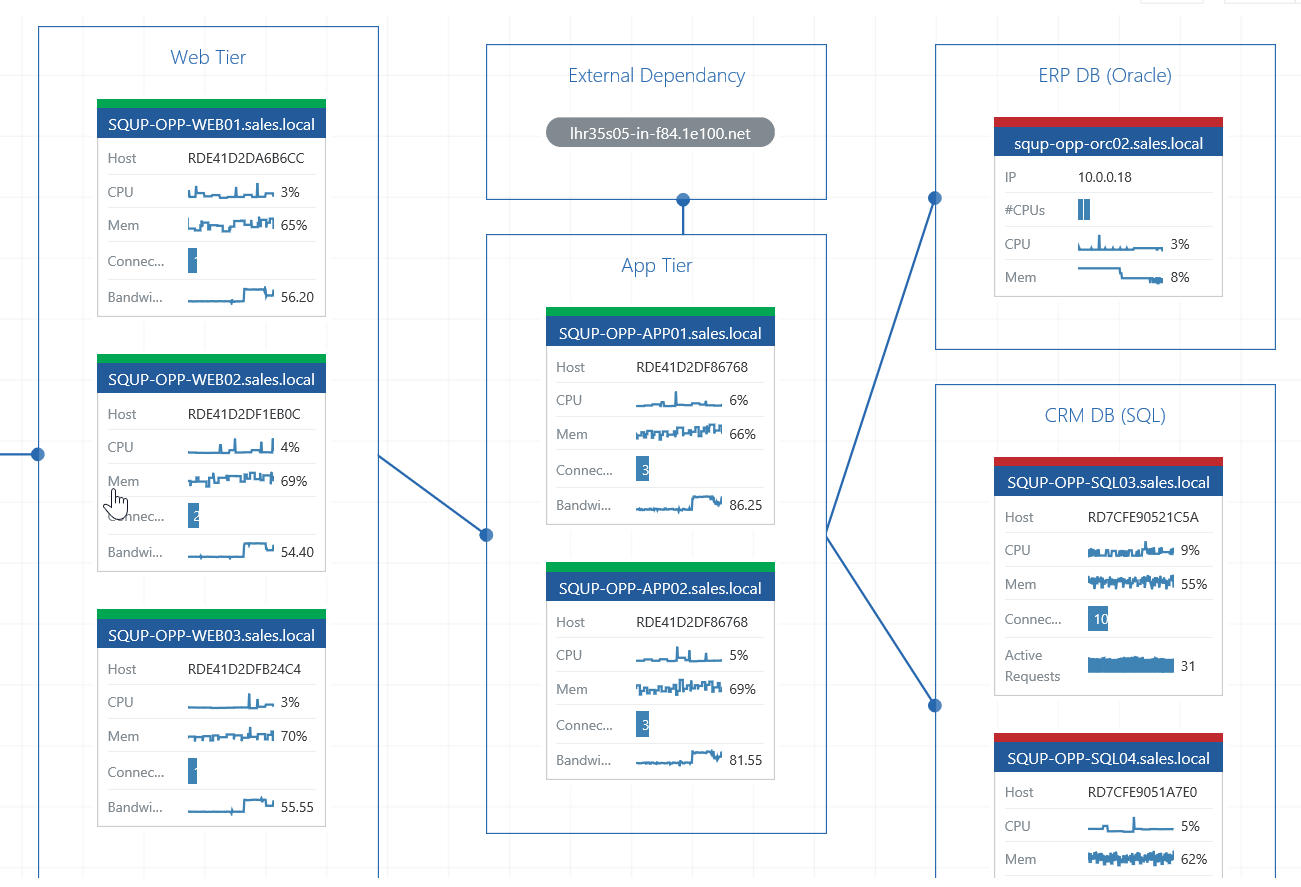
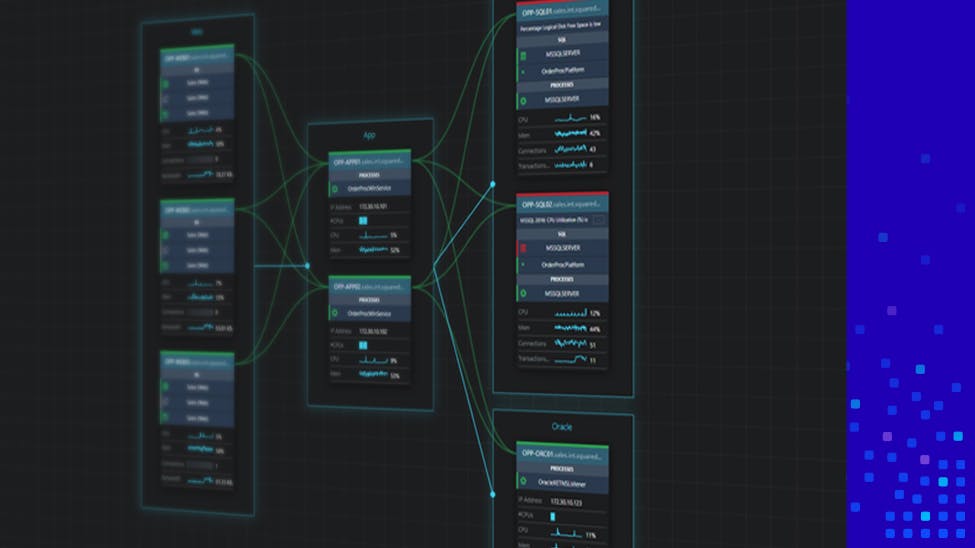
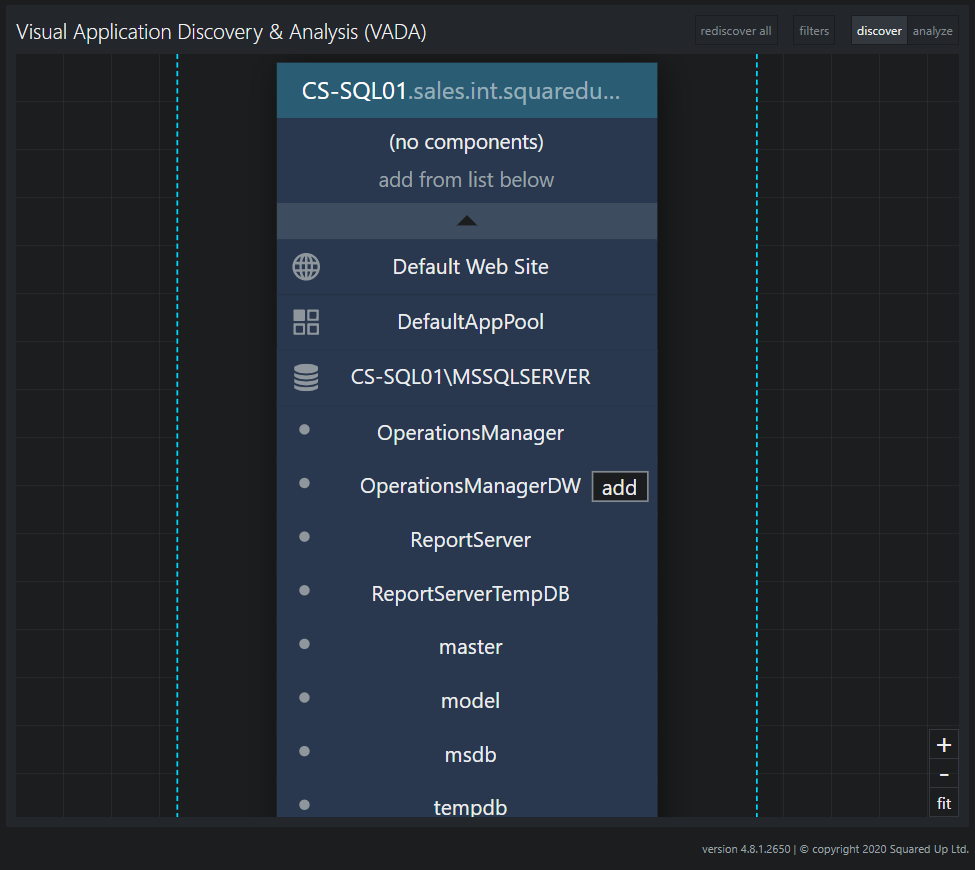
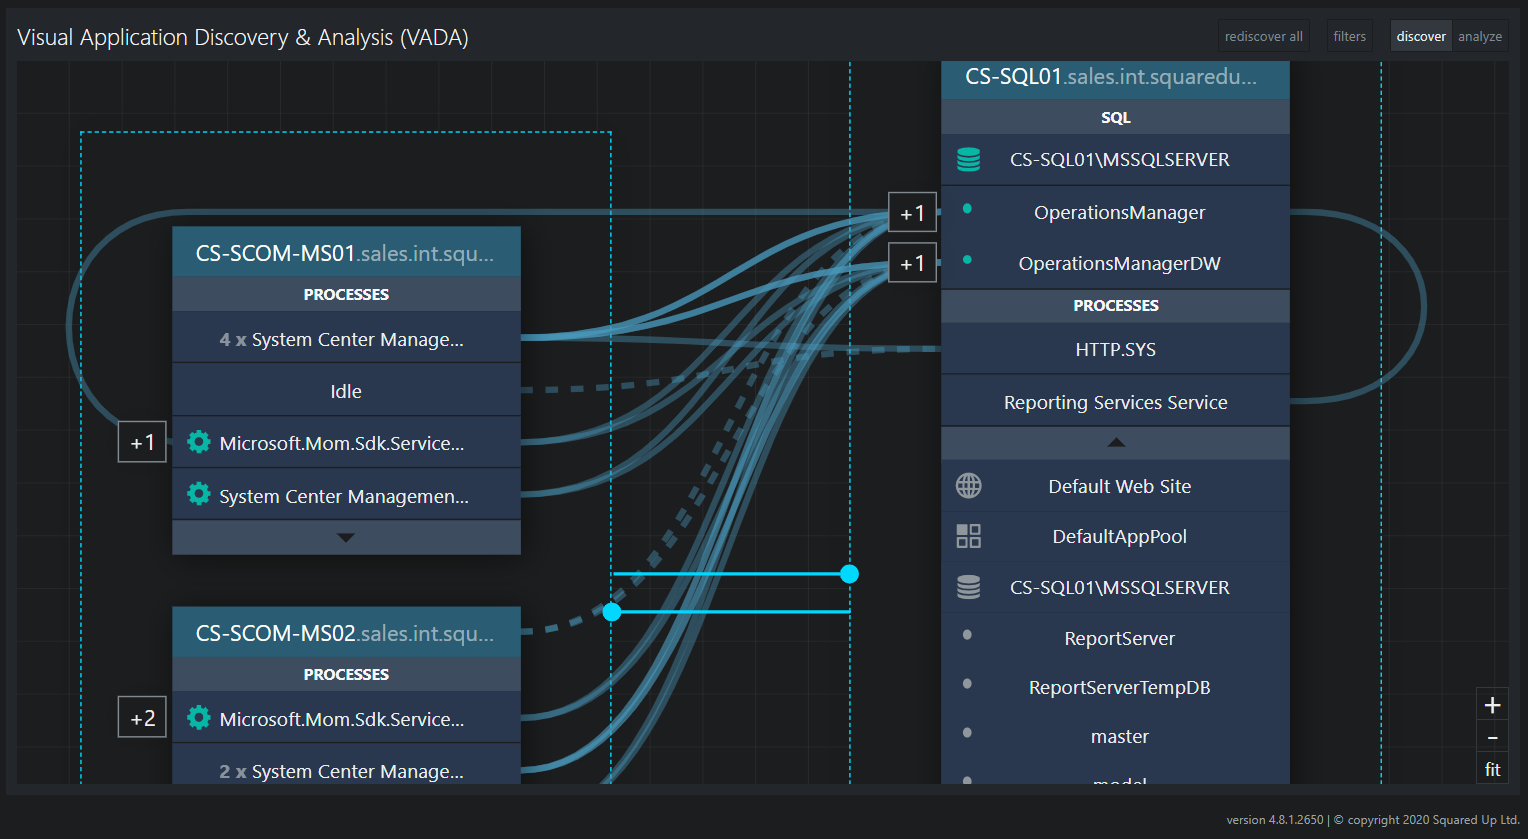
With SquaredUp’s Visual Application Discovery and Analysis (VADA) tool, a SCOM admin can quickly and easily drill into a server and the services on the server “visually.” And since SCOM is providing all of the related data, the services are clearly displayed. Take, for example, our sample Server.
VADA diagram showing how you can troubleshoot an application starting with one server.
You can immediately see that there are both a website and a SQL Server on this server. Would you like to know who is talking to a specific database? Go ahead and click on the OperationsManagerDW database and add the component.
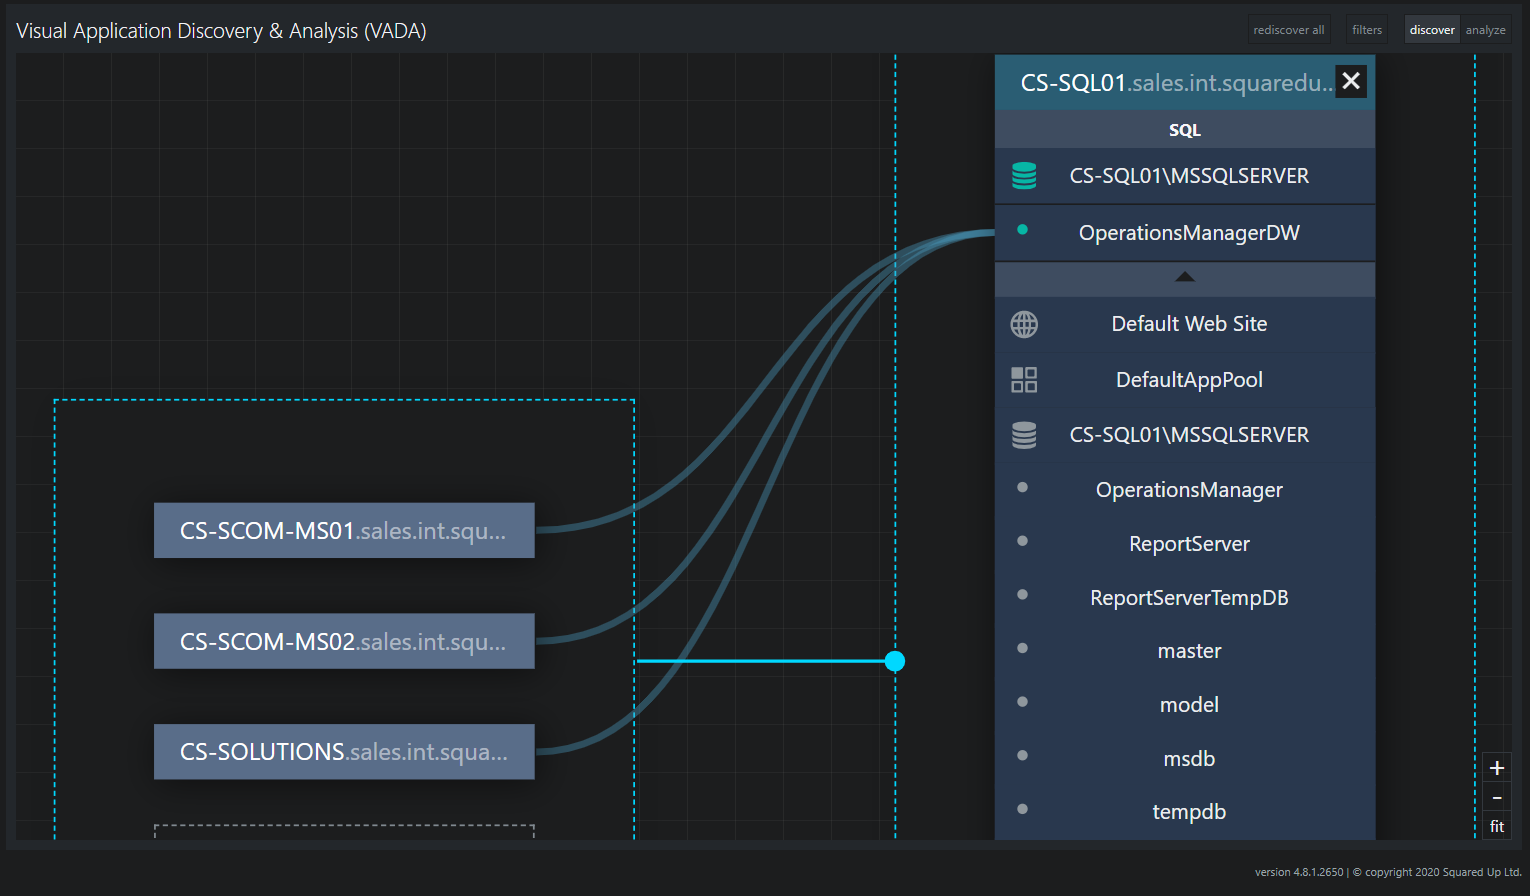
VADA diagram showing three servers talking our database.
Now you know who is or who isn’t talking to that database. Are all of these servers functioning correctly? Click on the Analyze button in the menu on the top right.
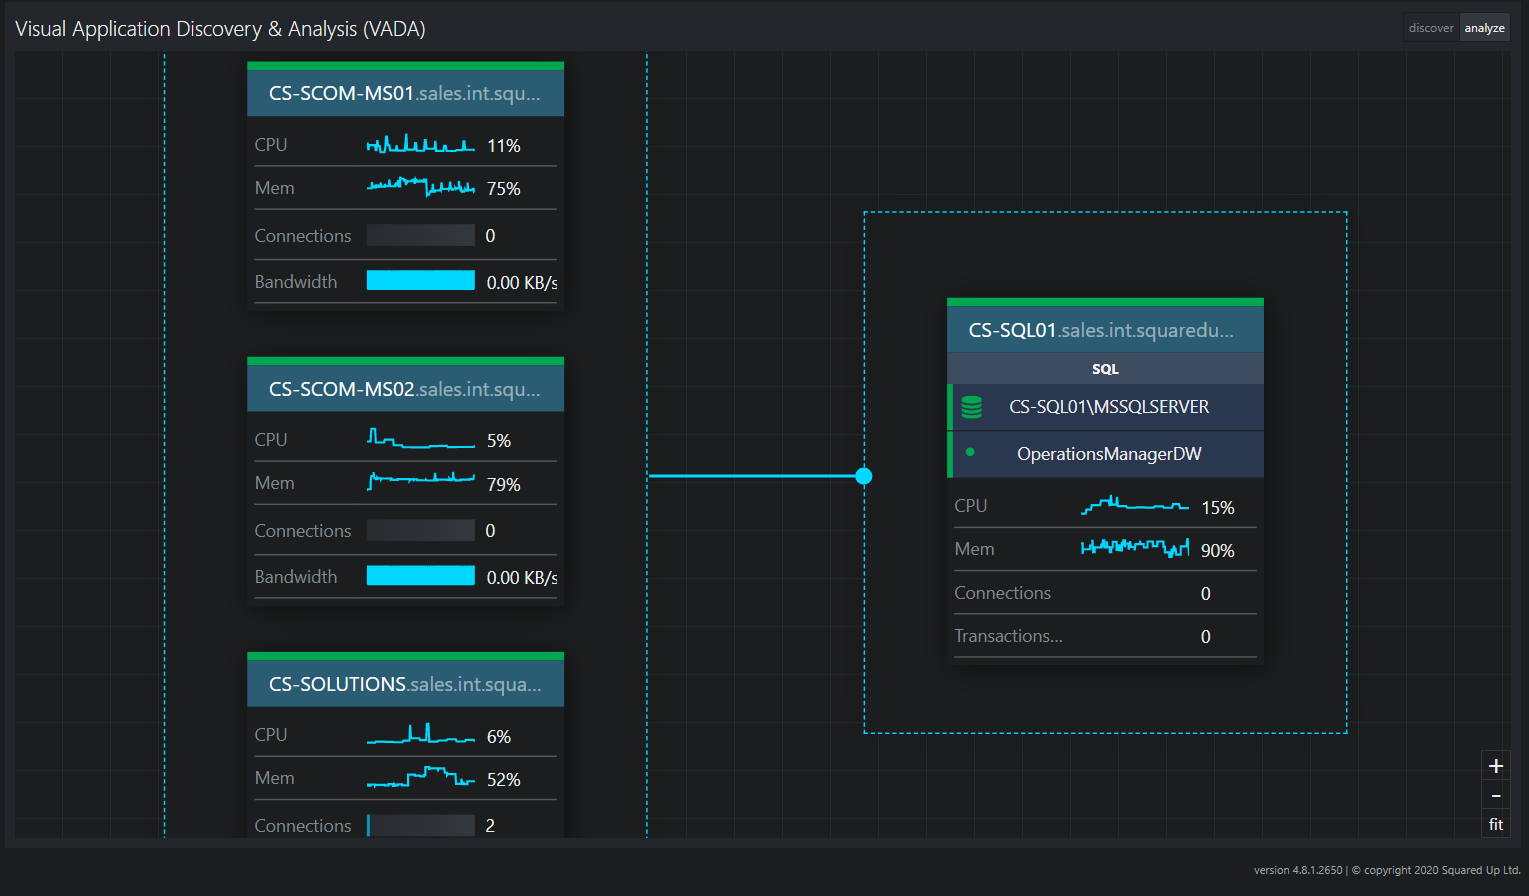
VADA diagram showing a problem server talking to our database.
It looks like one of the servers isn’t looking so good. Need more information? Go ahead, and click through a server to get to more details. You can drill down to any graph or object for more details in Analyze mode. How’s that for speedy?
How does it look when a server is having a problem? Check out these screenshots.
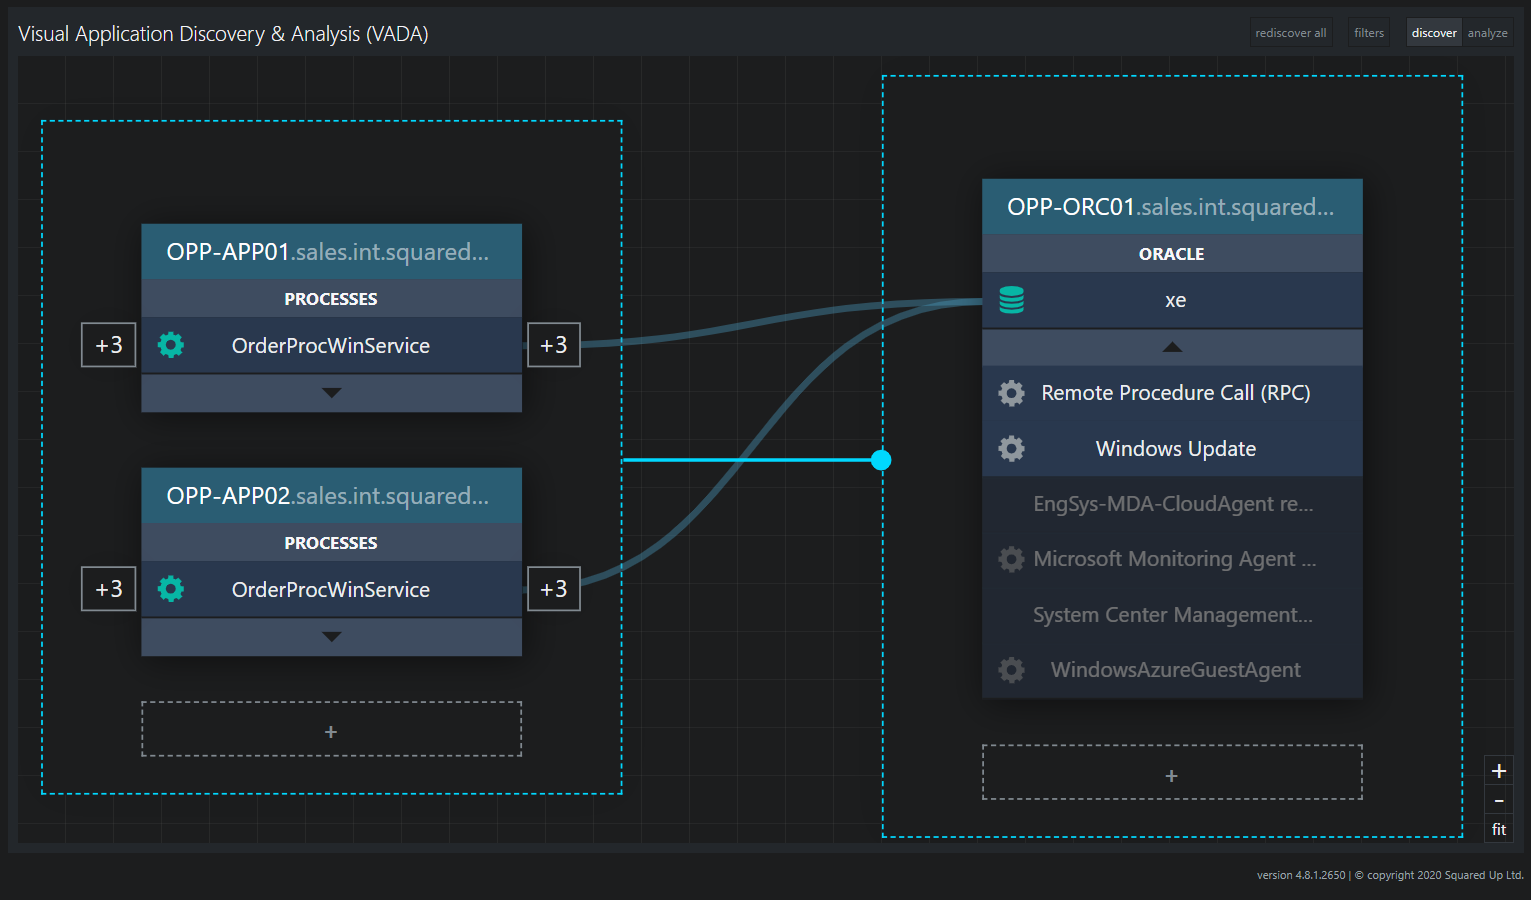
VADA diagram showing an Oracle database server talking to two application servers.
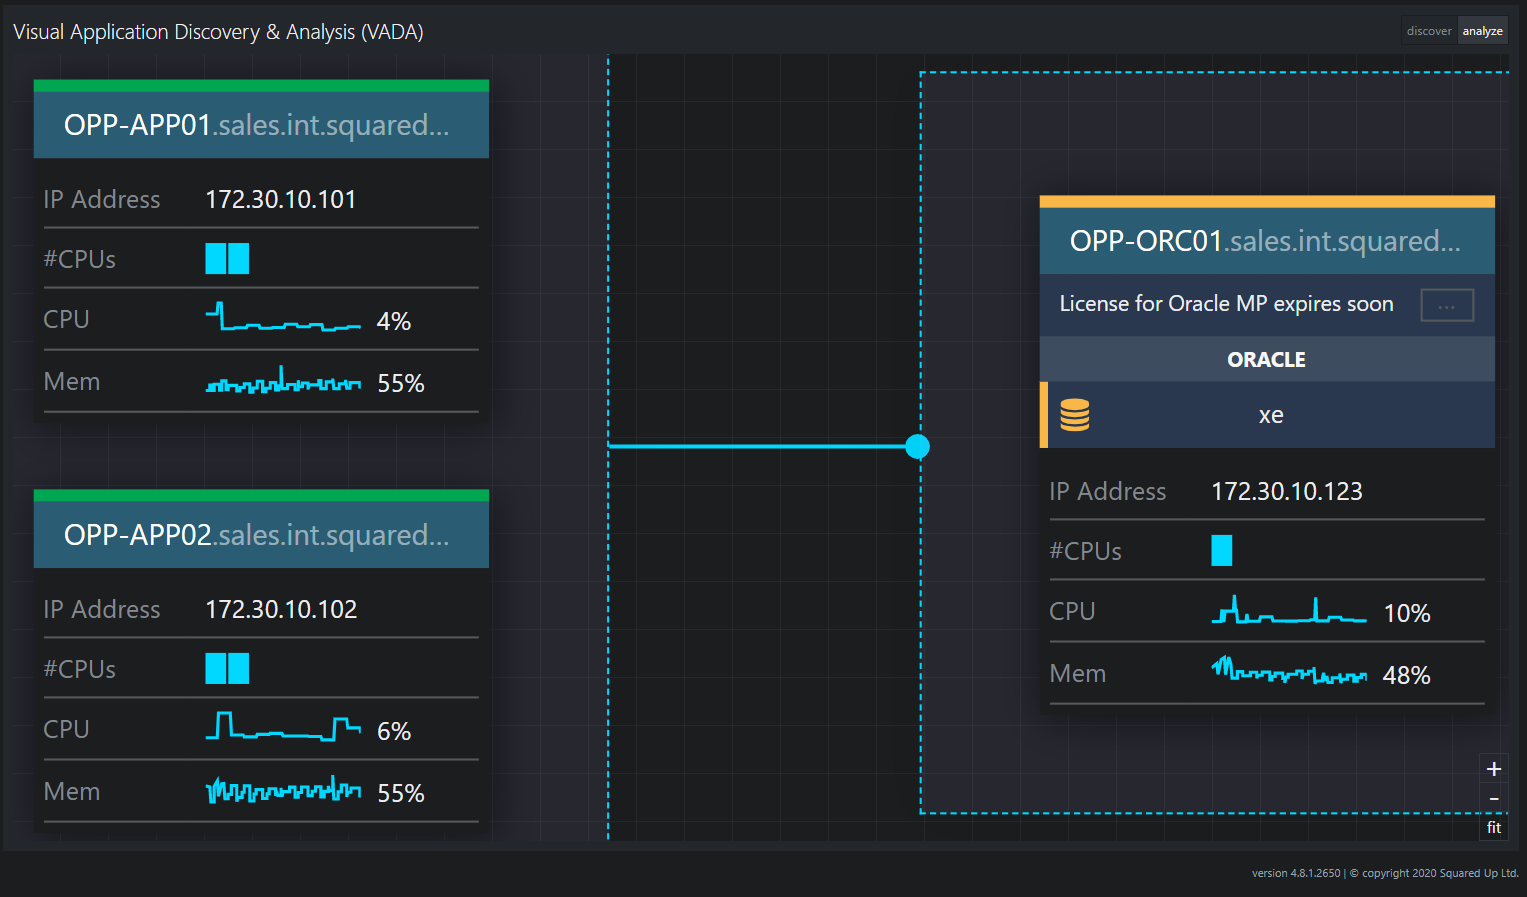
VADA diagram showing the health state of the Oracle database is in Warning status.
Automatically discover and map your applications
SCOM
While it’s handy to look at one server and the discovery relationships outwards, what if you wanted to look at all of the servers that make up an application? If you only had SCOM to work with, you would create a Distributed Application. But to do that, you would need to pre-define the component groups and assign objects to the component groups. Unfortunately, creating availability monitors isn’t part of the Distributed Application model by default. And dependencies are even more difficult to add. And if you wanted to add any TCP monitors, you would need to create them first and then add them to the diagram.
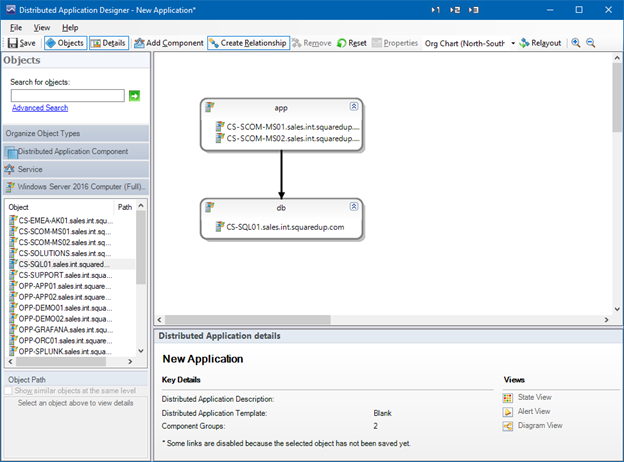
The SCOM Distributed Application Designer is notoriously difficult to create what matters most.
SquaredUp
But with SquaredUp’s Enterprise Application Designer, you can map an application end-to-end, add availability monitoring, and even add dependencies to other objects or Enterprise Applications. All with a few clicks.
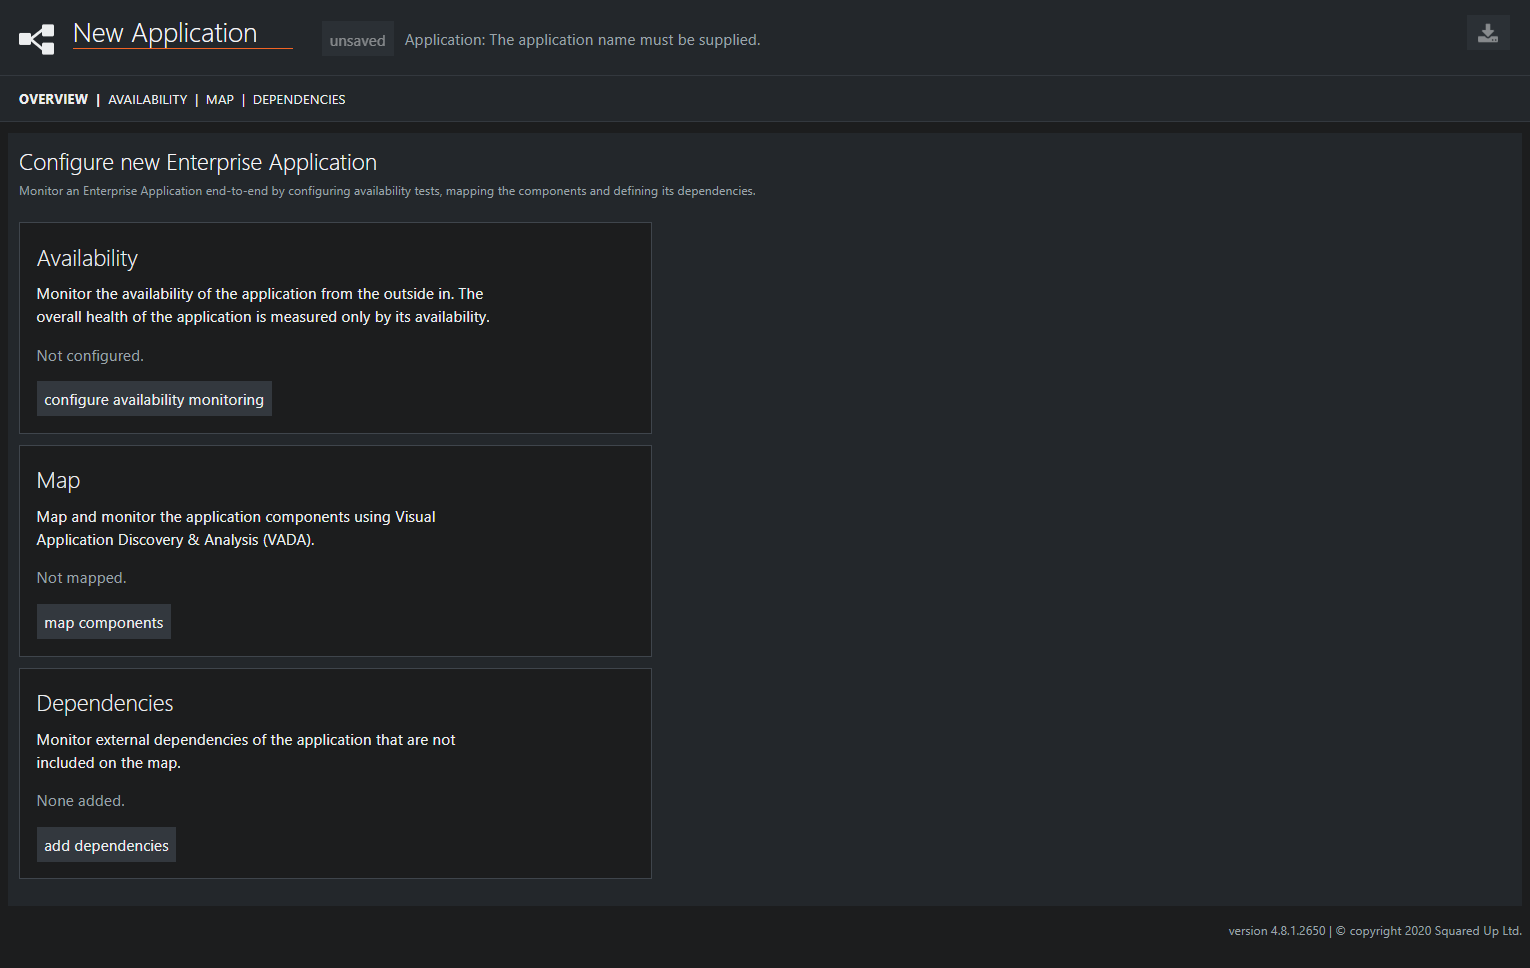
The Enterprise Application Designer helps you easily create Availability monitors, map your application, and add dependencies so that you can quickly troubleshoot your application when it matters most.
The SquaredUp Enterprise Application Designer visually helps you add services, TCP monitors, and component groups in a few simple clicks.
And for those of you using the ITIL methodology, when you create an Enterprise Application in SquaredUp, the related class hierarchy is automatically created. That means you can export the essential Configuration Items (CI) to populate your CMDB or ticketing system.
With this one tool, you can more effectively troubleshoot your server issues and automatically discover and map your applications. But this is just one feature of many! Check out all the other ways we can elevate your SCOM monitoring.
If you’d like to see how exactly SquaredUp can work for you, take out a 30-day free trial using the form below or book an introductory call with one of our technical team.