Shawn Williams
Technical Evangelist, SquaredUp
In our previous post on Grafana and SquaredUp, we compared the two tools across various benchmarks like ease of deployment, time to value, dashboard creation, dashboard sharing, and more. Both tools have their specific advantages over the other, but since the ultimate goal is to give you a single place to look – why not leverage Grafana for the visualizations and data sources it offers, and give them meaning by embedding them in SquaredUp?
In this post, we will walk you through how to embed Grafana visualizations in SquaredUp (which can also be used as a powerful Grafana alternative).
SquaredUp allows you to bring your Grafana dashboards into SquaredUp, and also populate those graphs dynamically without having to write the dashboard queries over and over again.
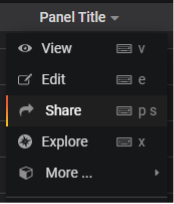
To start, you'll need a Grafana dashboard. Once you've got that ready, click into the panel menu, and then "share." Note that we’re not sharing the “dashboard,” but the panel on the dashboard, which is why we are clicking into the panel menu instead of simply hitting the share button.
The “Share Panel” will appear. Now, click on the Embed tab in the dialog.
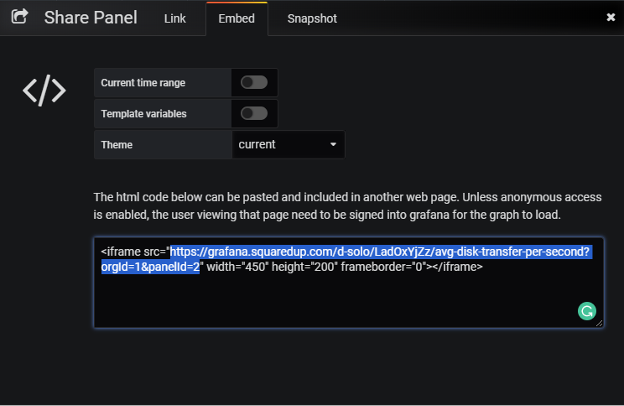
Grafana is trying to be helpful by including the iFrame code, but all we need for SquaredUp is the actual link (highlighted in the image). First, copy the link.
https://grafana.squaredup.com/d/LadOxYjZz/avg-disk-transfer-per-second?orgId=1&panelId=2&fullscreen
Then, paste the link into your favorite editor and modify it so that it looks like this:
https://grafana.squaredup.com/d/LadOxYjZz/avg-disk-transfer-per-second?orgId=1&from=now-7d&to=now&panelId=2&fullscreen
Check out this page for more information on how to modify the URL: Grafana Share Panel
https://grafana.com/docs/grafana/latest/reference/share_panel/
We’re going to switch over to SquaredUp, so set this link aside for a few minutes.
In SquaredUp, click on the Server object and then on the Disks perspective and click the design gear wheel.
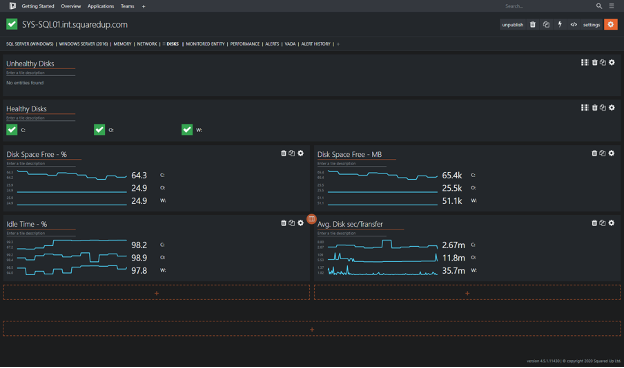
Then click the plus button to add a new widget across the bottom.
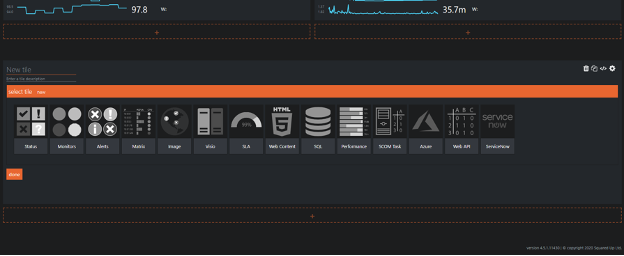
Add a new Web Content widget by clicking the following.

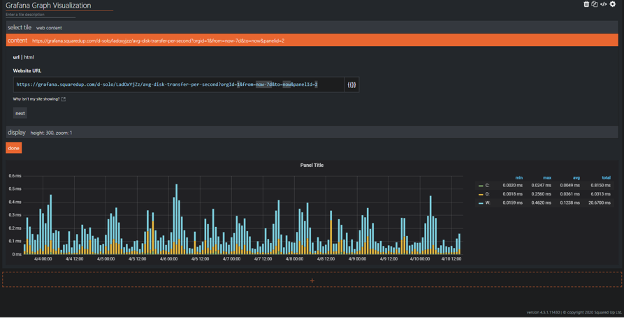
Now click on URL, then paste the link we created earlier into the text box.
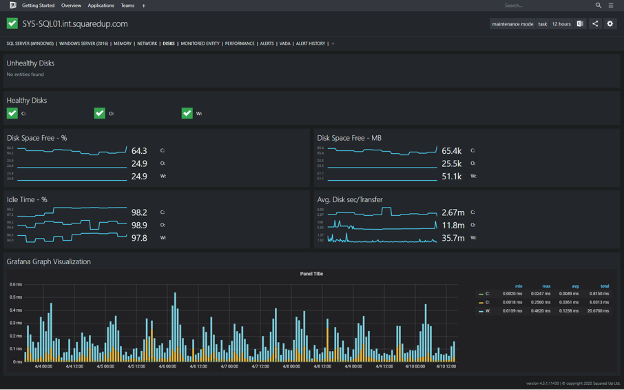
Finally, click on the Publish button to finalize our dashboard!

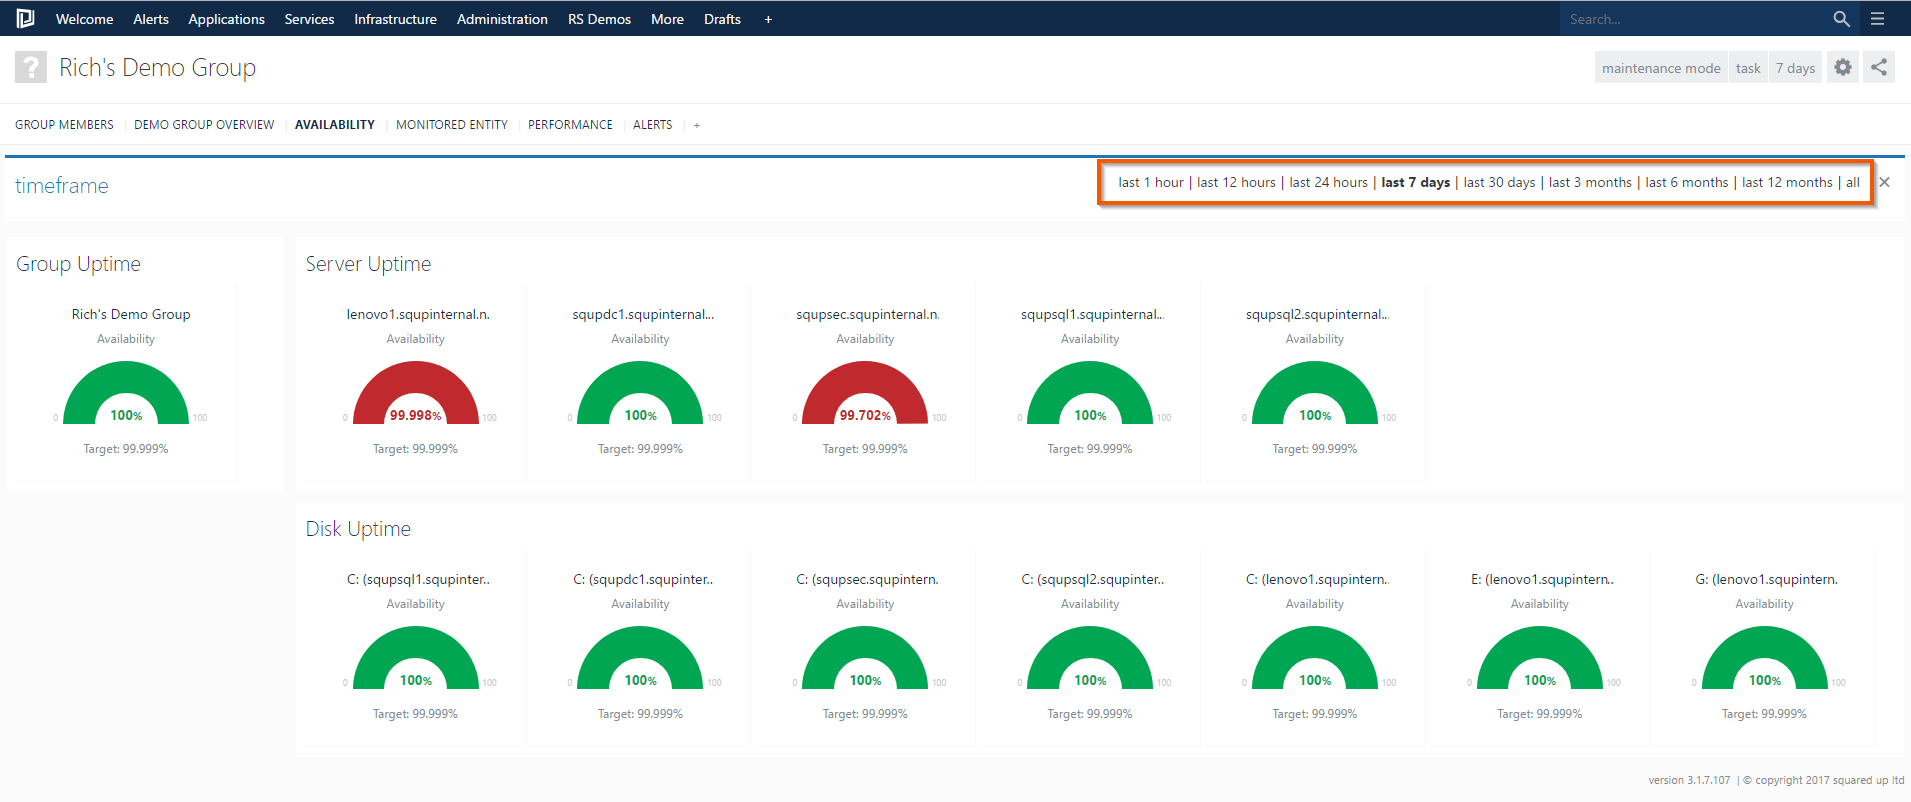
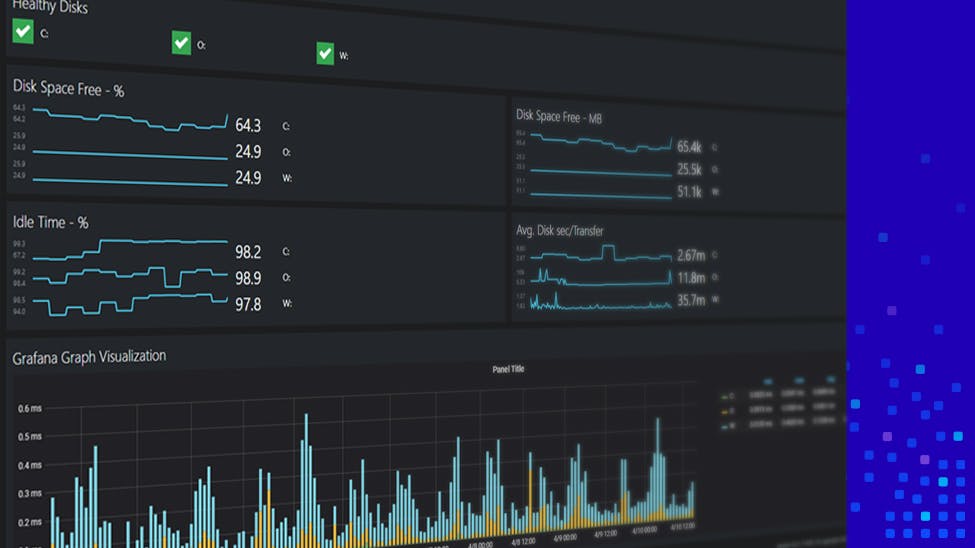
Here’s our finished dashboard with an embedded Grafana visualization:
Caution: If you don’t want your users to receive a prompt to log into Grafana, you will need to set up a reverse proxy for Grafana and SquaredUp. Check out this link for some guidance.
And that's a wrap! Now we have a dashboard that combines Grafana and SquaredUp by embedding Grafana visualizations into SquaredUp dashboards – and you can get all that data in one place.
And if you want to simplify life and choose just one tool, find out whether SquaredUp Community Edition could be the Grafana alternative you've been looking for.
Till next time!
- Shawn