New Microsoft M365 Management Pack for SCOM
Microsoft have announced a new management pack for Office 365 – M365!
It completely replaces the Office 365 management pack and is packed with new capabilities.
Aakash Basavaraj, Program Manager at Microsoft, and Sameer Mhaisekar, Technical Evangelist at SquaredUp, joined Bruce Cullen, Director of Products at Cookdown, to reveal the new capabilities of the M365 management pack and the accompanying dashboard pack created for SquaredUp.
Watch the full demo with Q&A on replay below or read on for some of the highlights:
Why monitor M365? It’s SaaS
Because Microsoft 365 is a SaaS product, there will already be health status dashboards squirreled away somewhere that will tell you whether the service is up or down.
But, your end users working with the Microsoft suite are not at Microsoft so, while the service itself might be up, there may be issues between the users and the services that prevent them from accessing Microsoft services. You want to know when those issues arise. That’s where the ability to monitor Microsoft 365 comes in.
Why an M365 Management Pack?
It’s worth noting that there’s already a management pack – O365 – that was released a couple of years ago to get all the Message Center notifications that are raised in the O365 tenant and relays them as alerts in the SCOM Ops Console. But there has been feedback on the need to monitor 365 workloads like Exchange, SharePoint/OneDrive, and Teams. Customers need a way to monitor how these workloads are performing.
In addition, Message Center would sometimes create humongous and sometimes false alerts in SCOM – there’s a lot of noise for SCOM Admins. The alerts are hard to understand or uncover why these alerts are popping up, so they’re not actionable.
Finally, with O365, there is also no way for a SCOM Admin to understand the network performance with 365. Is there any latency? Is the route taken to the 365 data center the optimal one?
There have been a lot of management packs created to solve this problem, but Microsoft wanted to create a management pack for a workload that is owned by Microsoft that answers these needs and the many more requested by customers.
The new M365 management pack is their answer.
Key features of the M365 management pack
The new M365 management pack is full of great new features to give you a full view of your Microsoft 365 tenant and optimize the experience for your end users.
New features include:
- Secure setup – credentials: client-secret or certificates
- Seamless Watcher node setup – make use of a SCOM agent and make transactions from the agents, like sending an email or message.
- Synthetic transactions
- Exchange emails, logon latency
- SharePoint file upload/download speeds, logon latency
- Teams chat - reorder of packet ratio, packet loss, jitter etc., create channels
- H5 dashboards with location tagging of watcher nodes
- Graph API for all transactions and operations performed in the management pack
- Monitor the health and performance of a hybrid environment, particularly for an Exchange site – for example, you can see how long it takes an email sent from on premises to reach a mailbox of an online user
- Network and license monitoring
The new M365 management pack can be used with SCOM 2016 and SCOM 2019 (but bug fixes going forward will only be for SCOM 2019).
Here are the Graph API permissions that will be required to set up the management pack:
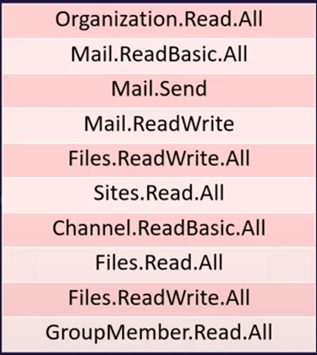
Note: remove your old management pack to set up the new one – the upgrade scenarios will not work because the management pack is rebranded from Office 365 to M365.
The M365 preview demo
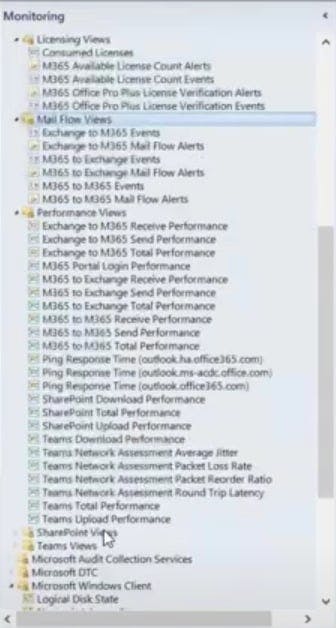
When you import the management pack you will see the Microsoft 365 tab added on the left of your Console with the same look and feel as before. But there is a new UI option for the Watcher node in M365.
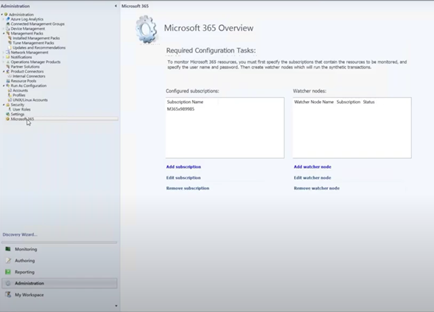
First, you need to configure your subscription. Click Add subscription and you’ll see the below wizard. Add the subscription name.
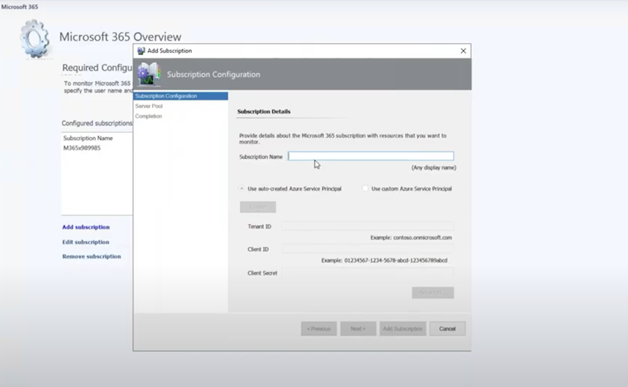
You’ll then be asked for the credentials for the M365 admin. The credentials are created or keyed in when the SCOM admin is setting up. It’s a one-time activity after which the SPN and the permissions are automatically created.
This is a great setup experience for the new management pack.
Add Watcher node
This new UI element in M365 gives you the flexibility to add a Watcher node on an existing SCOM agent.
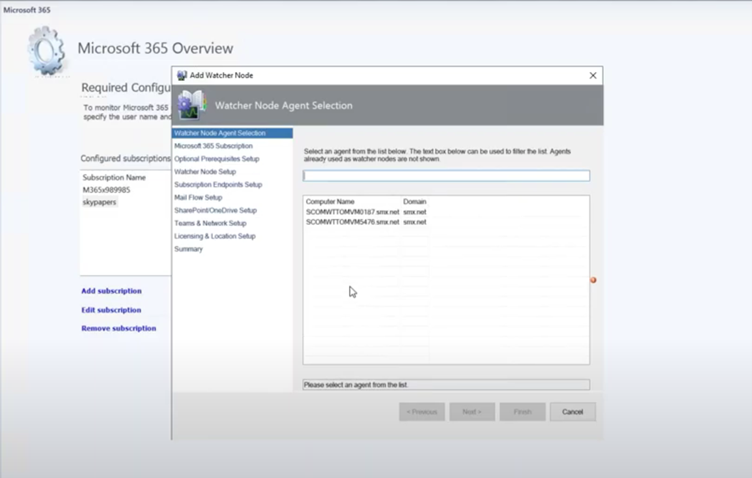
Select your agent, click next, and choose your subscription to monitor. Then it’ll ask you for the prerequisites. This is all part of this same wizard.
Then choose which account you want to use to install the prerequisites on the new agent.
Next, enter the endpoint URLs that you want to connect to on the M365 site. This is exposed so you can change the endpoint to what you need – a great new option.
Then go ahead and check or uncheck the transactions for watcher nodes for Mail Flow, SharePoint/OneDrive, Teams and Network, and Licensing & Location setups.
You can even specify the exact location of a watcher node to the precise longitude and latitude. This will let you monitor the health and performance of each node on a dashboard. We’ll get to that soon.
SCOM M365 dashboards
Once you are all set up, you can see all your dashboards options on the left of the Console.
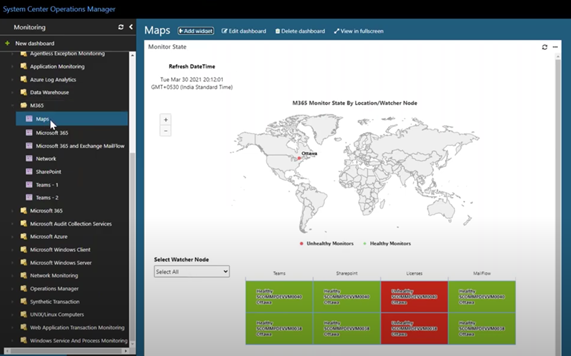
Click into an option to see your H5 dashboard. Here’s a demonstration of how specifying the location of your watcher nodes can be helpful for dashboarding the health of each one so you can identify issues in an instant.
You also get an alerts dashboard for each transaction with a bar graph showing how many alerts. Then underneath, you can see the details of the alerts.
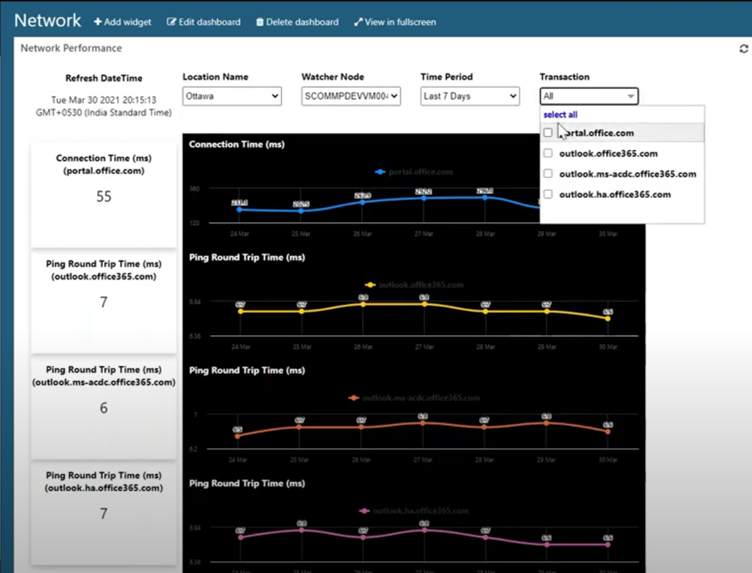
Plus, there’s the Network dashboard for monitoring connection time and ping round trip time, which can also be filtered by transaction, location, node, and time period.
You’ll also find a similar dashboard for SharePoint latency and upload/download times.
You can find Microsoft's announcement of the M365 management pack release here.
SquaredUp’s Dashboard Pack for M365
Following the M365 management pack release from Microsoft, SquaredUp released a dedicated dashboard pack.
SquaredUp for SCOM is beautiful, powerful dashboards that give you everything you need to diagnose performance issues and drill down to find the root causes.
SquaredUp’s dashboard packs are sets of pre-built dashboards that you can install with a single click. And they’re fully customizable.
Sameer demoed a preview of the upcoming M365 dashboard pack in the Coffee Break webinar. Here are a few highlights.
There are two dashboards in the pack – status and performance.
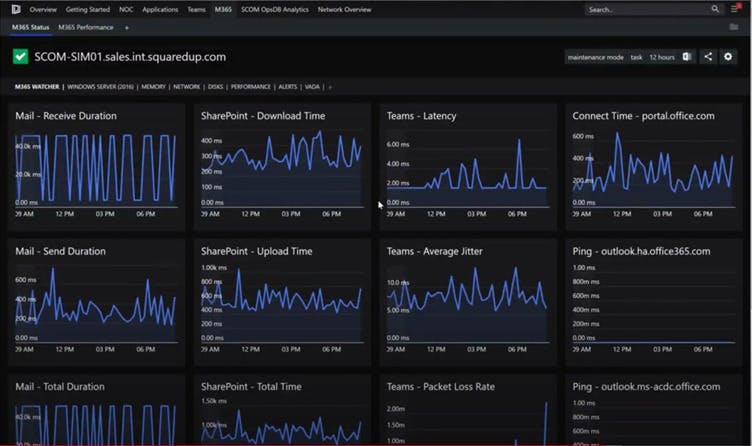
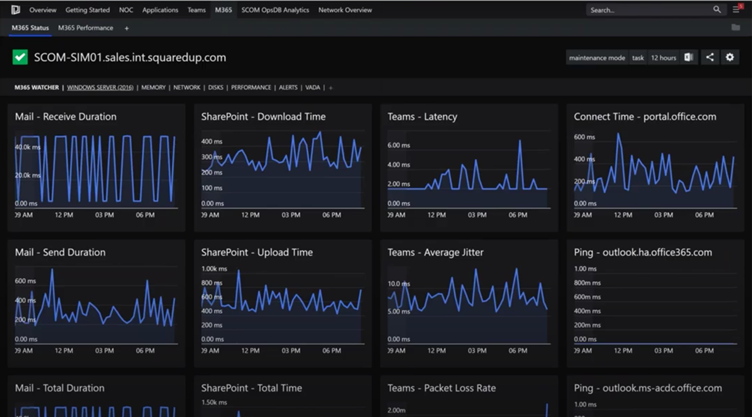
M365 Status dashboard
The status dashboard helps you spot issues that need immediate action, like the health of the watcher listed in the lower tile in the right-hand column below.
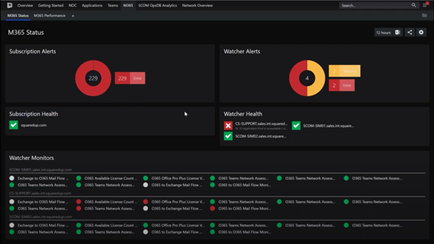
When you drill down on a watcher, you will get a perspective with all the metrics pulled from the management pack – all scoped to the specific watcher.
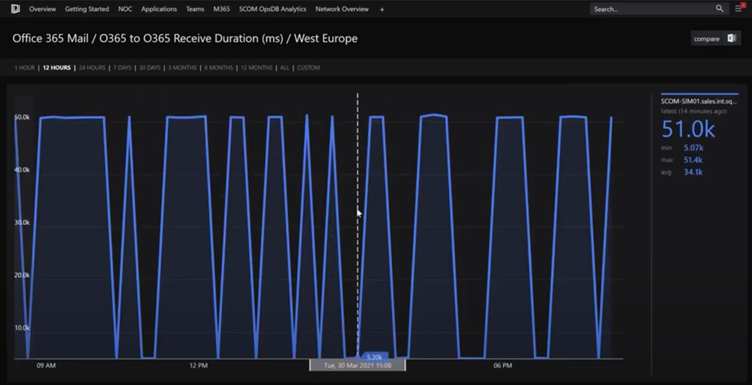
In turn, each of these charts can be clicked on to drill down into more detail where you can zoom in to specific dates and times. This gives you powerful monitoring capabilities for Microsoft 365.
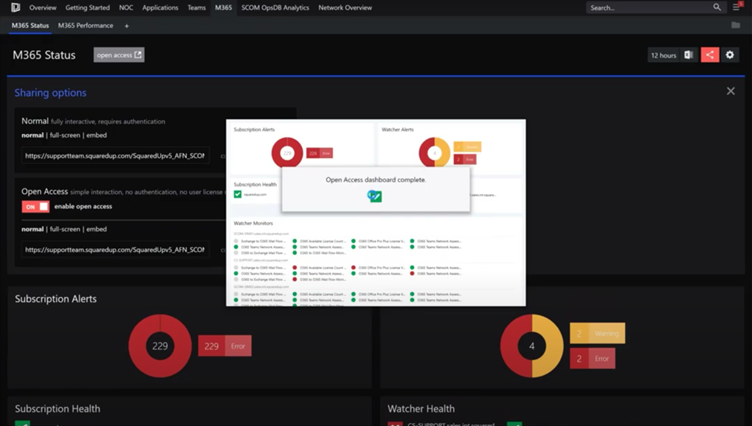
You can also share your dashboards freely with anyone, even if they don’t have access to SquaredUp, with an Open Access link.
M365 Performance dashboard
The second dashboard in the SquaredUp dashboard pack is the M365 Performance dashboard that gives an overview of the watchers. These are categorized by the services being monitored.
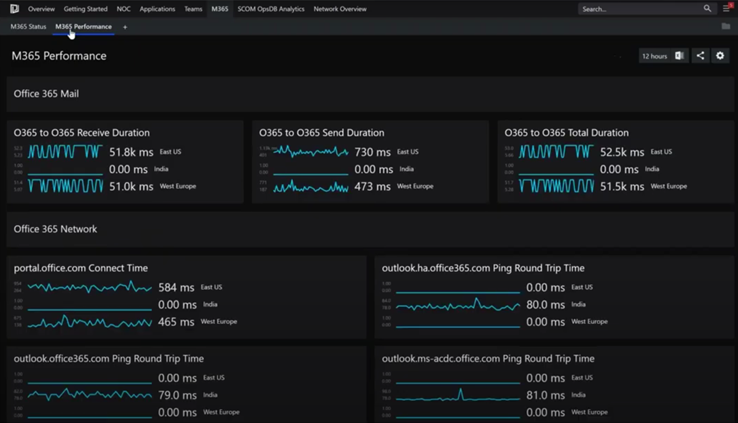
Again, you can drill down into any of the charts for a detailed look at the metrics and zoom into the dates and times of events.
By using perspectives, you can visualize the health of each of your objects from multiple sources. For example, you can see all the metrics for the M365 watcher personality on the below dashboard.
Similarly, you can view the metrics for your Windows Server personality on a single dashboard. This can be created for any personality, like a SQL server.
This lets you correlate data from multiple sources to help you in troubleshooting. It’s a powerful dashboard pack for what looks set to be a powerful new management pack from Microsoft.
Want to dashboard your M365 tenant? Read how to do it with SquaredUp Dashboard Server:
How to build insightful M365 Analytics Dashboards with SquaredUp and Microsoft Graph API