Vincent Babin
Senior Product Manager, SquaredUp
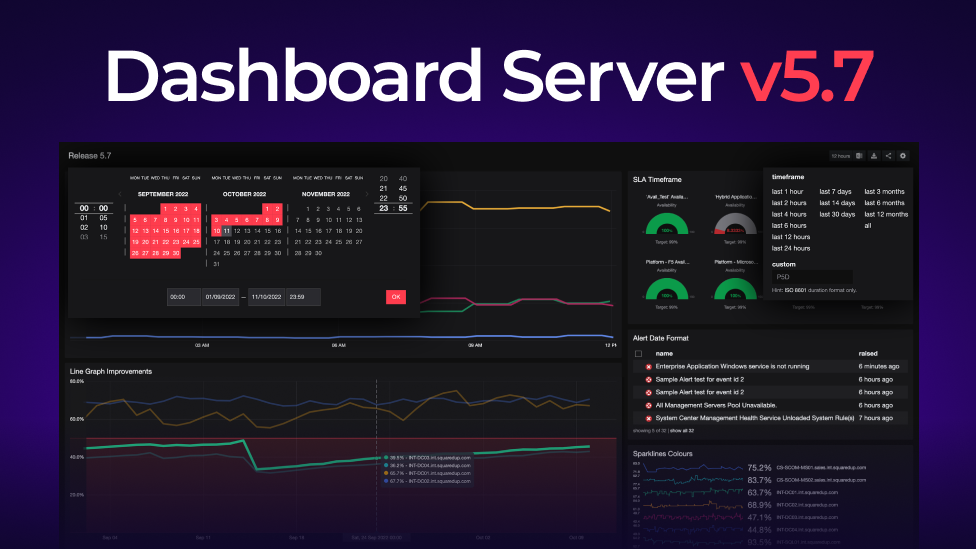
We’ve just released SquaredUp 5.5!
As always, you’ll find some great new additional features as well as enhancements in the SquaredUp Community, Azure, and SCOM Editions. Plus, the new 5.5 release works with SCOM 2022.
Here’s a quick overview of what’s new:
Check out the release webinar here or keep reading for all the juicy details.
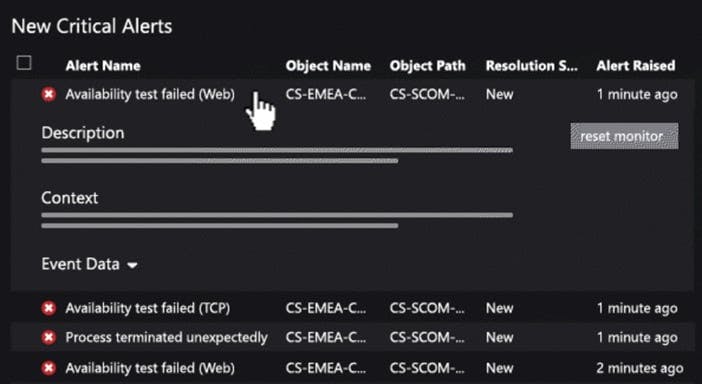
The first additional features we have added to the SCOM alert tile should save you a lot of time drilling into each alert and opening them in new tabs when you’re trying to take an action from an alert.
We’ve added a new feature to alert tiles that lets you expand the alert for more information. You can see a description and some context for the alert. This means you can stay on one screen to explore the alerts so you can make decisions and take actions without having to drill into each one.
You can also select all alerts to batch change the resolution state or assign one or more alerts to other colleagues.
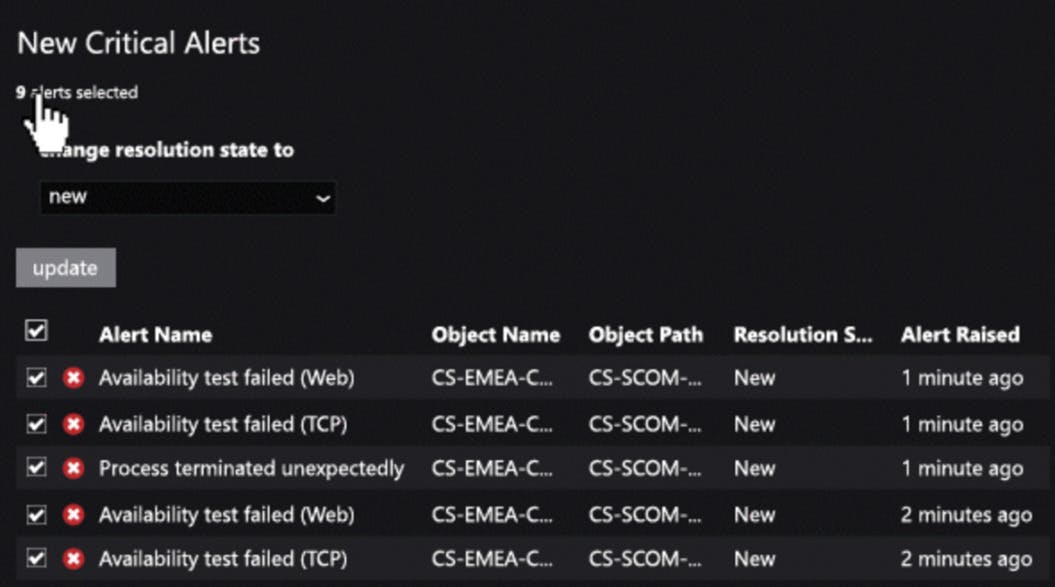
Plus, there is now a button on a monitor, in the alert description, that lets you reset the monitor.
Theses additional features mean you can take all the most popular actions on one screen so you don’t need to drill down further. This will be particularly helpful in a an alert storm when you need to jump on the action fast.
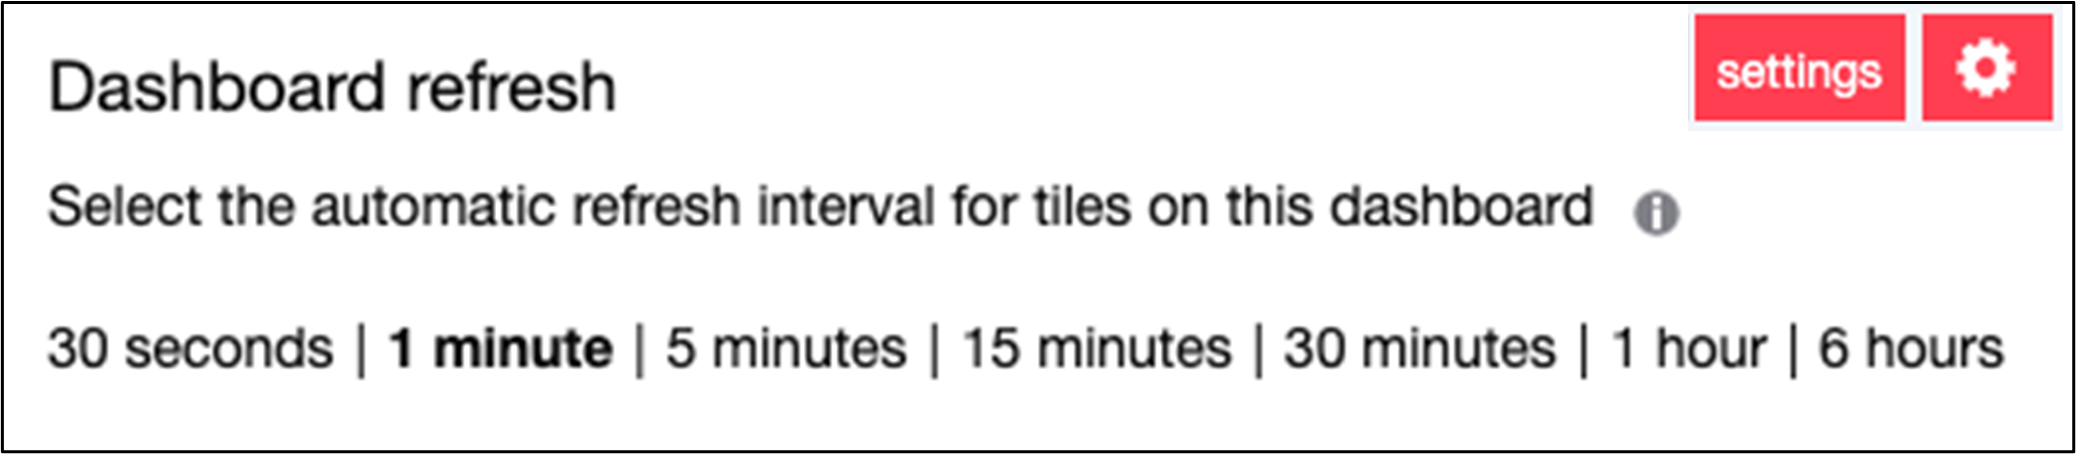
If you are using an API or PowerShell script that takes time to execute and you don't need the data to refresh often, or perhaps the API end-point has a cost associated when you hit it, we have just the thing for you.
In SquaredUp 5.5, you can configure the refresh intervals per dashboard. Dashboards are automatically set at a 1-minute refresh interval but you can adjust this in various increments up to six hours, or down to 30 seconds.
Perhaps the most exciting new feature is the ability to change a visualization into another type in just a couple of clicks.
Prior to 5.5, you would have to duplicate and reconfigure the tile from scratch if you wanted to change the visualization type – change the scope, metric, timeframe etc. Now, just click the other type of visualization you want and that's it, all that's left is to configure the display options of the new visualization.
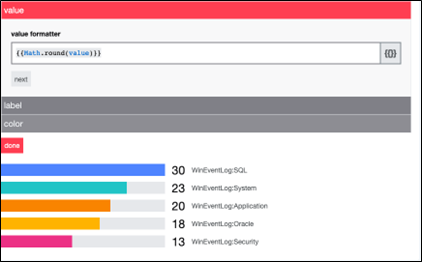
If you have whole numbers, you don’t need the decimals showing. Or if you are trying to represent currencies, you need two decimal places. The value formatter lets you select the number of decimal places you want displayed in a bar graph.
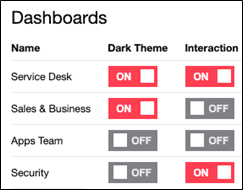
Another popular request was the ability to change the theme settings for Open Access dashboards.
We have now added that capability in SquaredUp 5.5. You can switch on or off dark theme for each dashboard in one place in the configuration panel. This helps when you are displaying an Open Access dashboard on a wall screen in a room where the lighting conditions means light or dark would work better for optimal visibility.
We’ve covered the highlights of the 5.5 release but there are even more features we have added. Take a look at the release notes (SCOM Edition, Azure Edition, Community Edition) to find out more about:
Upgrade to SquaredUp 5.5 by downloading the edition you need from download.squaredup.com
And don’t forget about the community dashboards. You can find dashboards that others have already built and get the code from GitHub. You can also contribute your own dashboards and get a chance to win LEGO prizes.
Happy Dashboarding!