Vincent Babin
Senior Product Manager, SquaredUp
How they help you get actionable insights in SCOM
SquaredUp for SCOM sits on top of your existing SCOM and makes managing it a whole lot easier. In SquaredUp, SCOM data is displayed in beautiful and easily readable dashboards, which are also interactive. The coolest part is that the dashboards can be drilled into, down to the unit level, providing you clear actionable insights. As we will show in this blog with just a few clicks, you can identify the exact source of an alert, isolate the problem and take the appropriate action quickly.
Let us walk you through the three key features that make it possible to get to the root cause within a minute.
We have recently re-invented our pre-built dashboards to include the latest best practice recommendations from the SquaredUp Customer Success team. Updates include the following:
The three updates above are a great way to monitor, react and investigate issues with our infrastructure quickly and can help reduce your Mean Time to Repair (MTTR).
Let’s look at a real-life example within our own SquaredUp environment, where we locate the root cause within 1 minute using these three features.
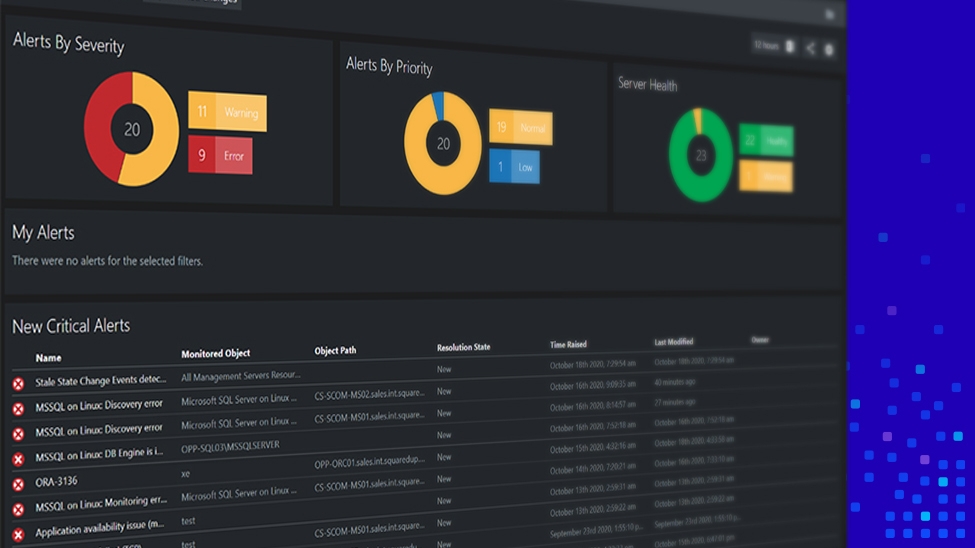
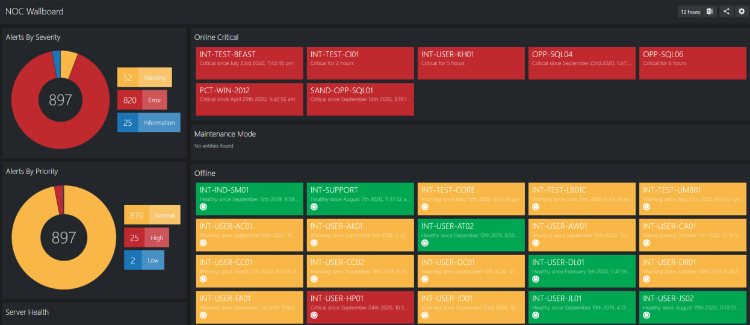
The NOC Wallboard below is displayed on a large TV screen in our IT department and gives our IT Operations team a clear view of the overall status of our infrastructure (the section on the left showing alerts and server health) as well as on-going exceptions that require their attention (the section on the right showing red status boxes).
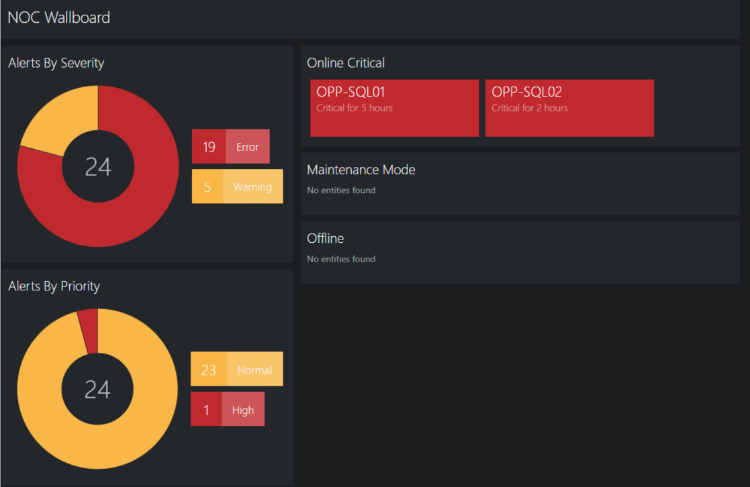
As we can see from the above NOC Wallboard, one of our SQL servers has turned red and is reporting as online but in a critical state for the last 5 hours! This requires urgent action before the problem takes a turn for the worse. Our operator will proceed to start the investigation using the new NOC Operator dashboard.
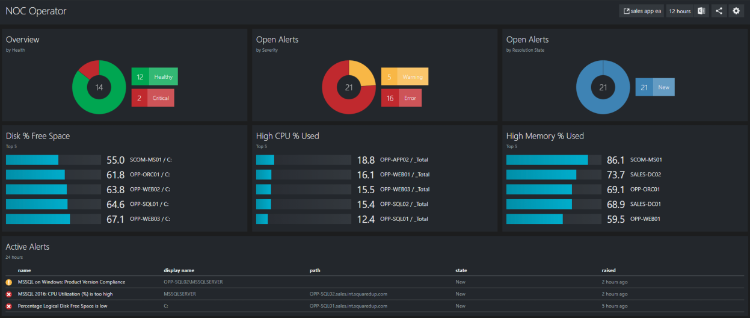
The NOC Operator dashboard is a popular dashboard used by our operators to check that everything is OK in the morning when enjoying their first cup of coffee or when a problem is reported during the day. The NOC Operator dashboard presents our operator with the health overview, a list of active alerts, the status of our Enterprise apps and information from our ServiceNow native tiles that may give more insight into a problem from a user’s point of view.
The new Root Cause perspective brings together all the relevant critical data about the health of an object in one place, and is filtered to only show critical alerts (note: this can be changed on the perspective settings to also show warnings). This perspective is a great way to surface more actionable insights such as critical monitors, critical child health and historical alerts to further assist with the investigation and root cause analysis and to help our operator take the right action quickly to resolve the problem.
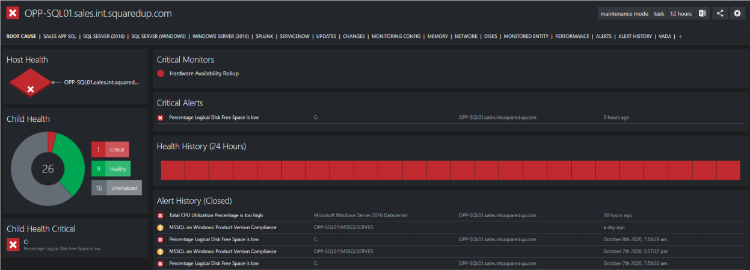
In this example, our operator is able to see at a glance that the space on the C: drive is critically low on our SQL server (as reported by the Child Health Critical tile). This is an easy problem to solve, however it would not have escaped our operator that, according to the historical tiles on this perspective, the C: drive has reported the same critical error 3 times in the last 3 days. This is going to require further investigation.
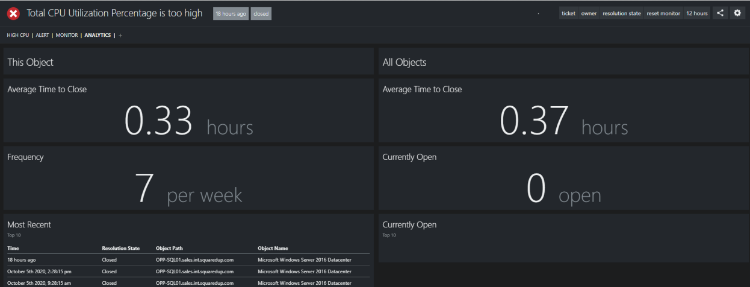
By selecting “Disk Free Space is low” in the Critical Alerts tile, our operator can drilldown to a new alert perspective called Analytics. The Analytics perspective will provide our operator more insights into this specific alert on our SQL server. It is obvious that this alert is occurring too frequently on this server. Although the alert tends to be resolved within our SLA for this server, it is unnecessarily distracting to our operator who will need to find a way to prevent the low disk space situation from occuring too frequently.
The entire process for identifying the correct root cause took less than a minute – from first noticing the issue on the new NOC dashboards, to starting to resolve the problem with an easy drilldown and finally using the new Root Cause perspective.
All the dashboards and perspectives shown above are available out of the box with SquaredUp for SCOM version 4.7 or higher.
What's new in SquaredUp for SCOM
If you want to find out more about Alert Management in SquaredUp for SCOM, take a moment to read our Chief Product Officer John Shaw's blog on the following new features:
Actionable Alerts and Alert History dashboards + Alert Analytics perspective
Don’t forget to check out our in-depth blog posts on our other cool new features.
And as always, our Support and Community pages can lend a helping hand if needed!

Coffee Break Series