
Ashley Thompson
Lead Solutions Engineer, SquaredUp
SCOM has incredible powers, but it’s not always easy to find the root cause of issues fast. And you definitely don't get one-click SCOM root cause analysis.
We’ve all been there. A business-critical server goes down and you don’t know why.
Let’s imagine you had a dashboard showing the health statuses of all your server groups and you notice that the United States is showing as critical. A common, basic visualization of a nested group structure may be able to show you the health statuses for each of your US locations. It may just have a few groups with children displaying data like regional locations with different availability tests or servers.
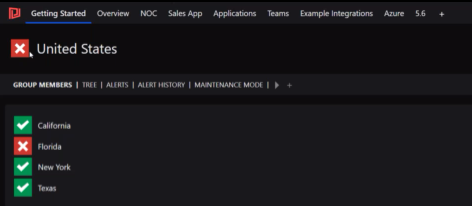
You get a flat and unintuitive structure that doesn’t show you much beyond the fact that Florida is down. But at least you know where to start looking. You pull the team together to hunt for the root cause, searching for what objects relate to that server and combing through them one by one in the hopes of finding the one that caused the issues.
However, if your enterprise applications are highly distributed, they’re not always visible in your SCOM environment and you can’t drill into the data they hold, which only makes the hunt for the root cause more complex. You need all your external dependencies, like CI/CD pipelines and virtualizations, visible in one place, as they often depend on each other and lead to knock-on effects.
We’ve all heard the horror stories from the big tech companies that had outages lasting for hours while everyone in the organization frantically hunted for the underlying issue to no avail. But outages are no less devastating in smaller organizations, particularly when major clients are impacted.
Most organizations have at least some basic dashboarding on top of SCOM, as a means of visualizing the underlying data.
Having some basic ability to visualize your SCOM data is a great start for finding root causes, but it’s only so helpful. Health statuses are rolled up and you often can’t drill down into the data further to check what the health status is for each underlying object.
Common visualizations give you nested roll-ups. However, you don’t know whether you should be investigating the servers, databases, or disks in Florida to find the root cause. You’ve still got a fair amount of manual effort ahead to resolve the issue, which wastes precious time and resources.
With SquaredUp, you’ve been able to drill down into this type of data for the past few years, but it’s still time consuming to get to the bottom line.
So, what if you could instantly see what SCOM object is causing the issue at a glance?
And not only visualize SCOM objects, but also distributed enterprise applications and their dependencies?
And how amazing would it be if you could be proactive about fixing issues rather than reactive when a group unexpectedly registers as critical?
At SquaredUp, we believe SCOM Admins’ lives should be made easier. So, we recently built the capability for you to pull all your external dependencies into your SquaredUp SCOM dashboard so they are visible next to your SCOM objects. We call it Dashboard Server: SCOM Edition EAM-X. This gives you truly connected visibility.
But we haven’t stopped there. We just built two new dashboard visualizations to help you run SCOM root cause analysis in one click.
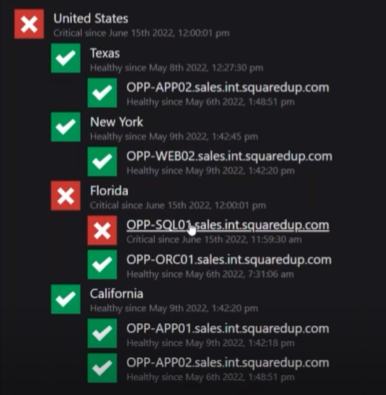
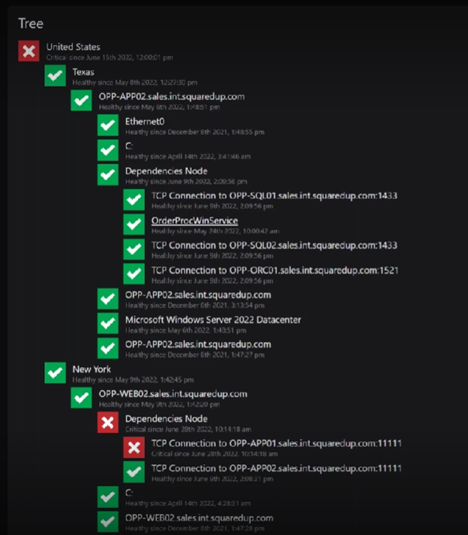
Meet the new Tree visualization. It allows you to visualize how things are nested, while rolling up their health. You can drill down in one click to see how SCOM objects relate to each other and identify the component that’s potentially causing the problem. It lets you glance at the hierarchy and health status of your SCOM objects.
Using our United States server group example, you can immediately see in the image below that it’s a server in Florida that underlies the critical health status roll-up. With all three child layers visible on drill-down, you don’t need to hunt for the root cause anymore. It's one-click SCOM root cause analysis.
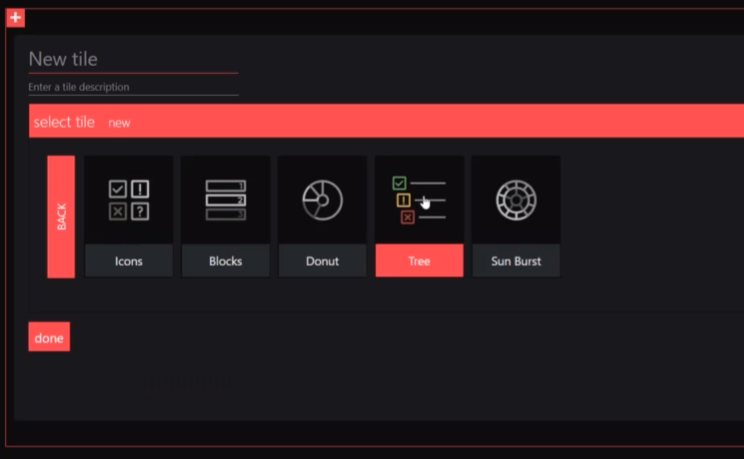
If you’re a SquaredUp user, update to the 5.6 version and create the tree diagram by selecting a status tile followed by the tree visualization.
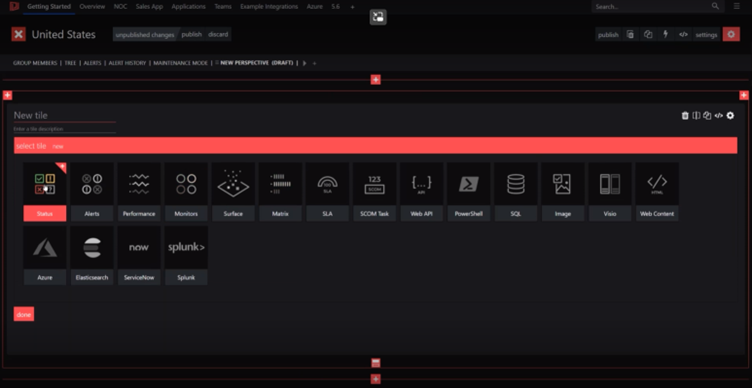
It defaults to showing critical objects only, but you can configure it to show all objects with the children and core components displayed. Then you can see where the health state for the group is coming from.
This is also useful when you are looking at a monitored entity view in SquaredUp. Here, you can look at everything that relates to a particular object, like the disks and databases that relate to each server.
This view has always shown the parents and children, but it’s traditionally been a flat understanding of what the child objects are. So we’ve automatically inserted the tree diagram at the bottom of the monitored entity view so you can see all the relationships at a glance.
Another way to visualize all your SCOM objects for root cause analysis is with the sunburst visualization. The inner circle represents the highest-level parent object, and each successive ring displays its related children.
Simply hover over the object you want to see and the information will be displayed next to it. You can even spin the sunburst to see labels more clearly.
Plus, if you pair your sunburst visualization with your enterprise applications in the SquaredUp EAM-X for SCOM, you can explore all your objects in a single pane of glass. This is incredibly powerful for super-fast SCOM root cause analysis.
If you’re already using Dashboard Server: SCOM Edition EAM-X, all the features you have seen are available today. Head over to download.squaredup.com for instant access.
If you’re new to SquaredUp, you can try out the community edition of SquaredUp here.