The science behind APM – how it works
Monitoring has typically been the remit of small, specialised IT Operations teams but the tools they’ve been given are rarely fit for purpose in today’s demanding environments. Heavyweight, centralised monitoring tools tend to lead with an infrastructure-centric monitoring approach, which is great if you want a huge amount of granular detail about the health and availability of individual infrastructure components but not so great if you want to understand how these components impact application and service availability. After all, that’s what your business really cares about.
Application Performance Management (APM) essentially succeeds traditional, infrastructure-centric monitoring tools as the next-generation of monitoring technology. Designed to put end user experience, application availability and performance at the heart of the monitoring experience, they’re ideally suited for consumer-scale websites and applications, or modern web-apps that are built and managed by DevOps teams.
It’s a super competitive market with incumbents ranging from New Relic, AppDynamics, Dynatrace, Datadog and Microsoft’s Application Insights. APM is big business.
APM architecture
Wait a minute, you’re not an APM specialist – why should we trust you with our fledgling APM knowledge?
Good question. Whilst our background isn't in APM, SquaredUp share the vision that applications should be put at the heart of your monitoring strategy. So, to put it lightly, we’re big fans. Big impartial fans.
Everything you're about to read in this article is based on pre-existing information, and where possible, the original source has been credited throughout. Make no bones about it, every APM tool is different, this article simply serves as a neat little overview for the architectural basics.
Now, assuming you’re still with us, let’s turn our attention to the rather beautiful looking diagram below:
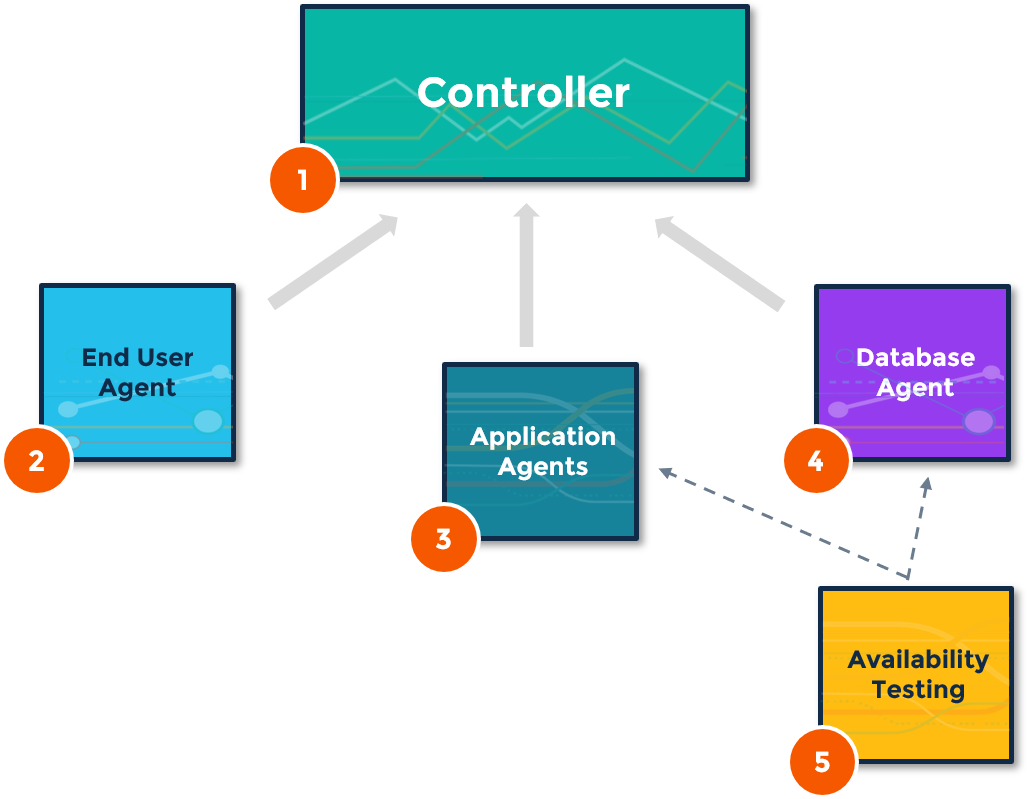
Before we jump in it’s worth noting that not all these components *need* to be deployed concurrently, although APM tools do work best when you’re able to vividly picture application performance from multiple viewpoints. To add to this - not all APM vendors offer this exact tooling - this diagram serves as an amalgamation of what's already available online.
Right, now that little disclaimer is out the way - let’s annotate this bad boy...
1. Controller
APM architecture is largely the same amongst its incumbents - it’s the controller where the vendors stash most of their secret sauce.
All the data collected by the agents is aggregated by the controller before it then works some magic and transforms all that juicy info into meaningful insights. This information is then passed back to the organization - typically via a web portal.
It’s important to note that the controller can also fire alerts when custom benchmarks have been missed. This could be something as simple as transaction times or resource consumption deviating from a previously established baseline. It’s really up to the organization to define what’s important to them.
2. End User Agent / Browser Monitoring
The end user agent is the first of four agents that are used by most APM vendors – and it’s usually the most lightweight. As the name suggests, this type of agent allows APM vendors to collect performance data directly from end user machines. As with all agents the focus is on business transactions and this type of agent gives direct insight into how an application is performing from an end user perspective.
This can require application changes at a code level – but all this hard work will enable an APM tool to gather custom metrics and track specific events. To add more clarity, here’s a list of custom events and metrics that are available through Microsoft's Application Insights tool.
Remember, whilst everything might look spick and span under the hood it's the opinion of your customers that matters most.
3. Application Agents
An application agent is piece of software that is installed on a server (or within an application) that sends performance data back to the controller. There’s actually two takes on this agent type; stack aware agents and machine agents - both of which are covered below:
a) Stack aware agents
Most APM vendors offer various flavours to this agent type straight out the box. This allows their users to choose an agent type that will collect and gather metrics that are specific to their application’s topology – whether that be Java, .NET or Node based agents.
Here’s a list of agent types currently available with New Relic.
b) Machine agents
Now we’re talking. Now we’re heading towards familiar territory...
Although machine agents are nowhere near as extensible as the SCOM agent, they do operate in a very similar fashion. Once installed the machine agent will monitor infrastructure components and collect metrics such as disk space, RAM and CPU utilization. Pretty mundane metrics in isolation but put into the context of key applications and services – as we know – they’re absolute gold.
AppDynamics detail how their machine agent works via this short little video.
4. Database Agent
AppDynamics claim that the most common cause of application slowdowns is slow SQL or stored procedures in the database. Enter the database agent.
Although some vendors claim this can be done agentless – the end result remains the same. To reaffirm a point made earlier – the focus for APM should always be business transactions – and the relationships between an application and its databases is a sure-fire way to identify potential performance issues.
Just think, there might be more to that slow running SQL query than you first thought!
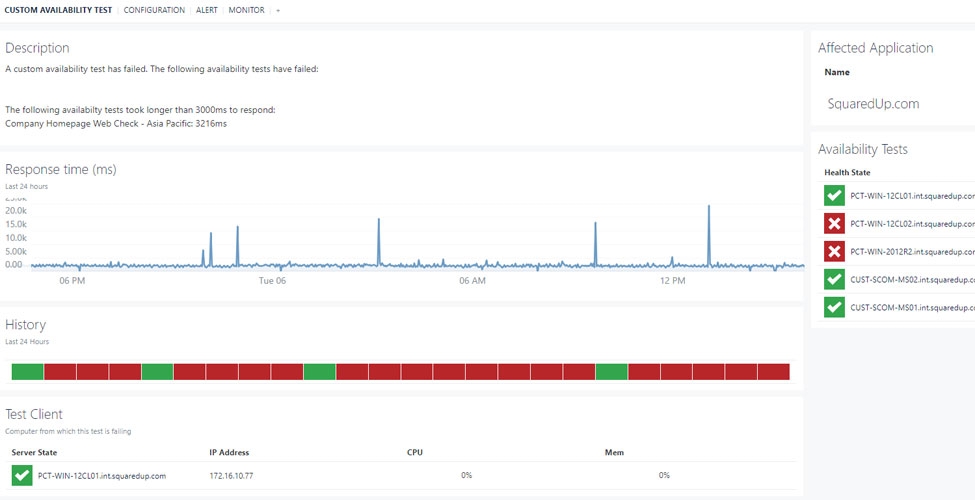
5. Availability Testing
This is by no means a staple part of APM – at a push it’s an optional extra provided by a select few. However, as we’re a champion of outside-in monitoring, we thought it was worth a cheeky shout-out. In some cases, APM vendors will offer availability testing as part of their offering – when this is the case a network of watchers, monitoring the application's availability, report results via machine/database agents indicating whether or not the application is actually accessible - regardless of what the other agents are reporting.
Wrapping things up!
This concludes our introductory overview - we hope you found it useful. Please remember that we are by no means APM specialists – Enterprise Application Monitoring (EAM) is more our bag - however, as a complementary topic we scoured the internet so we could compare architectural differences at-a-glance. This blog only scratches at the surface so for anyone looking to newly deploy APM we’d encourage you to check out vendor specific documentation first. To get you started, we've provided a few helpful links below:
- Dynatrace documentation is available here.
- AppDynamics documentation is available here.
- New Relic documentation is available here.
---
Want to read more? Check out our complete guide to APM.
Related content


Coffee Break Series
Coffee Break: Office 365 monitoring with NiCE
Coffee Break Series
Coffee Break: Application dashboards with Splunk and ServiceNow
Coffee Break Series