Sameer Mhaisekar
SquaredUp, Technical Evangelist

In this blog we are going to discuss how you can use Cookdown’s PowerShell MP to create SCOM tasks written in PowerShell and how you can visualise the output of your tasks in a much more efficient and user-readable format – using SquaredUp.
SCOM tasks are fantastic – they let you access data on demand. You can run them remotely in response to an alert and use them to get detailed diagnostics, or to run recoveries, etc. There are console tasks which run on the Management Servers, and there are agent tasks which you can run on the agents of your choice.
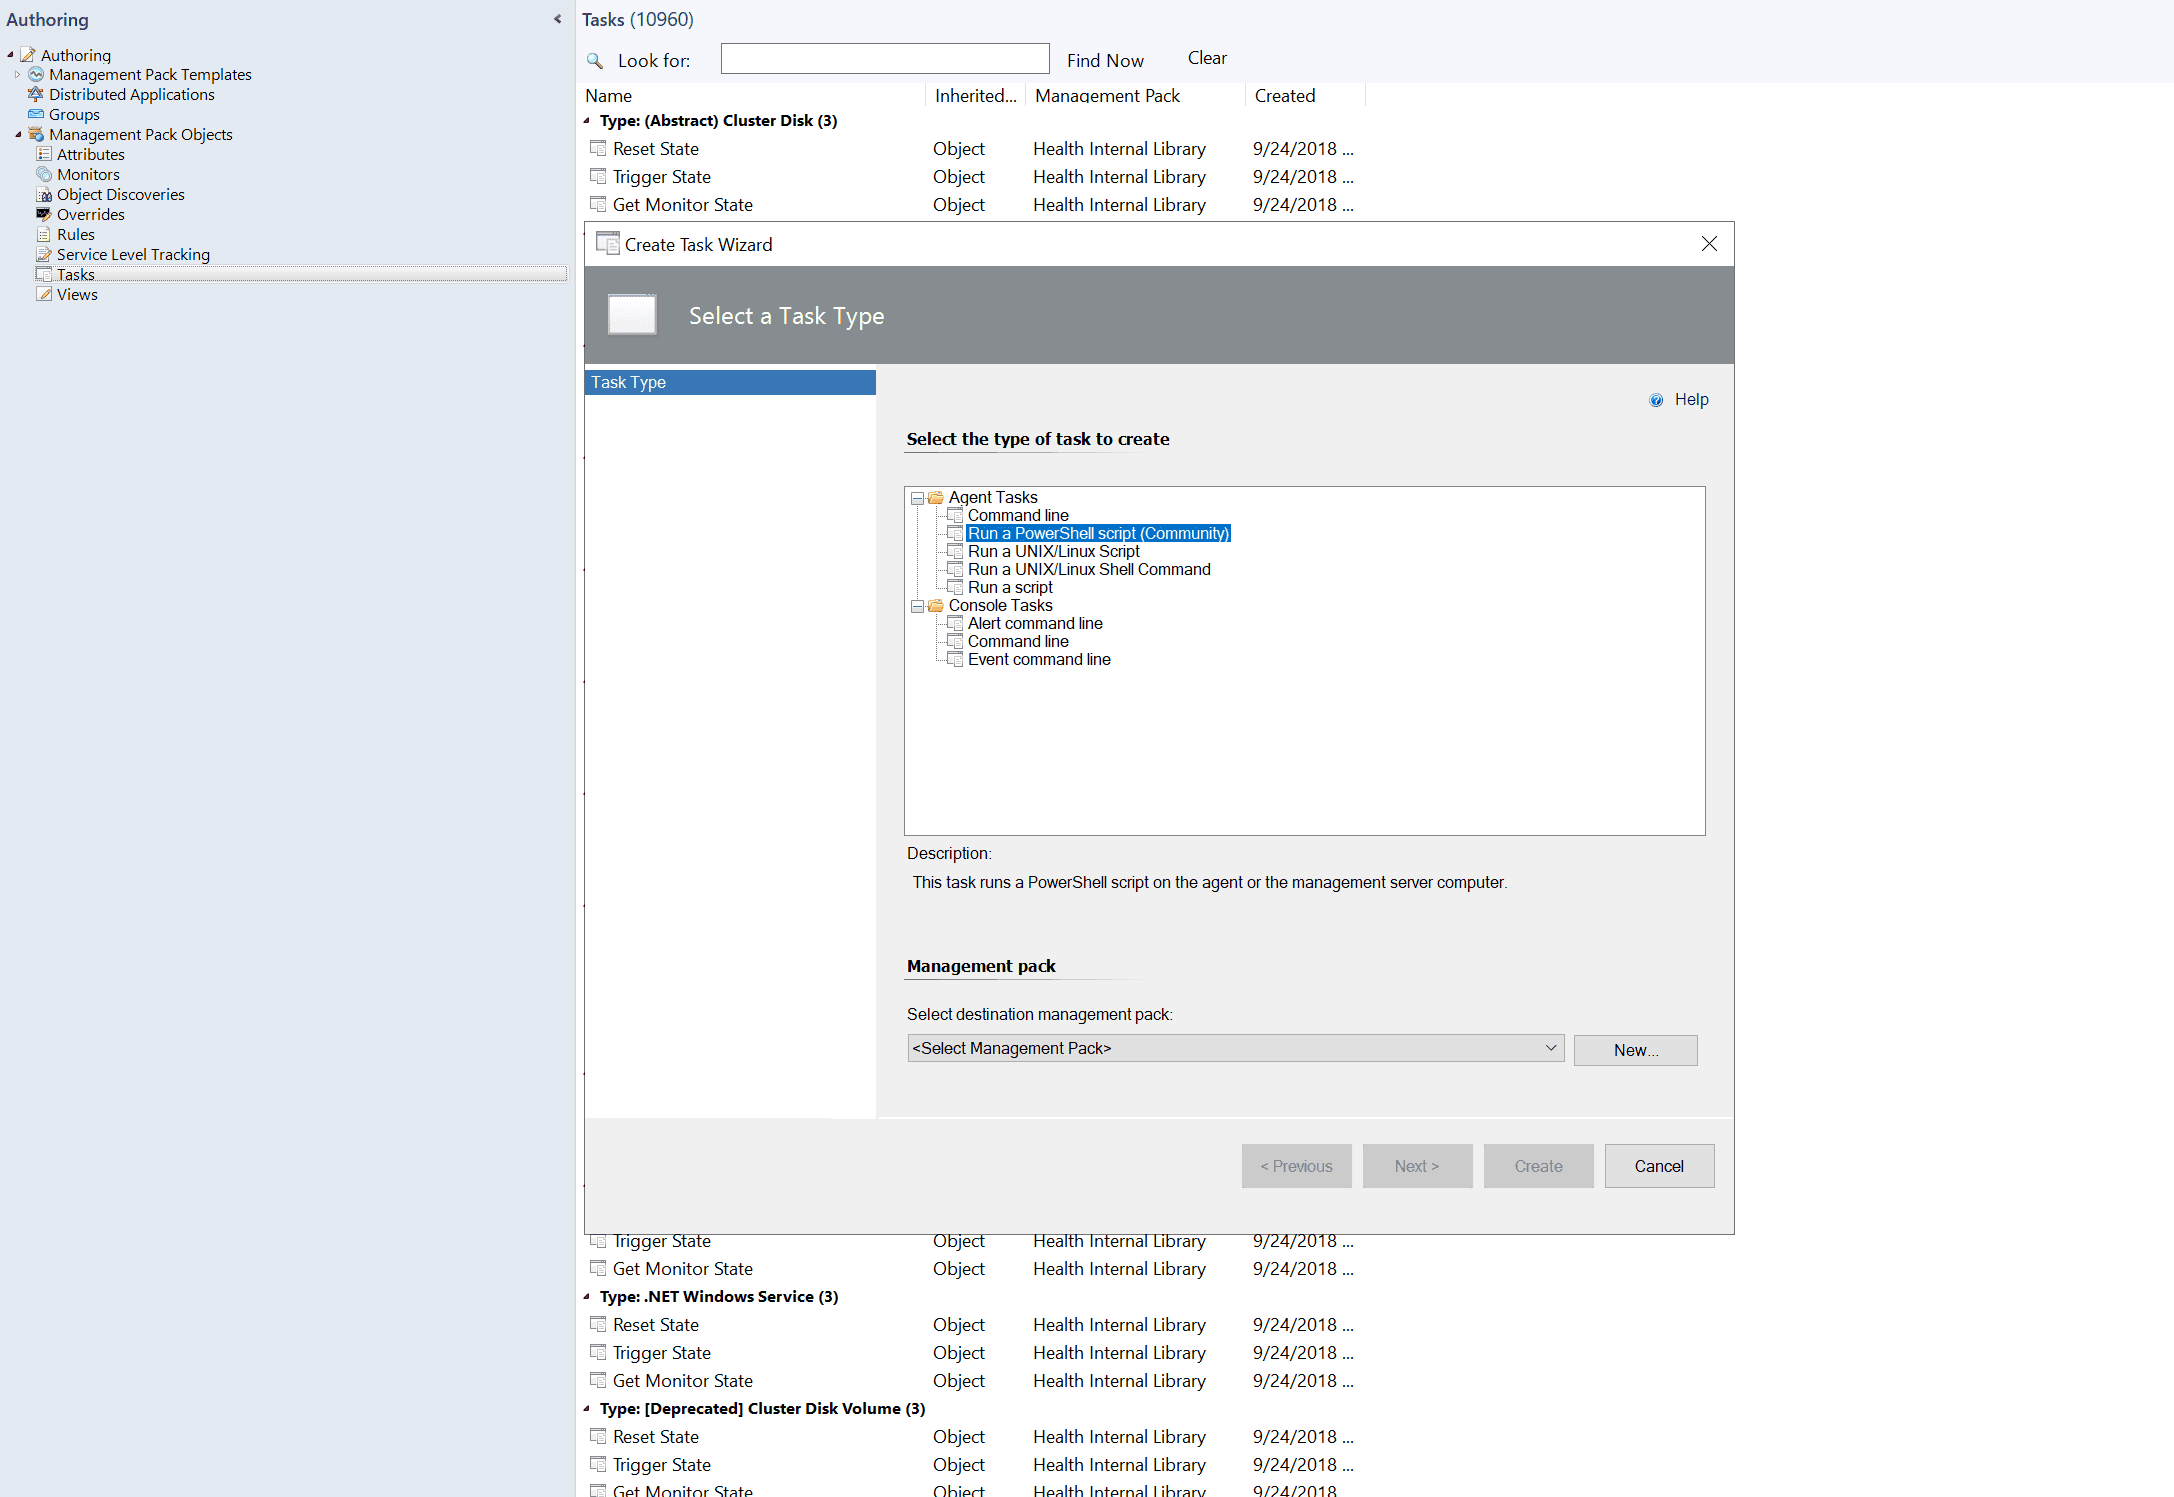
The Powershell Management Pack
This management pack gives you the ability to run PowerShell scripts in your tasks – which makes your life much easier. You may already have a few PowerShell scripts floating around that your respective teams use to diagnose an issue or recover from one, but you probably also faced issues automating them because SCOM refused to work with PowerShell. Now that you’ve got this MP in your arsenal, you can automate your PowerShell scripts using SCOM.
To get started, check out this excellent walk-through of the MP.
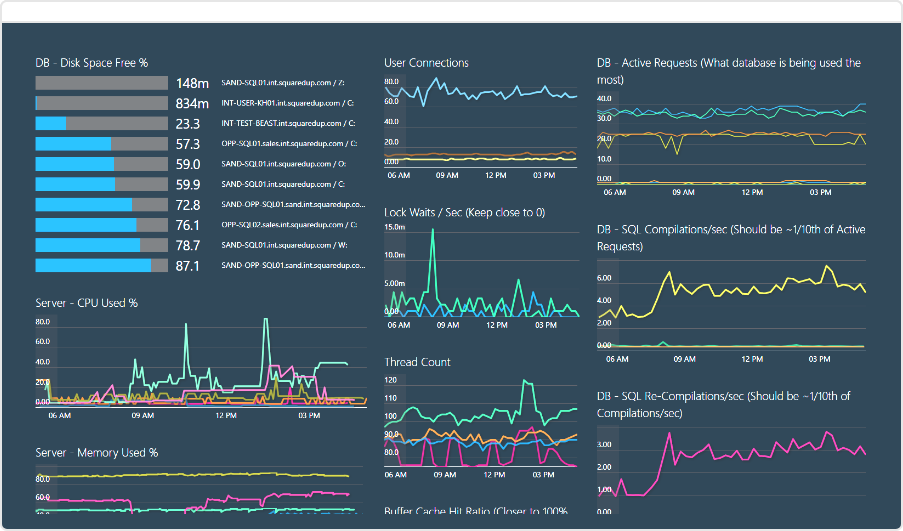
The Management Pack is very helpful in itself, but you can take it even further. The MP solves the first issue of not being able to run PowerShell scripts, but now, you need to find a way to incorporate that into your dashboarding so you can share the results with other teams as well. While I have with me a PowerShell script that fetches the recent updates installed on the server and displays the result in CSV format, how can I visualise my task results and share them with my colleagues? Why, using SquaredUp of course!
Here we will walk you through the process of how to achieve this end-to-end using the PowerShell MP and SquaredUp’s SCOM task tile.
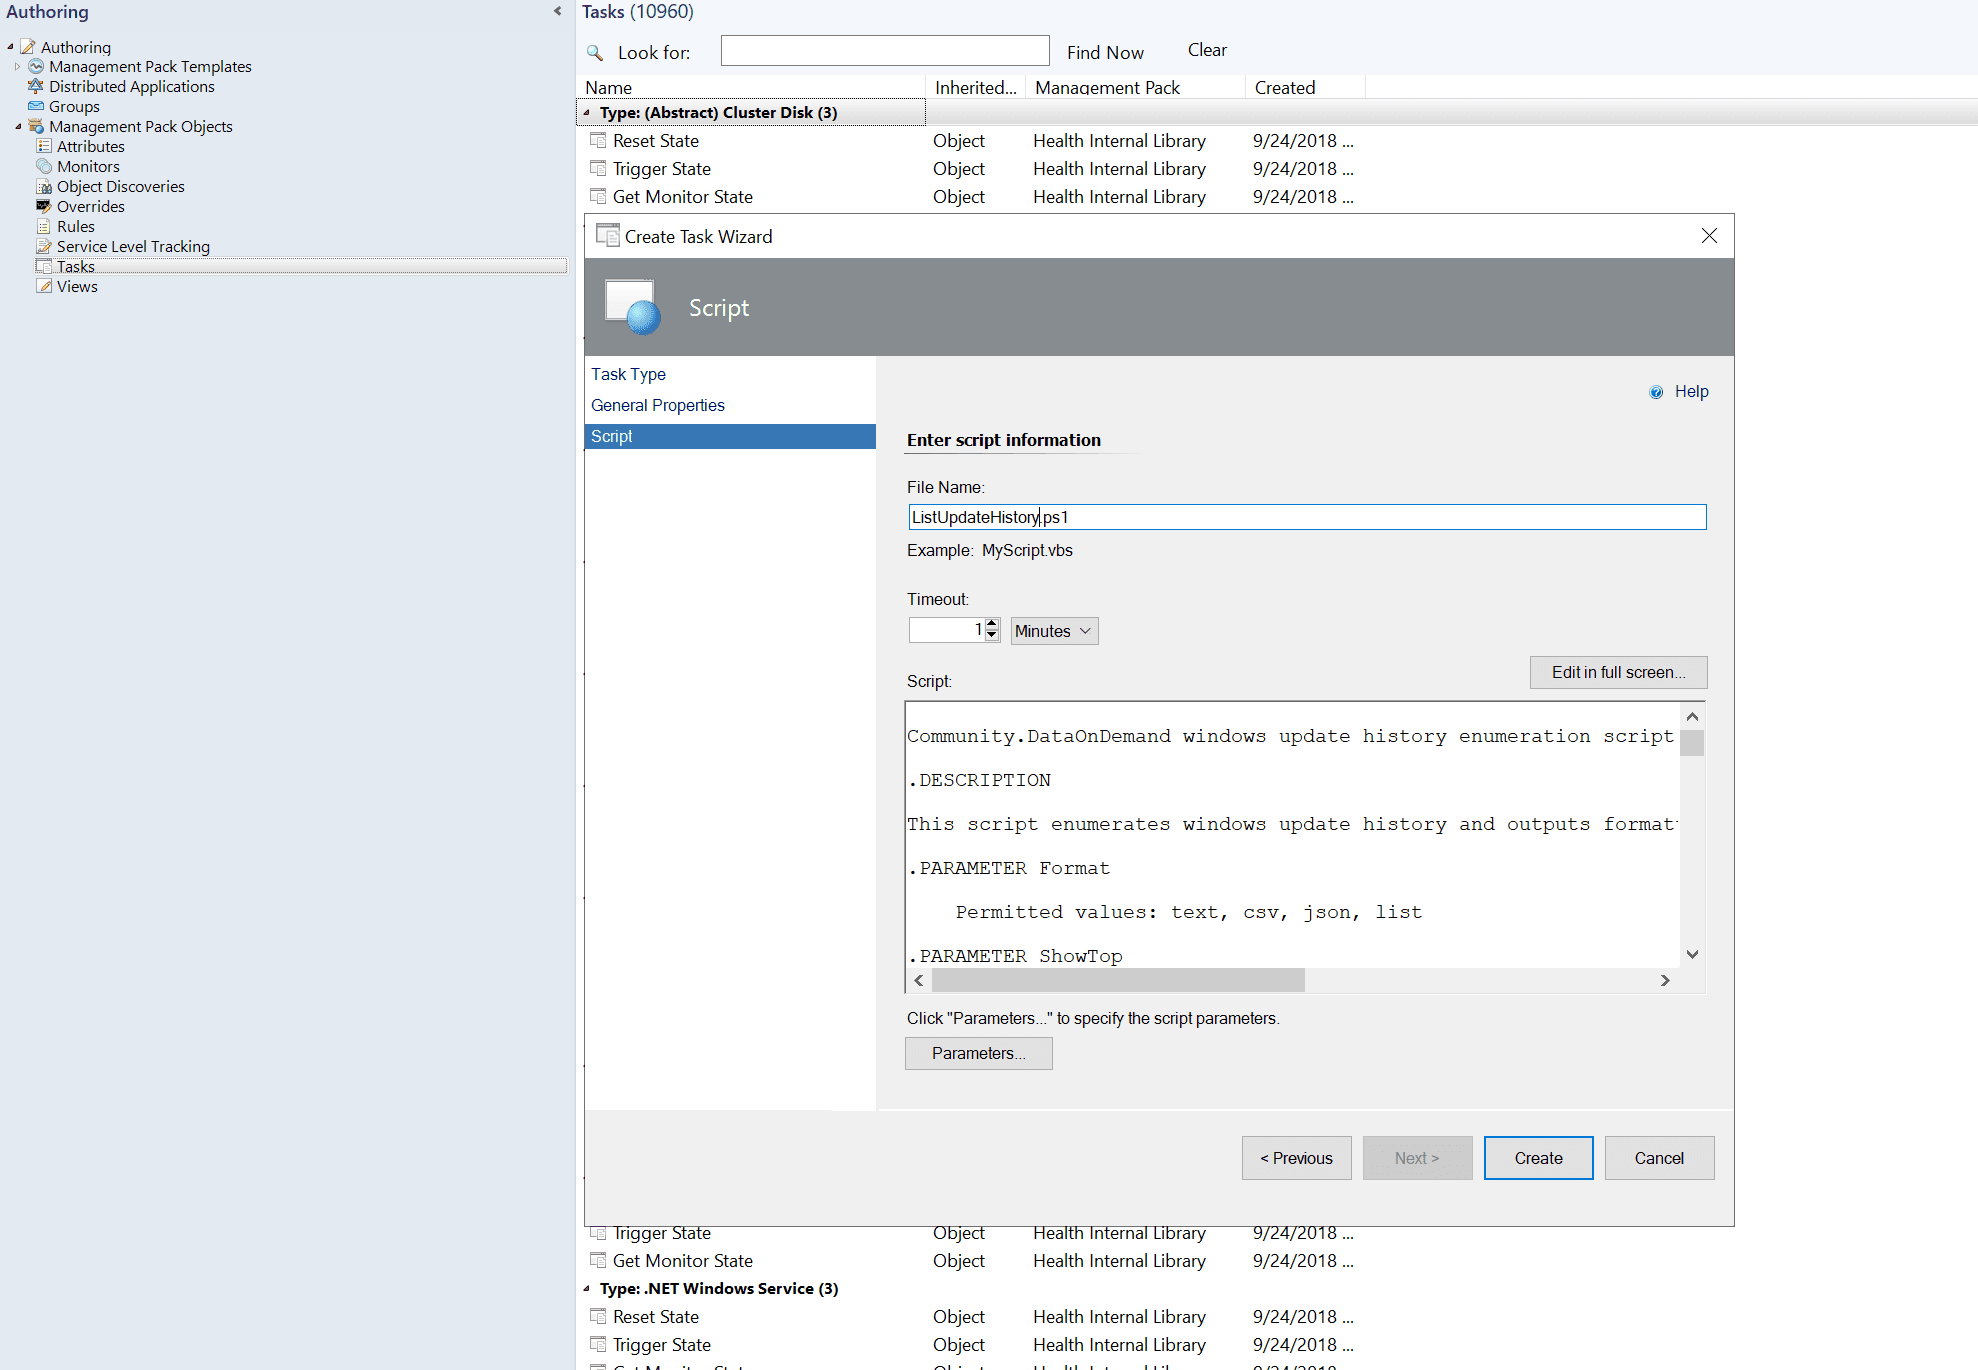
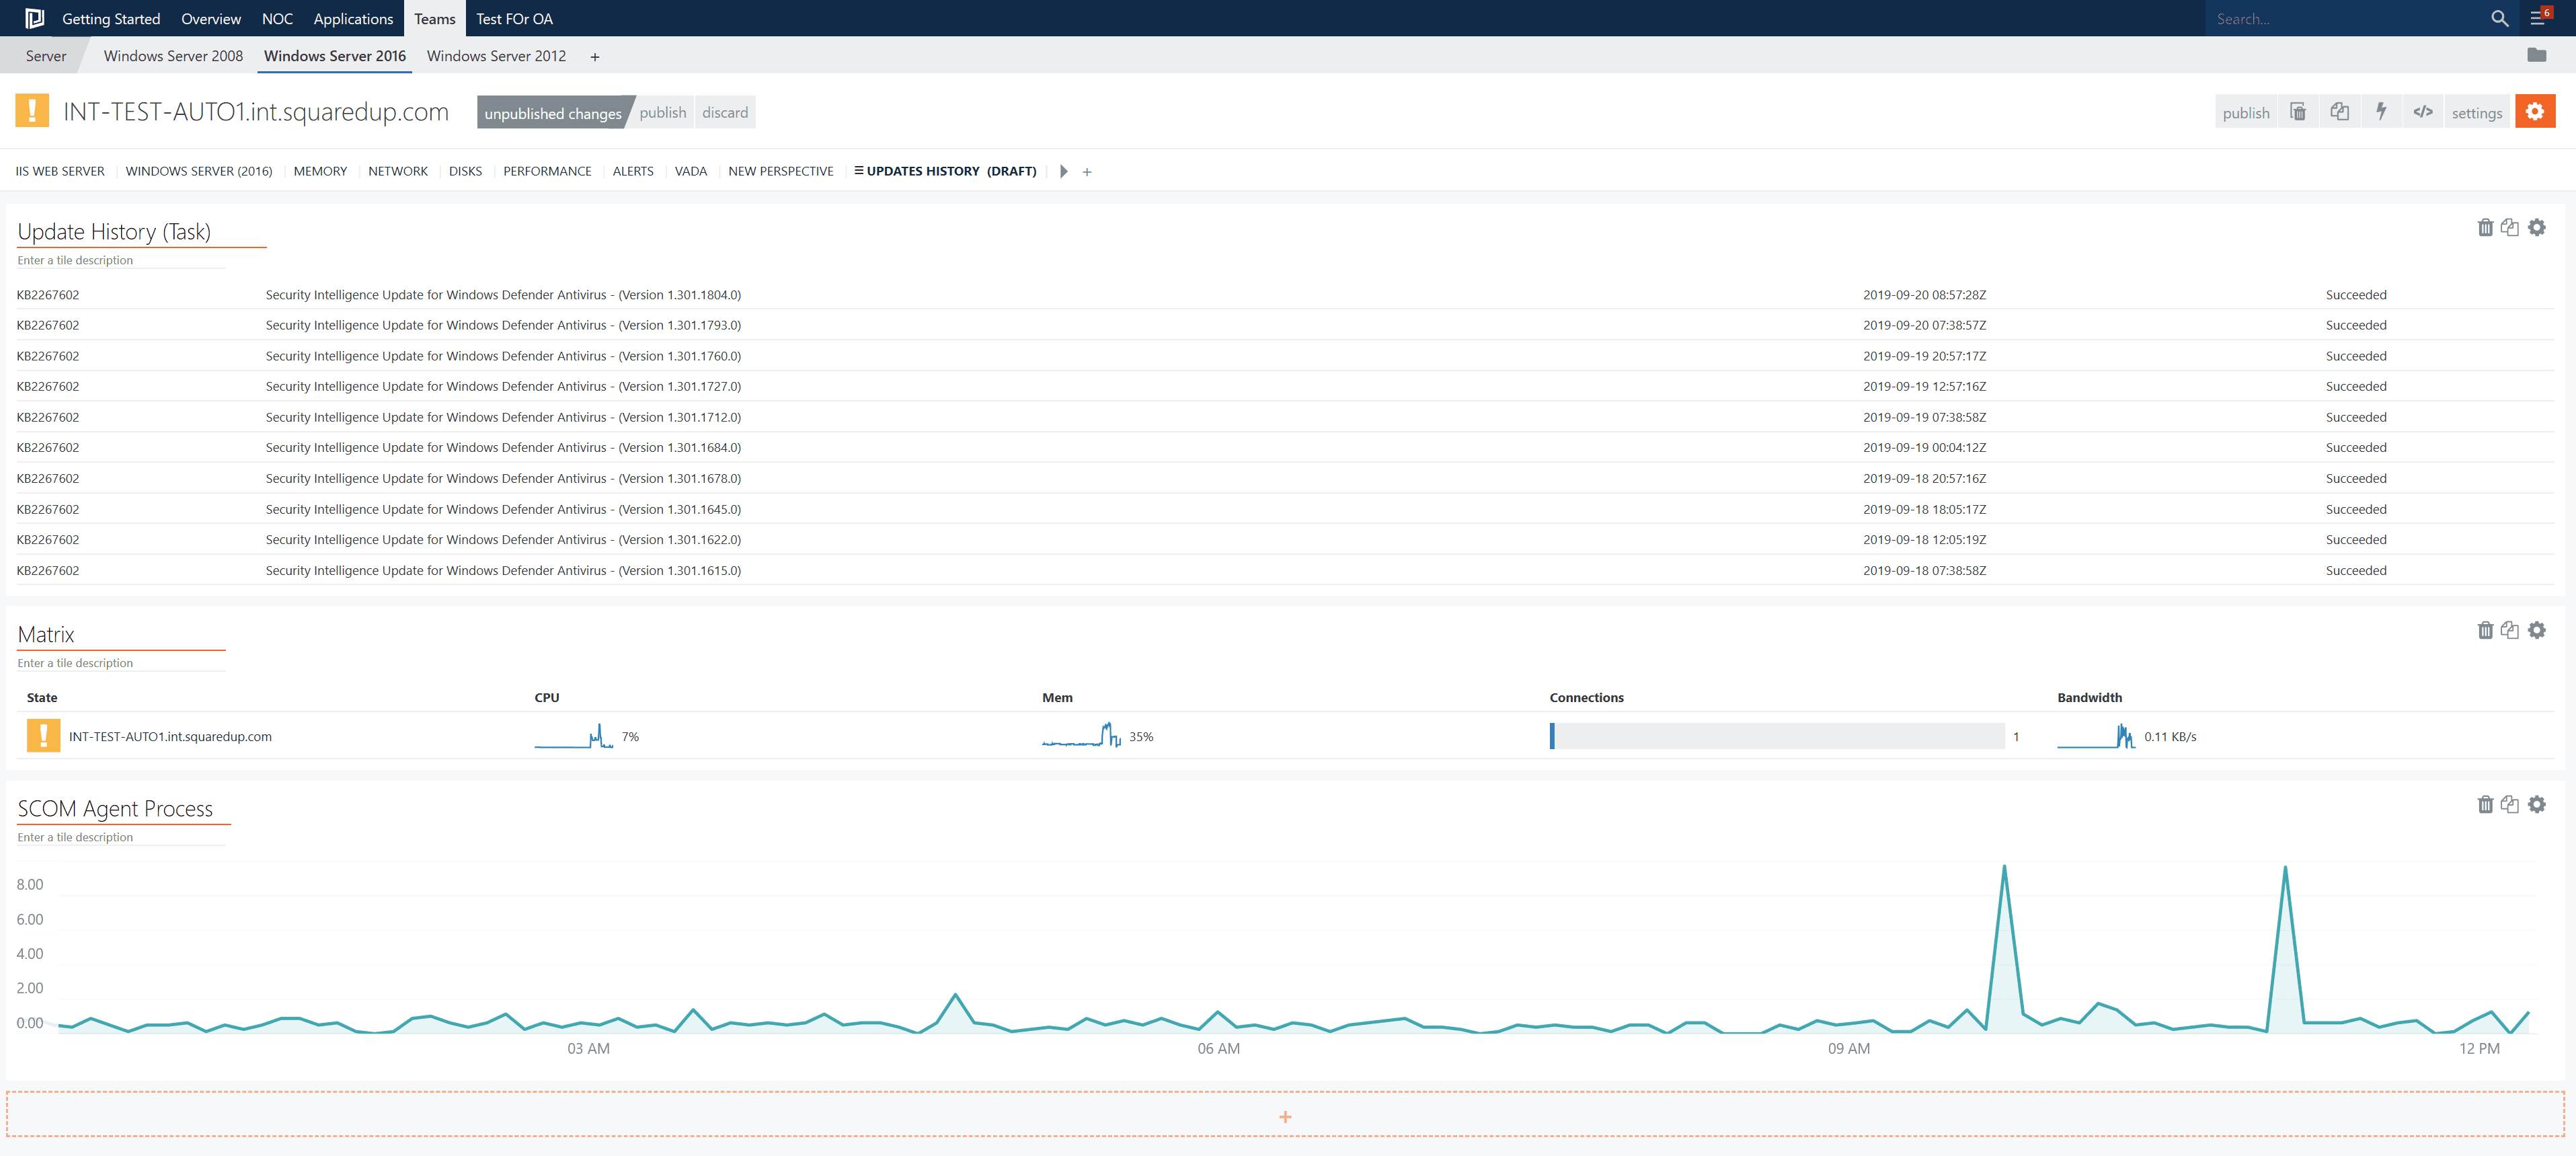
Paste your script and hit the create button. Now as you go into the view scoped to the class you targeted your task to, it should be visible on the right-hand side under “Windows Computer Tasks.”
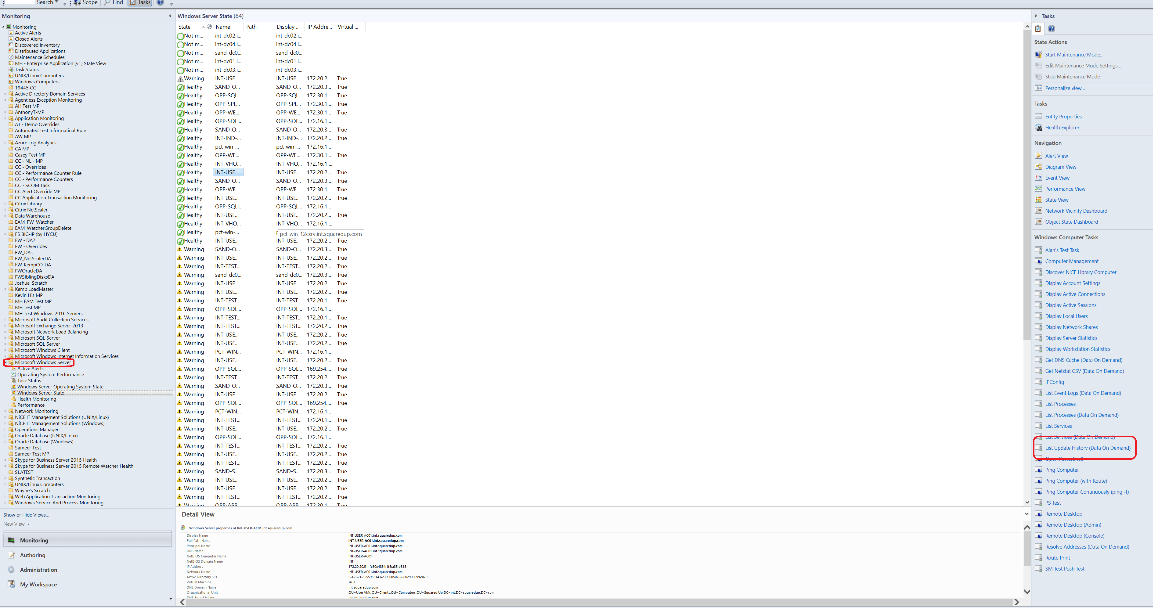
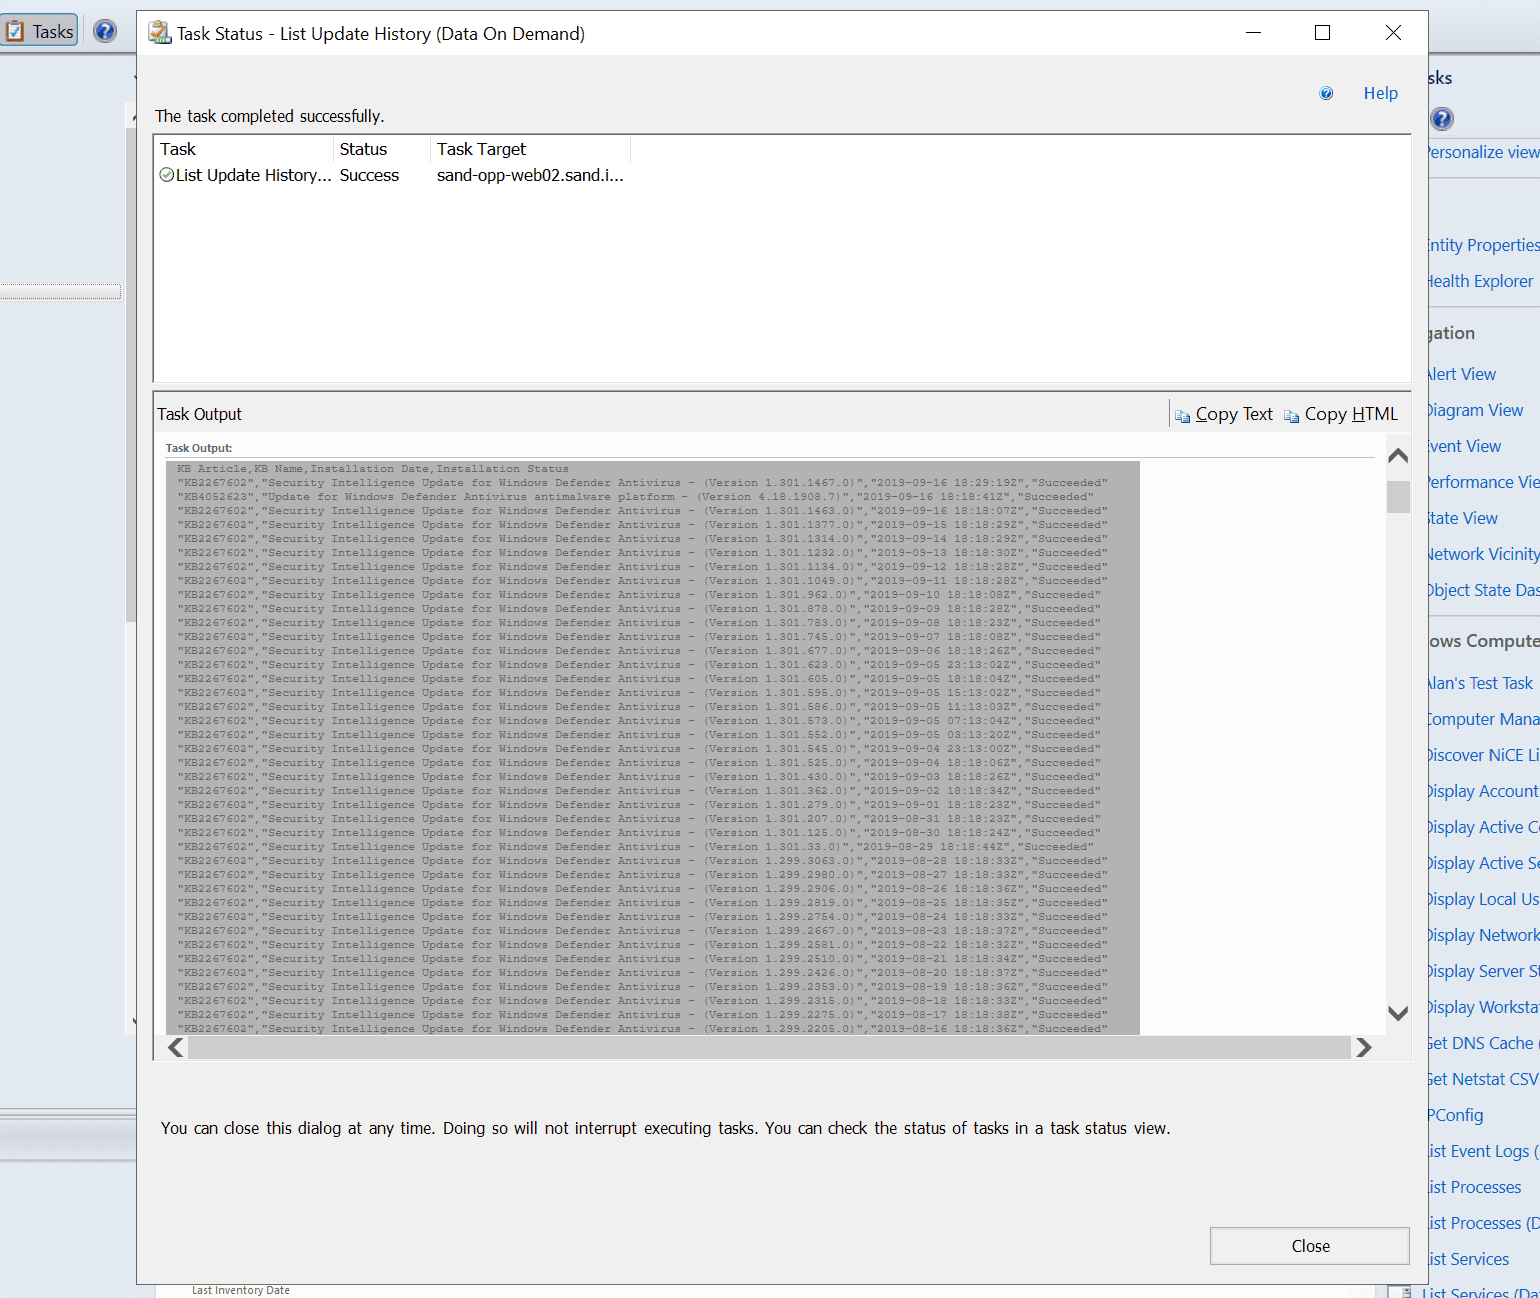
Hmm…looks really useful, but it isn’t very pretty to look at! Let’s see how SquaredUp can help me visualise it better.
Also, it looks like I have to repeat this process every time on each server I want to run the task on. Would be great if I could just create it once and see the results every time I’m browsing into the object automatically.
I’m presented with the below screen:
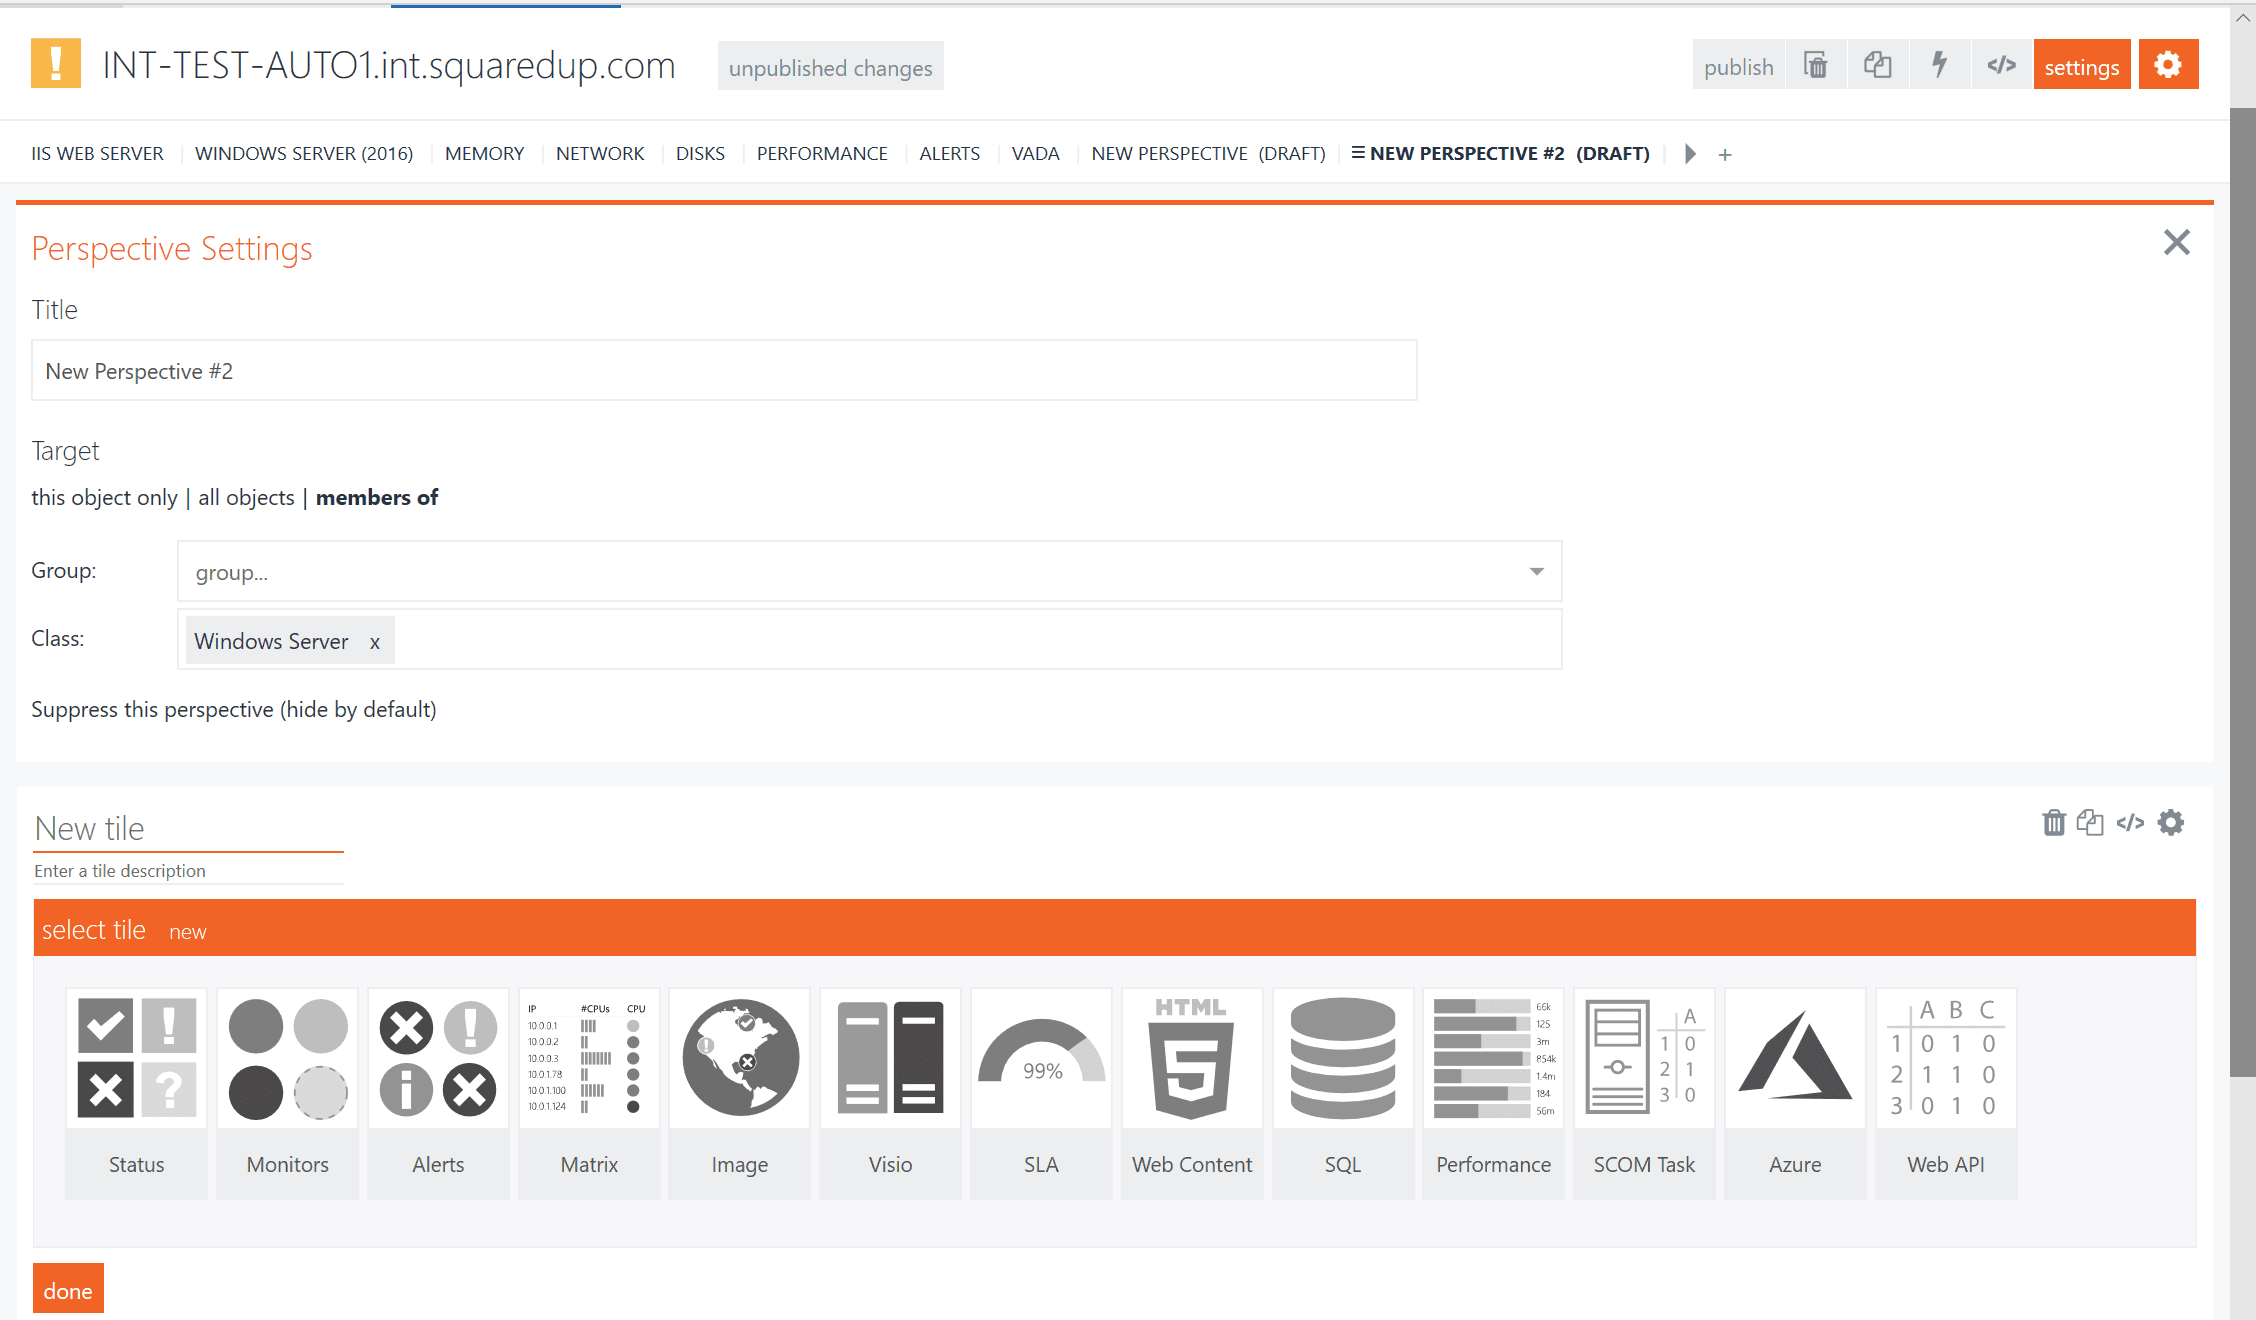
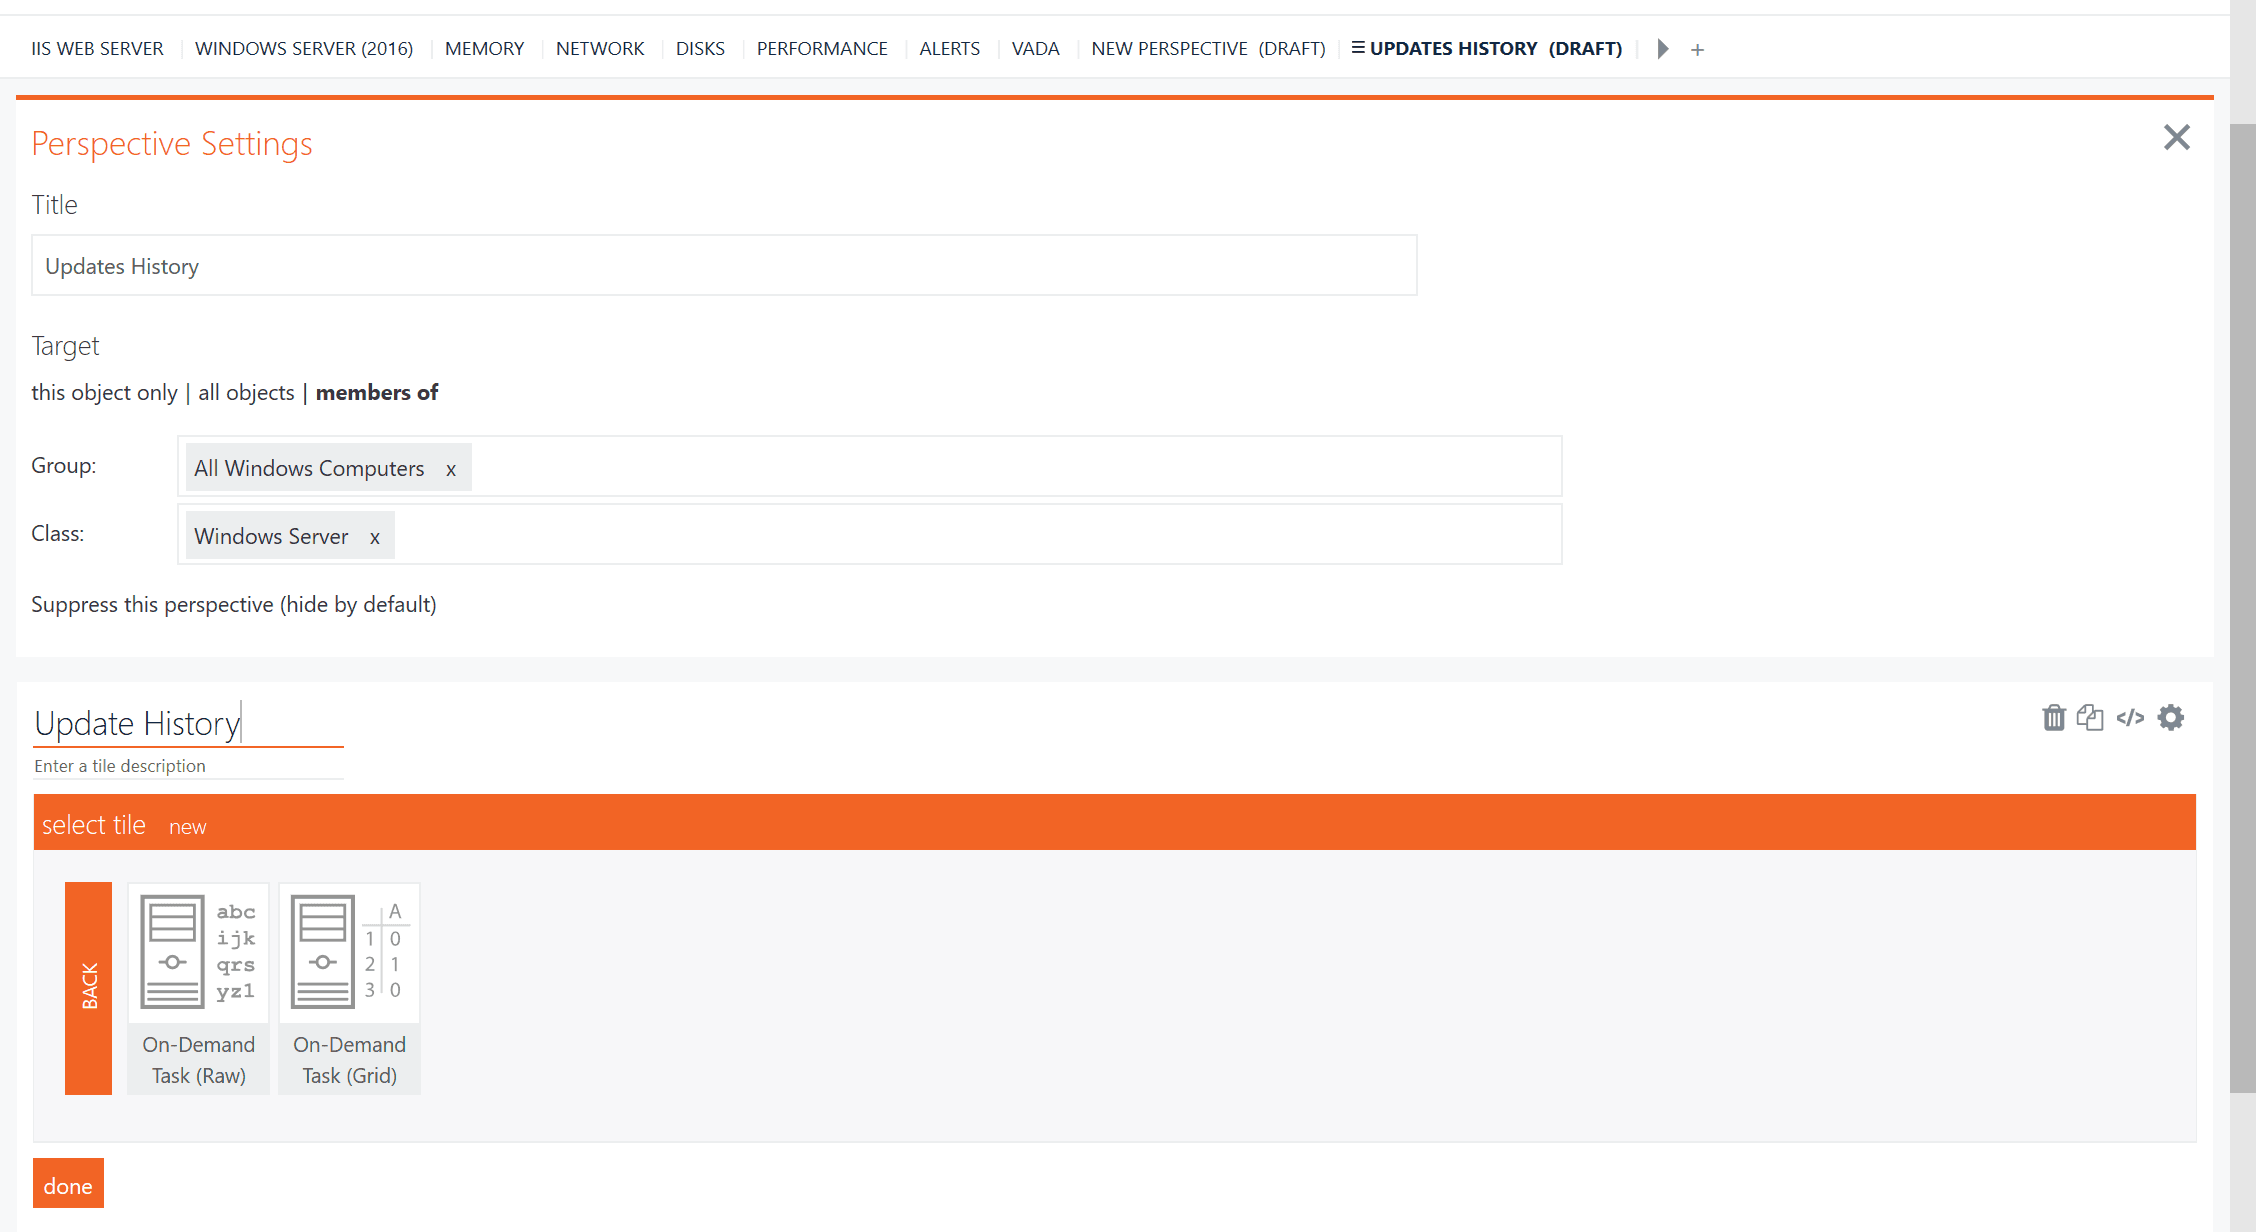
Fill in the fields, such as the Perspective Name, the target, name for your tile, etc.
The On-Demand Task (Raw) is for the tasks that return data in text format, while the (Grid) option is for the tasks that return results in tabular/structured format like CSV, json, etc.
Let’s select On-Demand Task (Grid) for our purposes.
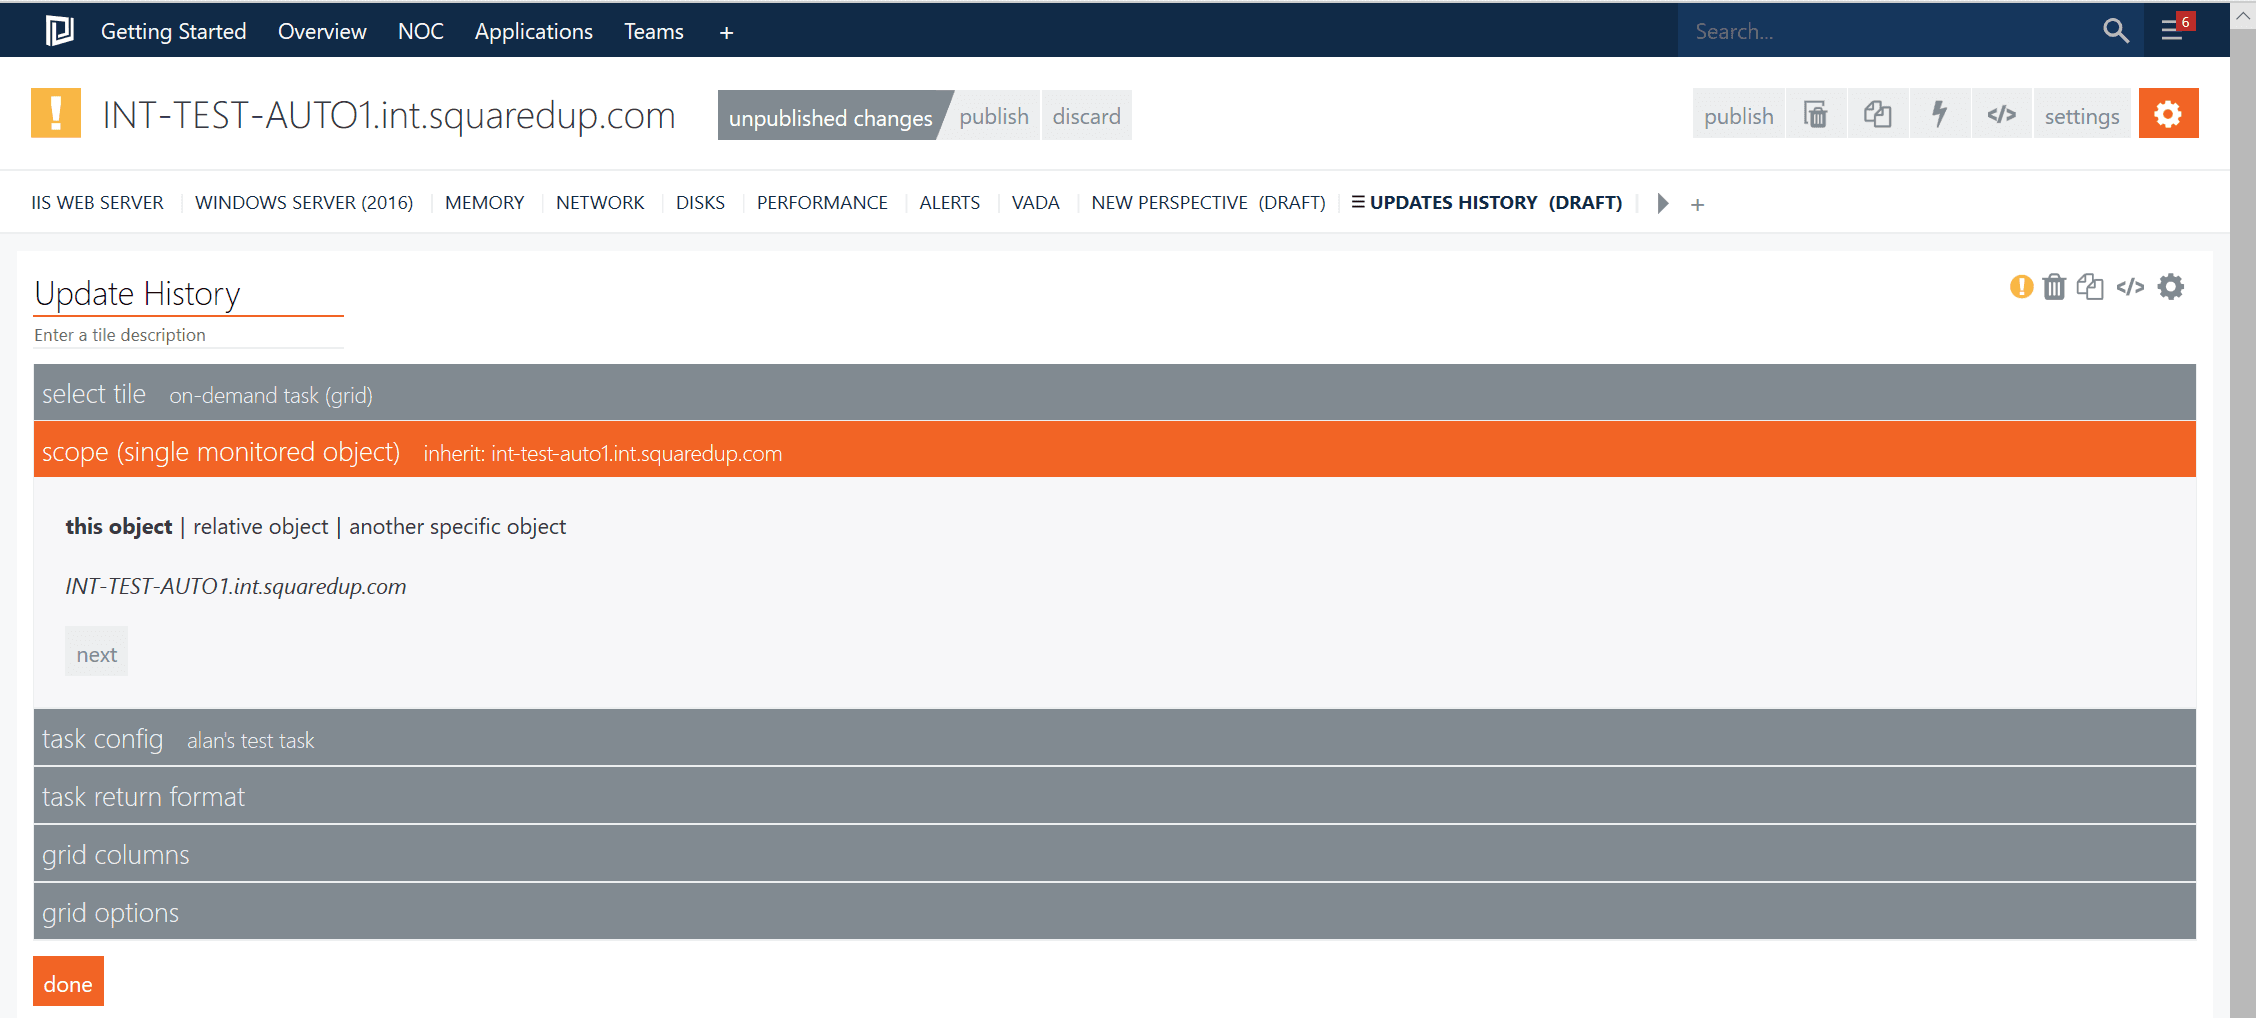
Scope it properly to “this object” so that every time you browse into a server you see the task appearing there.
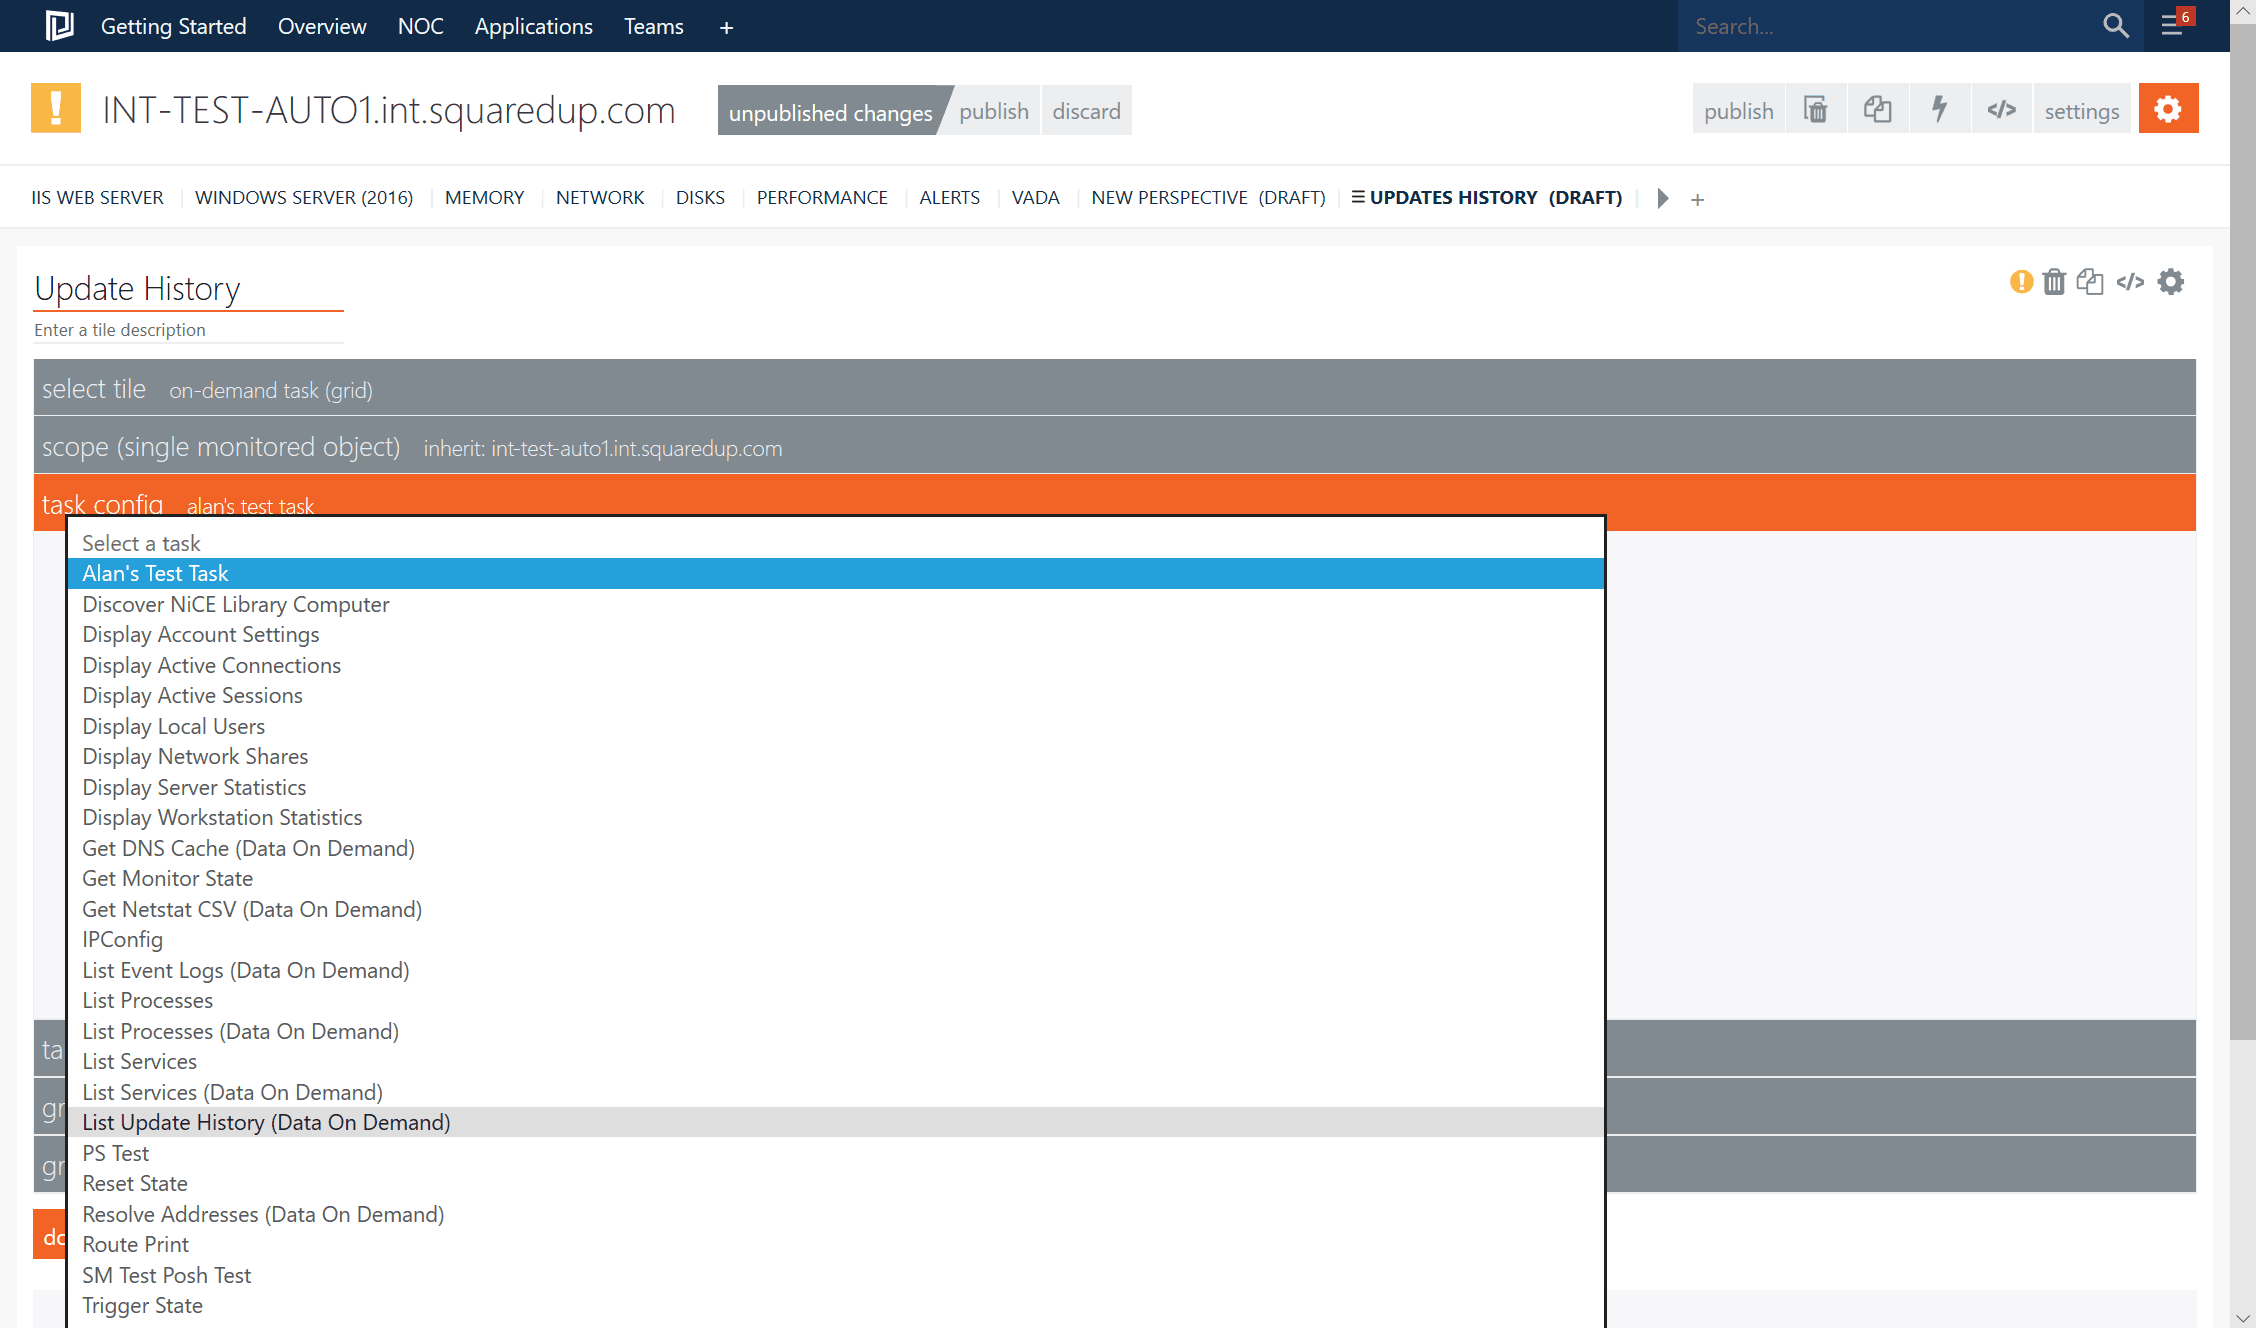
Under “task config” I can see all the tasks available to me. The one we’re looking for is “List Update History (Data On Demand)”.
You can also specify some overrides from the list, I will select the “ShowTop” override and narrow down the list to 10. Once done, hit “apply changes” and then “next”.
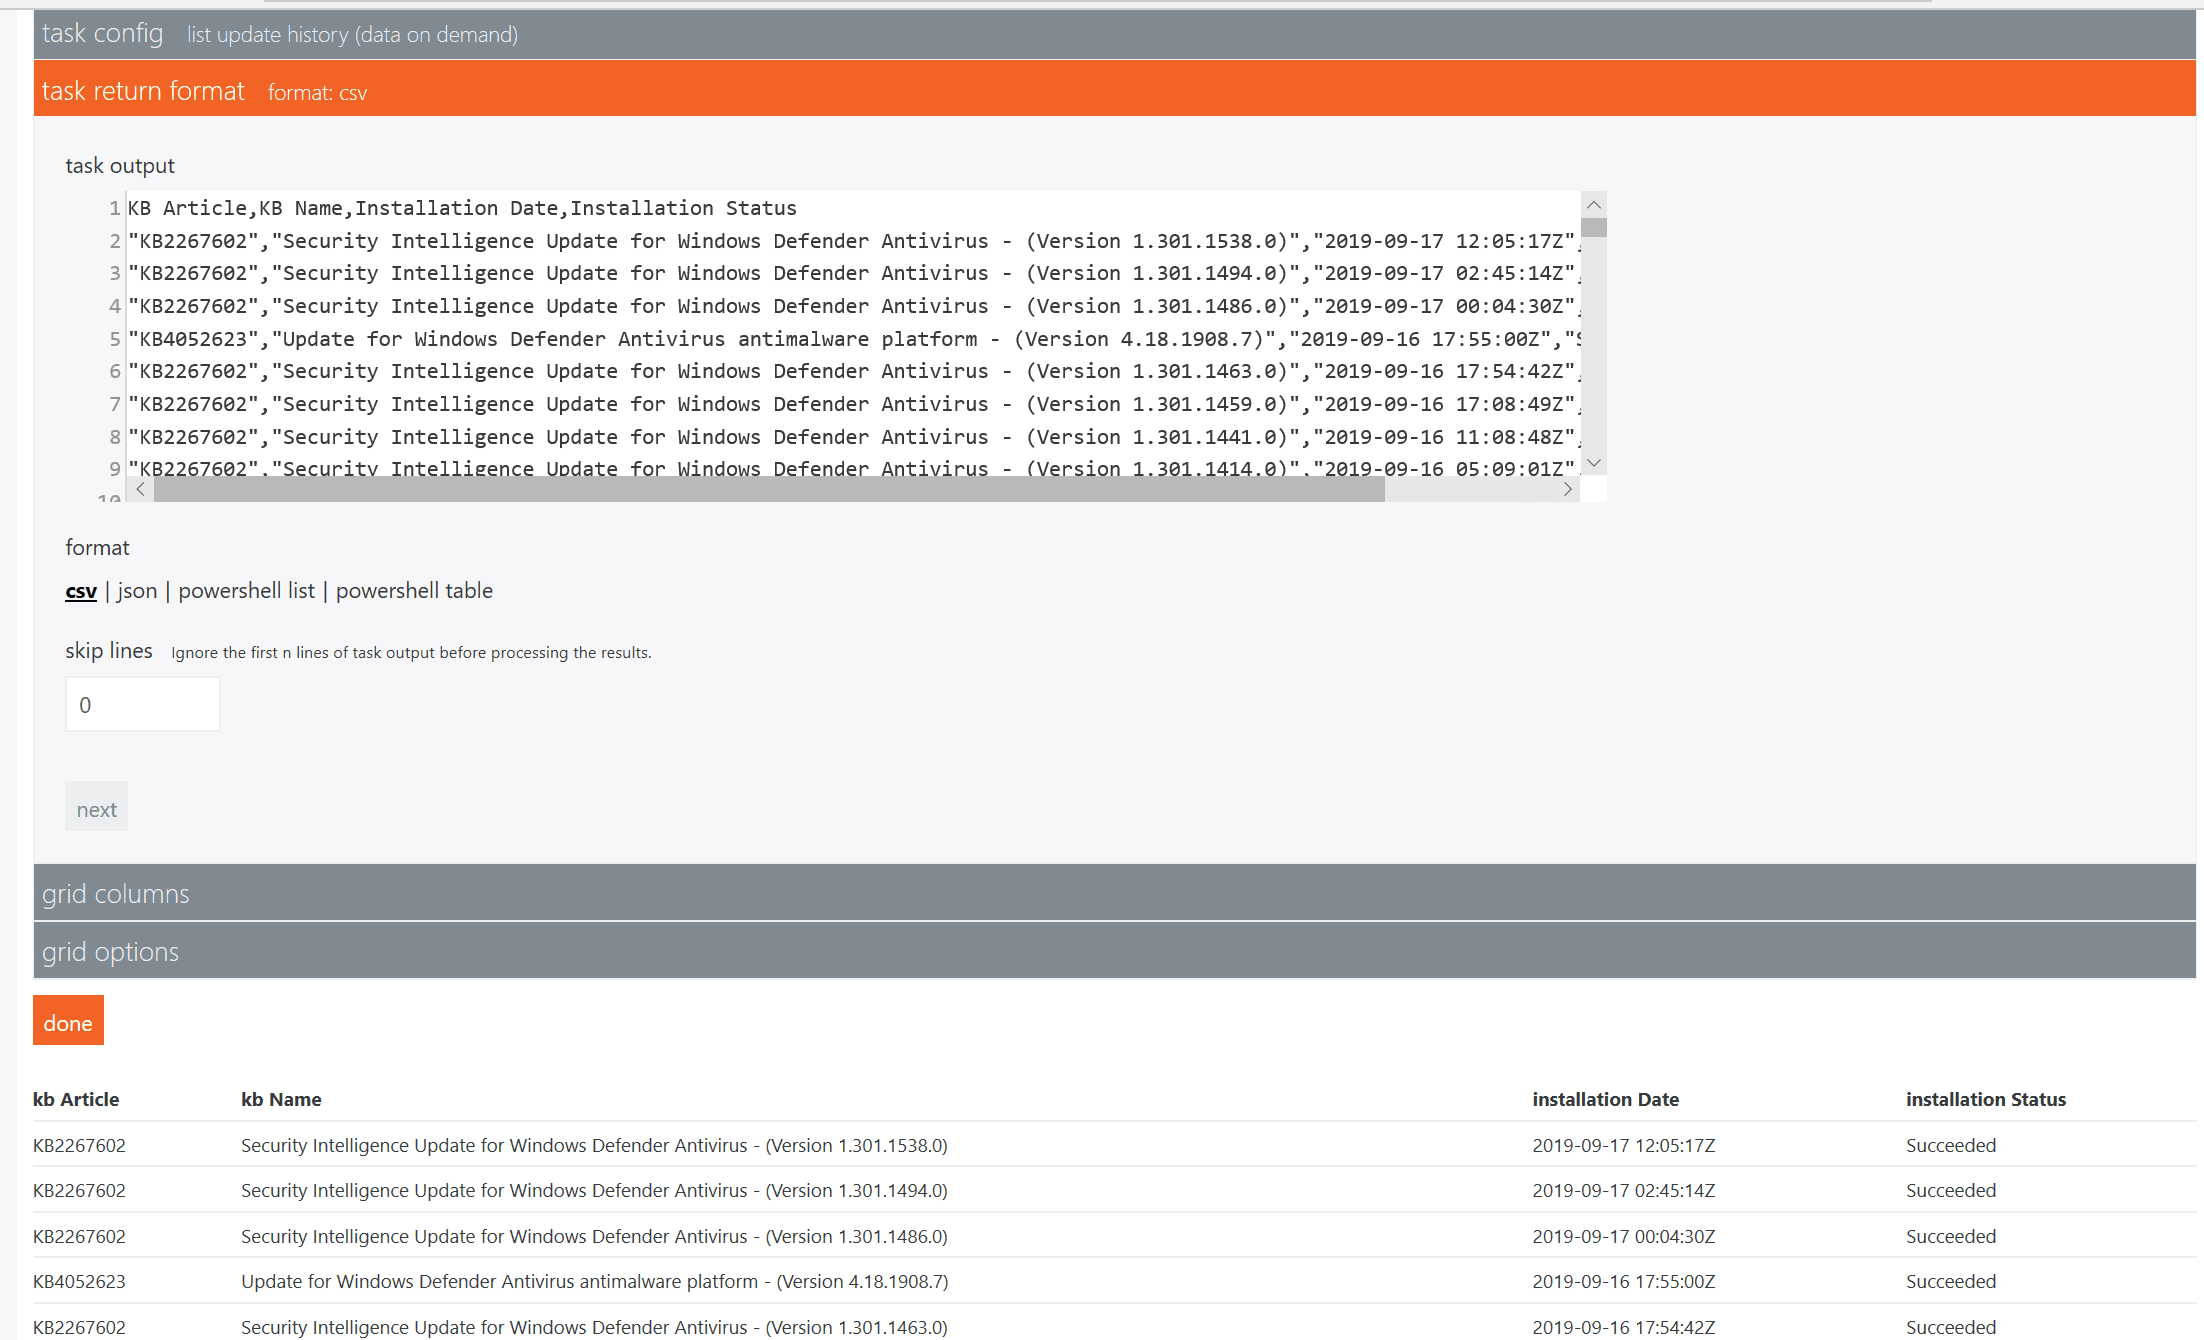
Under “task return format” you have options to choose which format you want to display the data in. I will select “CSV” as that is the best format to display my data as seen from the preview below.
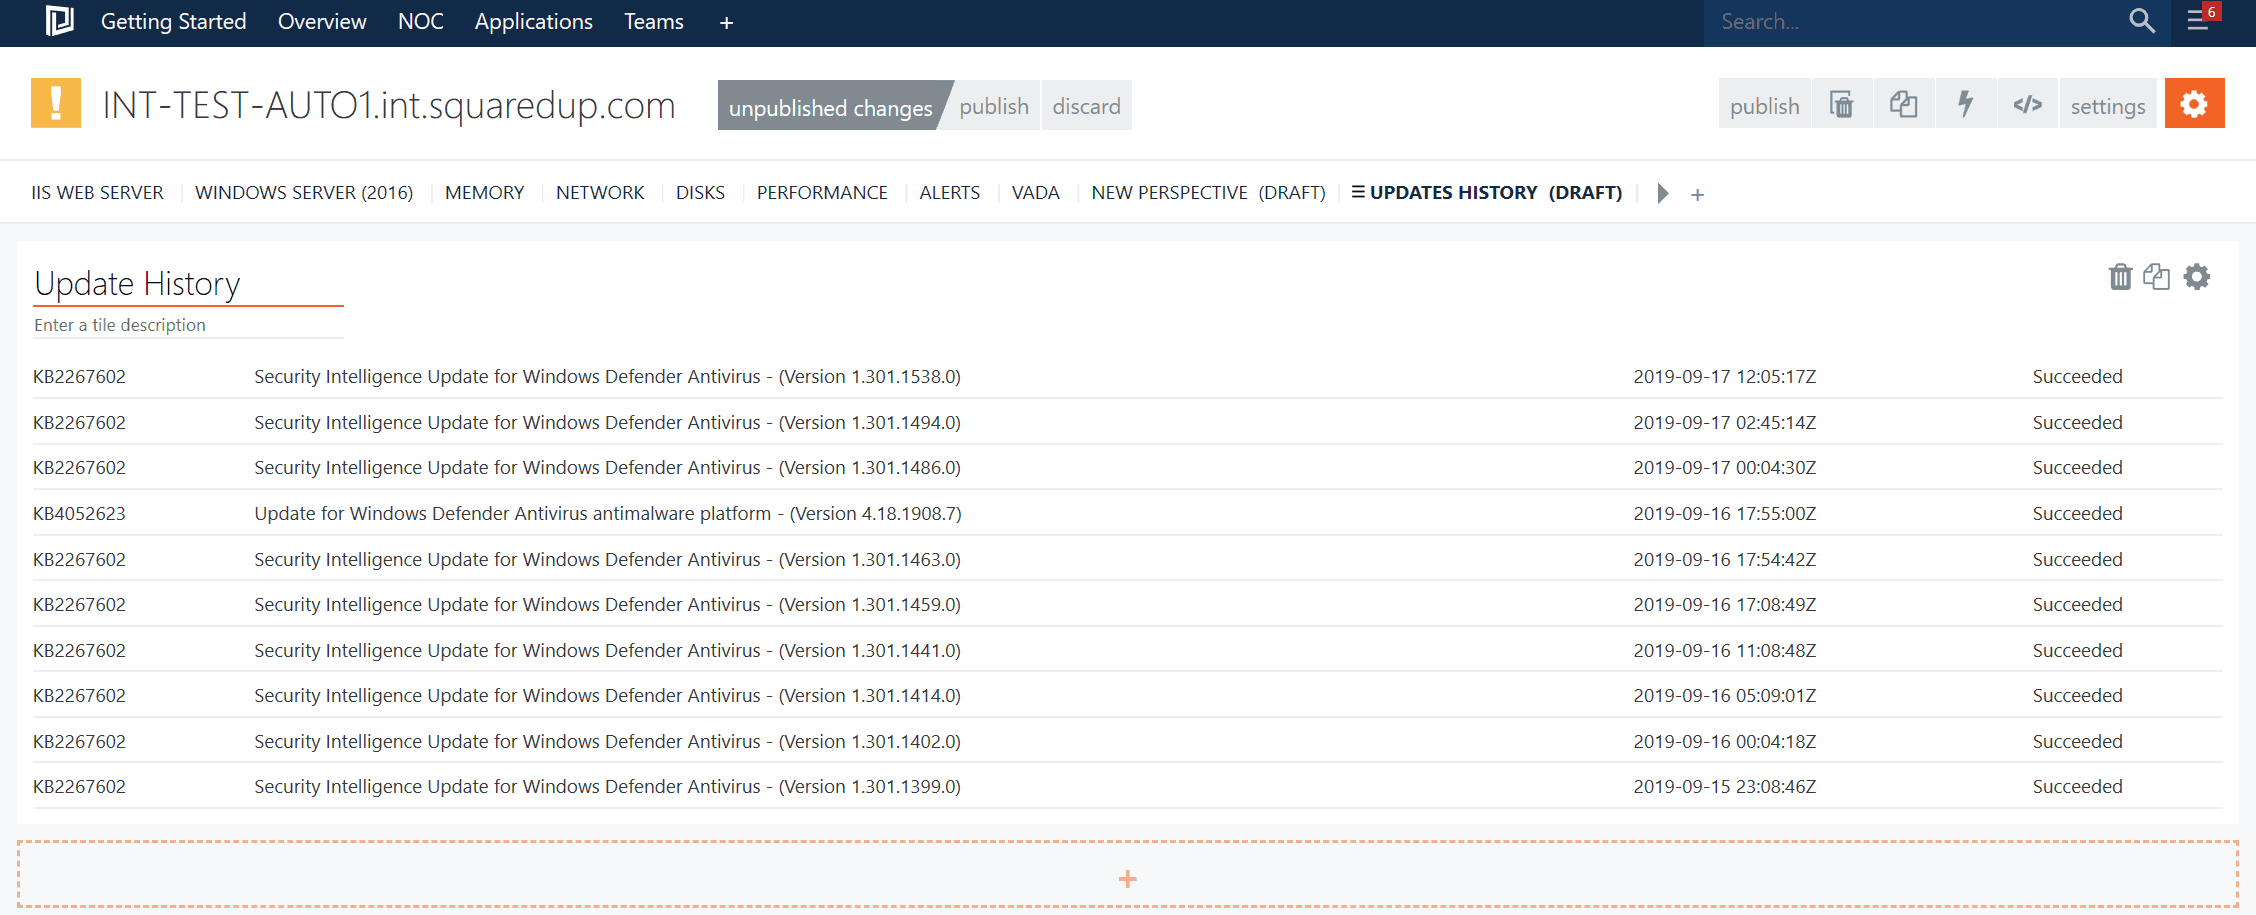
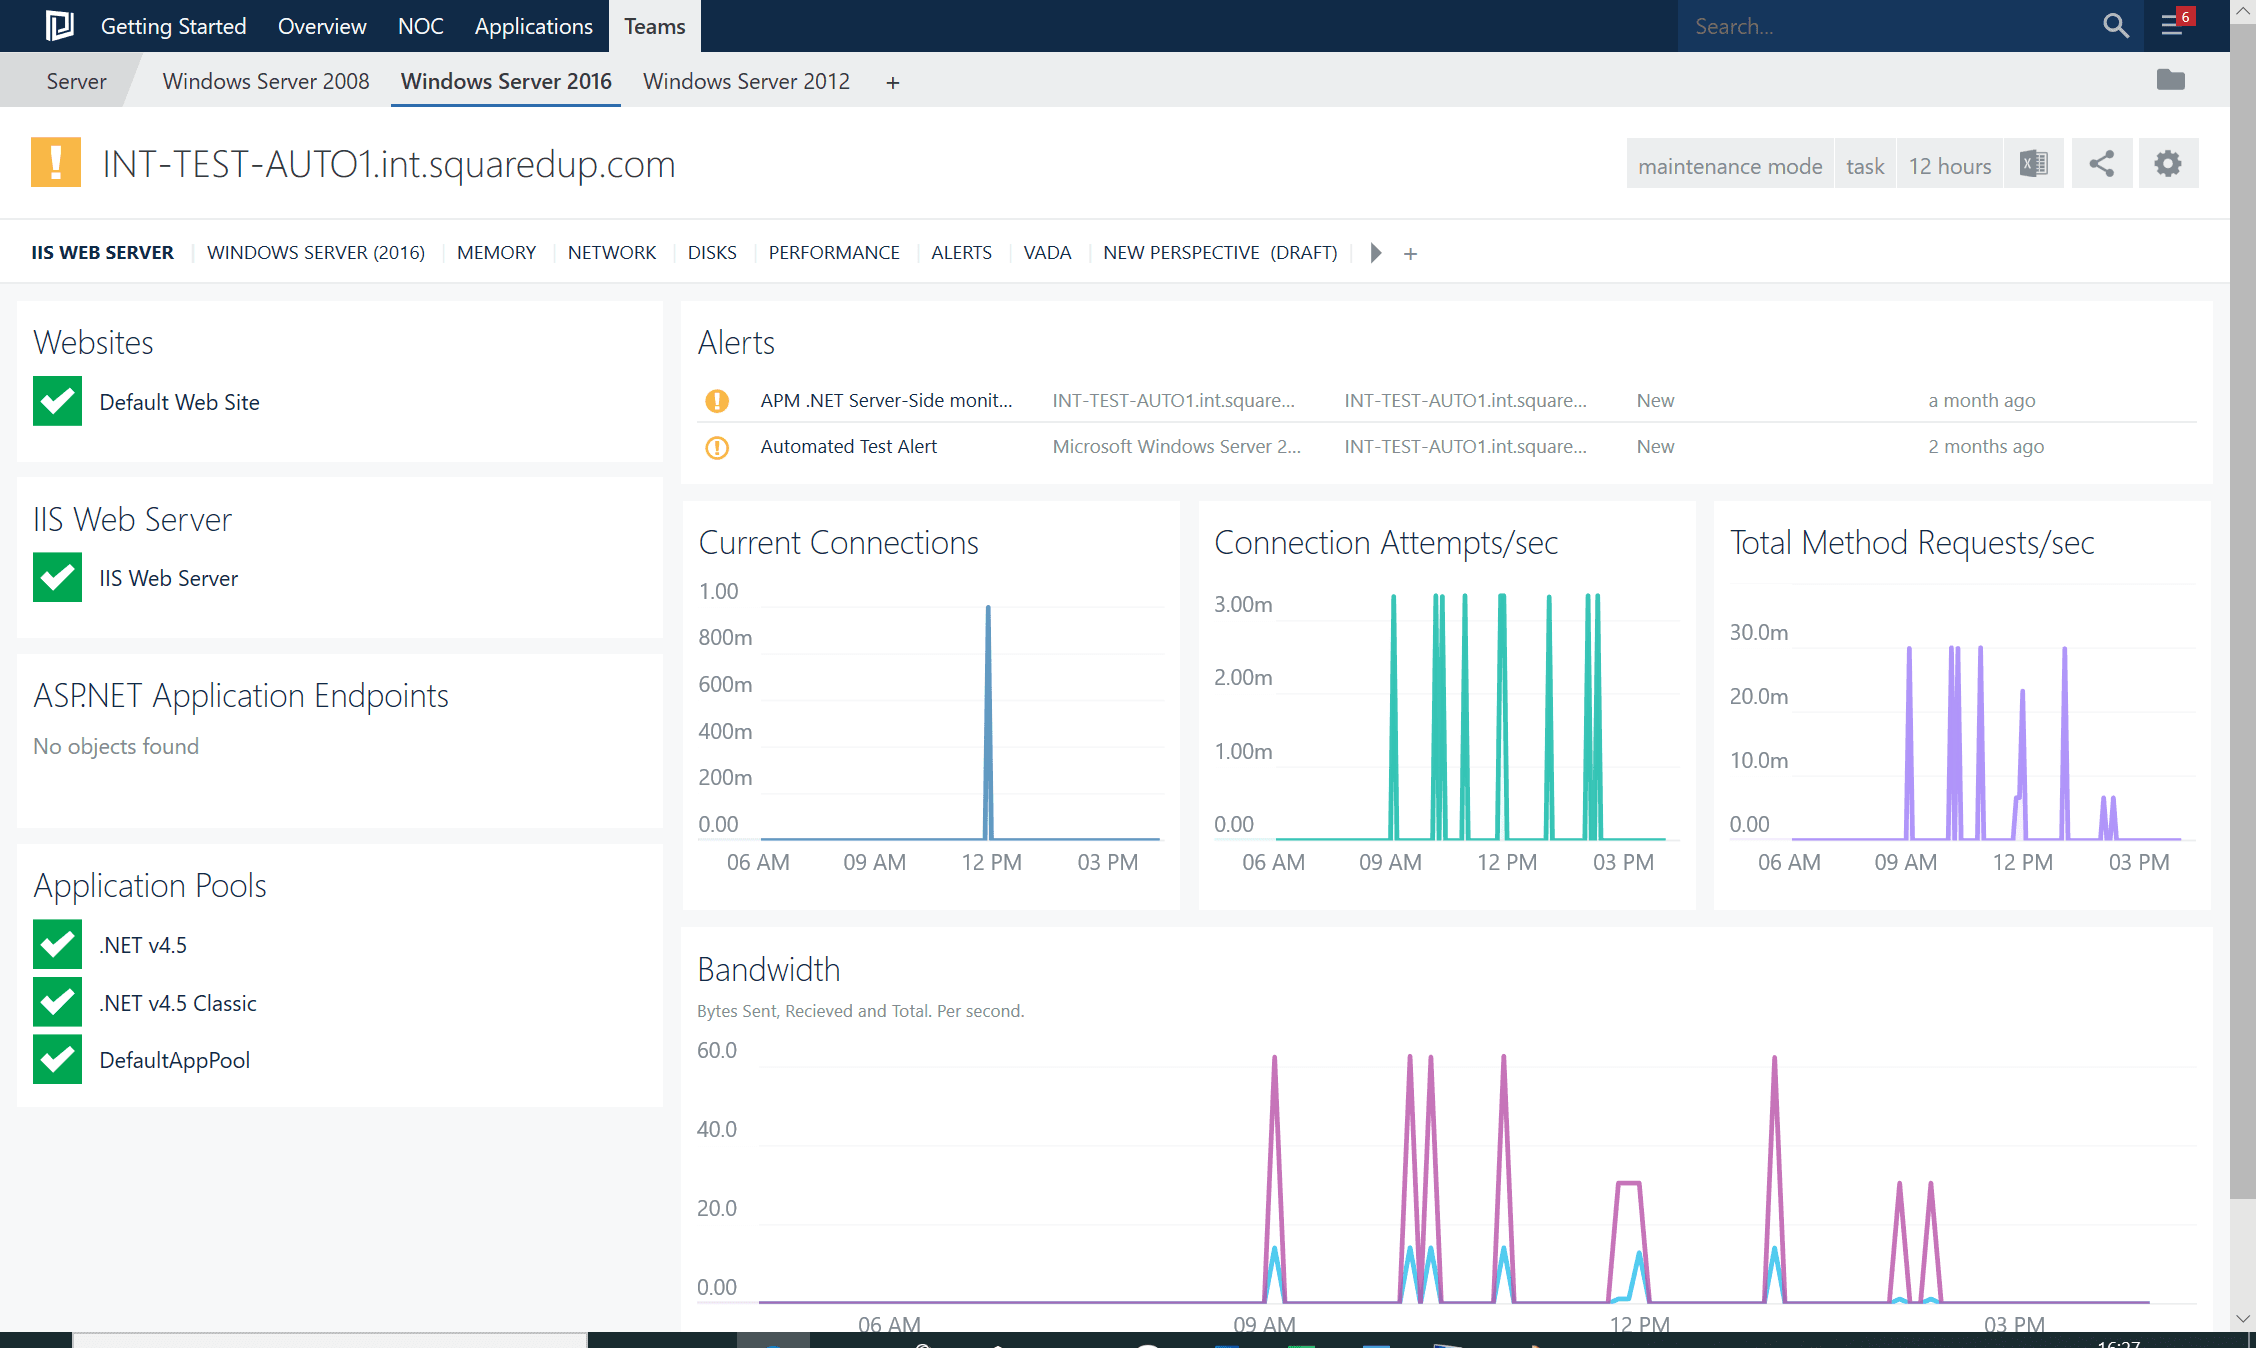
Perfect! Looks nice and tidy. Now one last thing to check is whether this perspective does indeed appear on all the servers like I intended. Let’s select a different server and see if that works.
Browsing into a different server (xxx.xxx.AUTO2):
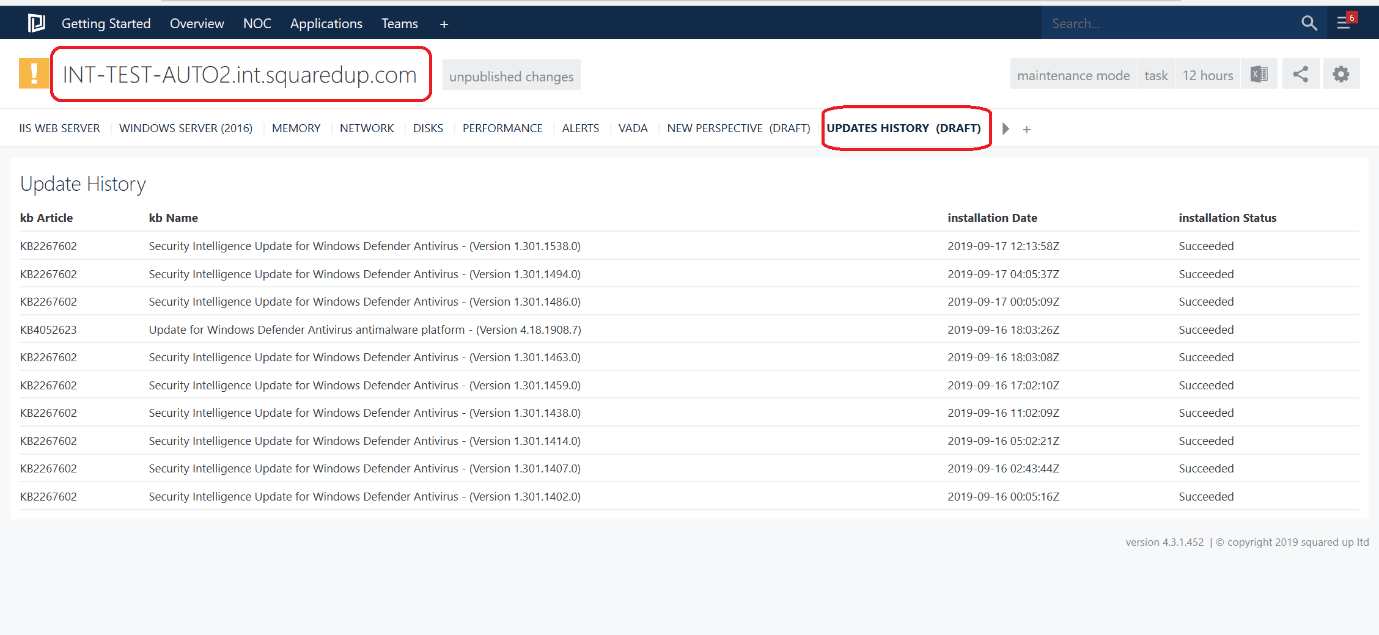
And indeed! I can see it now on all the servers. Mission accomplished!
As you can imagine, the use cases of this are only limited by the number of scripts you can write (read: infinite). You can also obviously have more than one tile in there, and so see results of more than one tasks on the same page.
Hope this gives you ideas on how you can visualise your SCOM task results with SquaredUp and use your PowerShell scripts and SCOM tasks to the fullest!