SquaredUp logo
  • Product
    • Community Edition
      Dashboard any data for free
    • Azure Edition
      Take control of Azure costs and performance
    • SCOM Edition
      Unlock insights from Microsoft SCOM
    • Compare Editions
    • Integrations
      Bring together data from anywhere
    • Dashboard Gallery
      Find inspiration and real-life dashboard use cases
  • Pricing
  • Resources
    • Blog
      Discover tips, tricks, news, and more
    • Learn
      Master SCOM and Azure Monitor with help from our experts
    • Webinars and Events
      Sign up for the next event or watch a replay on-demand
    • Downloads
      Download the latest releases, tools, scripts, and more
    • Datasheets
      Get concise SquaredUp overviews to share with the team
    • SCOMathon
      The hub for all things SCOM
  • Support
    • Support Portal
      Search for answers or submit a request to our experts
    • Community Answers
      Connect with a community of experts to ask questions and find answers
  • Company
    • Company
      Find out more about SquaredUp’s vision, people, and values
    • Careers
      Join our growing team – we’re hiring!
    • Customers
      Learn how our customers are taming complex IT landscapes
  • Download now
  • Dashboard Fridays
  • PowerShell
  • VMware
  • Donut
  • Grid / Table
  • Performance
  • Status
  • IT
  • Virtualization
Dashboard Gallery

VMware Status Dashboard

This VMware status dashboard, built in SquaredUp with the easy-to-use PowerShell tile, surfaces data from vCenter for Hosts and VM to provide a Virtualization Administrator the information they need at a glance.

Shawn Williams , SquaredUp
How do I get it?

Challenge

Virtualization Administrators generally interact with ESX via vCenter or the command line. With either option, sharing information can be troublesome because the data is not timely or is visually unappealing.

We wanted to build a VMware status dashboard to surface information from a VMware virtualization stack in real-time, make it visually appealing, and make sure it doesn’t require any significant investment by the Virtualization Administrator to maintain.

Solution

Dashboard Server from SquaredUp solves a significant problem for VM Administrators by helping them deliver information with a tool they already know: PowerCLI.

By leveraging the PowerShell PowerCLI modules, VM Administrators can quickly share information with their customers or managers. This sample, VMware status dashboard demonstrates how quickly and easily Administrators can pull data out of vCenter and display it securely and effortlessly, using SquaredUp’s PowerShell tile.

Dashboard walk-through

The dashboard contains data from the vCenter host and VM objects. The tiles are mixed visually for display and impact purposes. The purpose behind this dashboard is to provide a starting point for the Virtualization administrator to customize the dashboard for their specific use-case. For example, the dashboard could be tailored to show environment statistics for management or focused on one particular application or cluster.

VMWare Status Dashboard in SquaredUp
The tile numbers for the VMWare sample dashboard
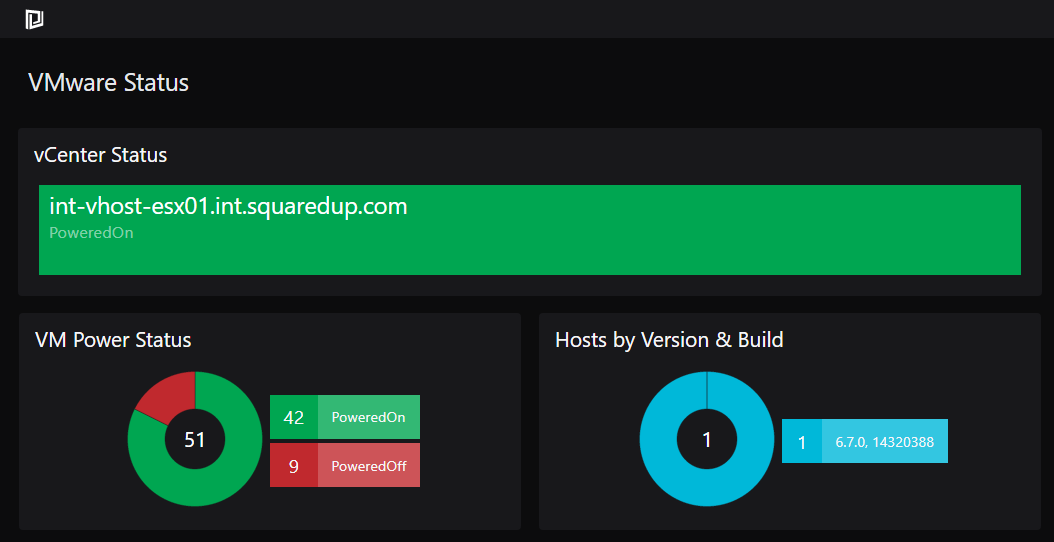
  1. This PowerShell Status Block represents a binary value for the power state for the vCenter server. The Status Block was chosen because of its visual impact if a critical condition was to occur.
  1. The PowerShell Donut summarizes the power state for all the VMs reporting to a vCenter Server. It was essential to use the Donut tile because it provides a quick count of each state and a total count of all VMs reporting to the vCenter server.
  2. The PowerShell Donut summarizes the different versions and build numbers that make up a virtualization landscape. Since most virtualizations are upgraded over time or when resources become available, this metric assists the Admin by showing how many total hosts are available and their current version and build number.
VCenter status, VM power status, and hosts by version & build dashboard tiles 1 to 3
Tiles 1 – 3
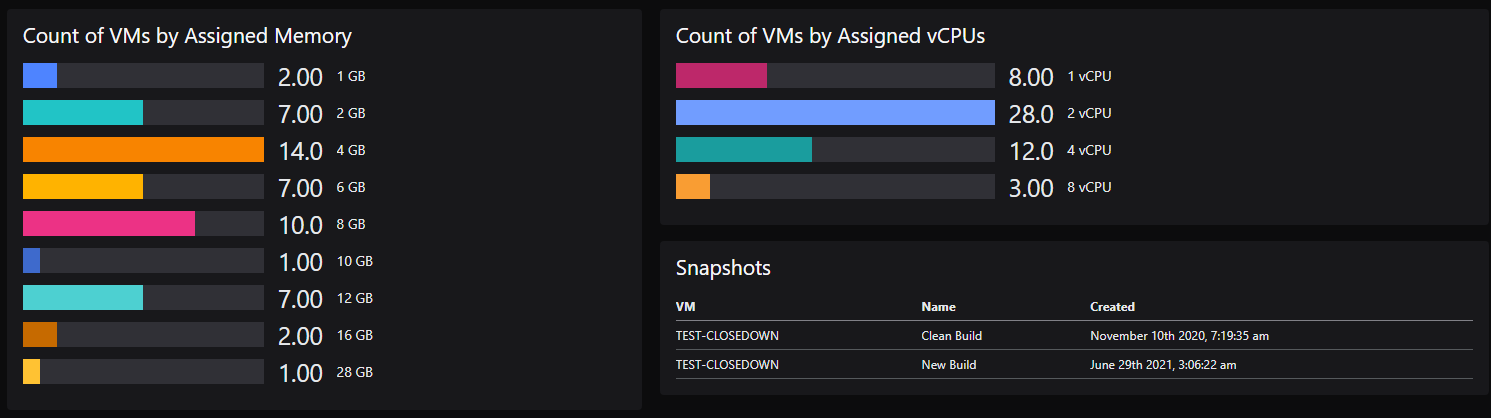
  1. The PowerShell Bar Graph summarizes how many servers have a specific amount of memory. This metric is vital for a virtualization admin when managing limited resources. The sudden appearance of a large VM could throw an entire cluster into chaos.
  1. The PowerShell Bar Graph summarizes how many servers have a specific amount of vCPUs. This metric is necessary to monitor how vCPUs are allocated to prevent any processor over-allocations.
  1. The PowerShell Grid lists all the current snapshots. Since snapshots taken by third-party software may not appear in the Snapshot Manager, this tile checks for snapshots via the command-line to help an admin keep things tidy. And as any Virtualization Admin knows, snapshots are not backups.
Count of VMs by assigned memory, assigned vCPUs, and Snapshots dashboard tiles 4 to 6
Tiles 4 – 6
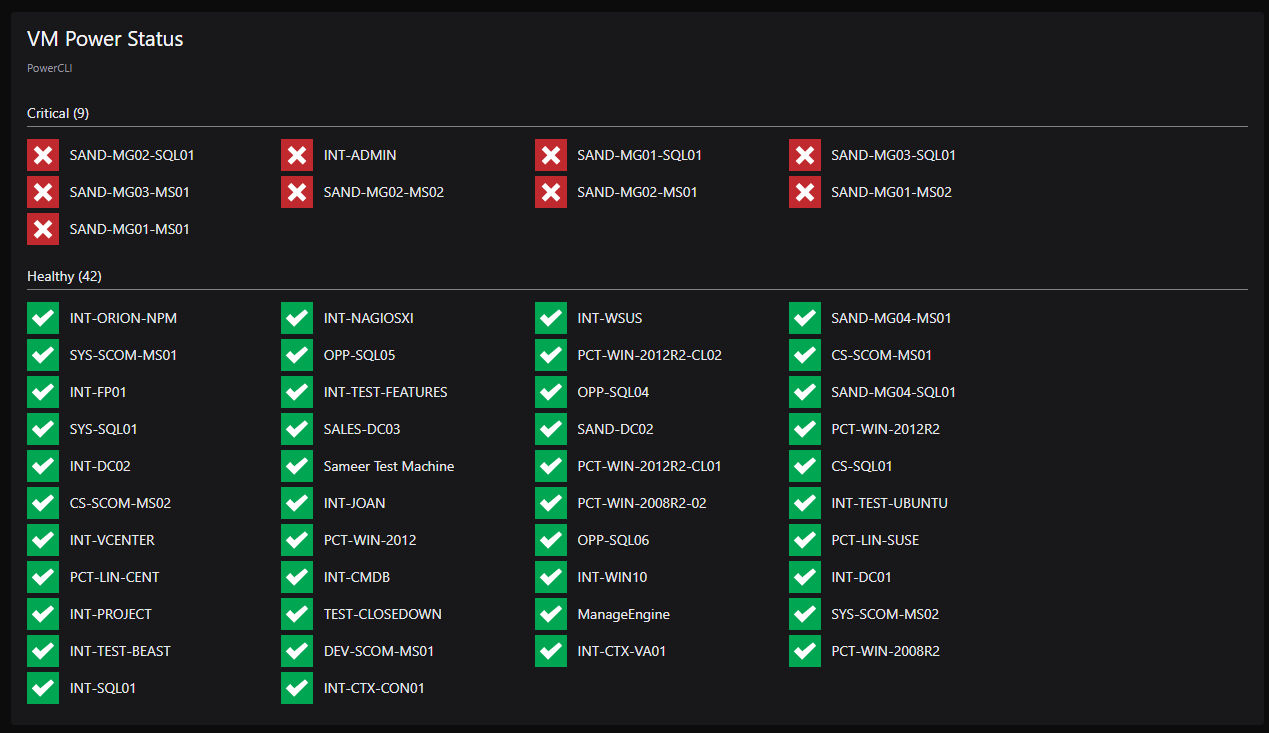
  1. The PowerShell Status Icon lists all of the VMs hosted by this vCenter instance showing their power status (on/off). While not generally needed by a VM Admin, this would make an excellent addition to a customer-facing dashboard.
VM power status dashboard tile - 7
Tile 7
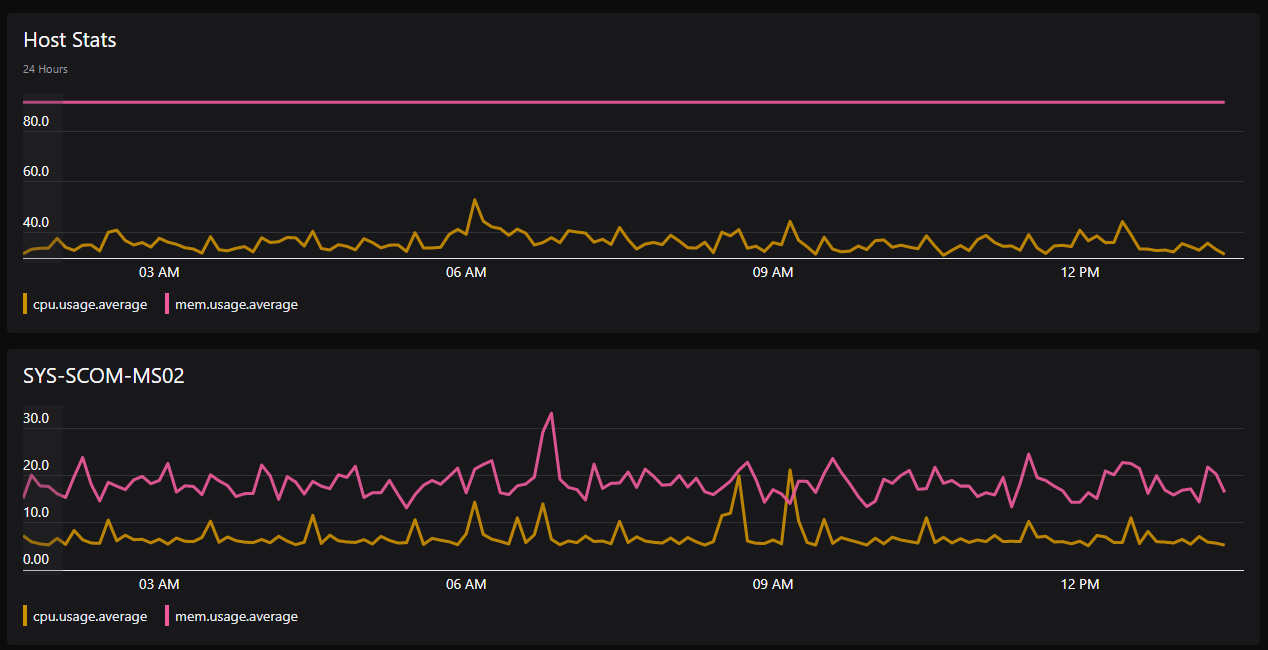
  1. The PowerShell Line Graph displays the average CPU and Memory statistics for a single host. This tile would need to be tweaked in a shop with significantly more hosts to display these values by something relevant to the Virtualization admin.
  1. The PowerShell Line Graph displays the average CPU and Memory for a single VM. This tile demonstrates that it is possible to show values for any object at any layer of the ESX stack.
VMware host stats dashboard tiles - 8 and 9
Tiles 8 and 9
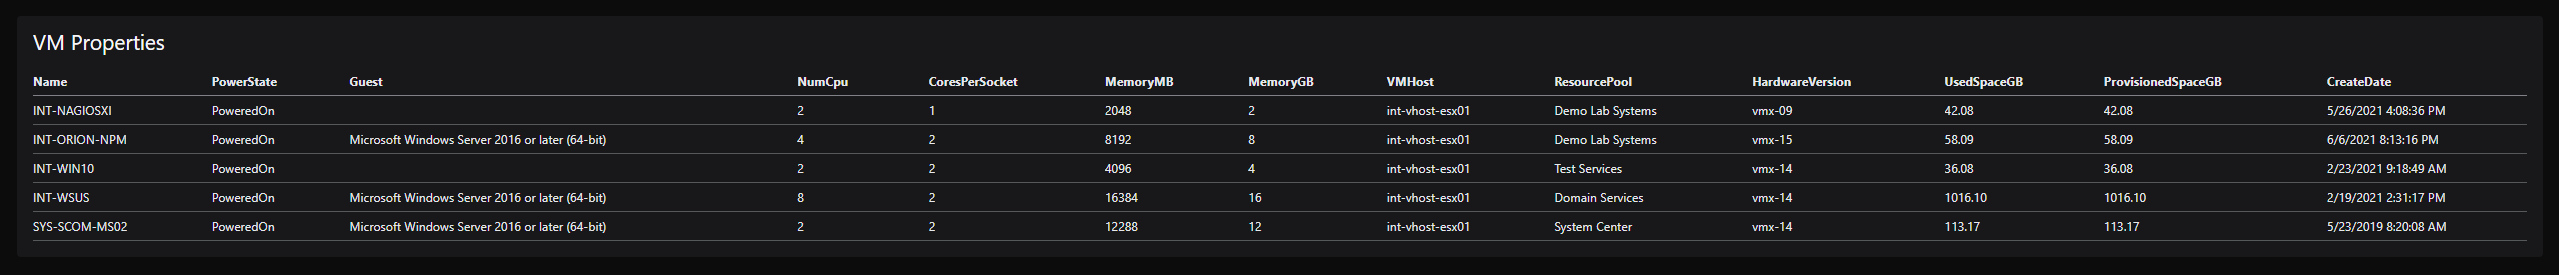
  1. The PowerShell Grid displays a number of different values from the vCenter host. The items shown are representative of things that could be of use for a virtualization admin, particularly when interacting with ESX via the command. For example, the Hardware Version is essential when troubleshooting, and the Resource Pool name assists the administrator when attempting to locate a VM.
VM properties dashboard tile - 10
Tile 10

How do I import and configure this dashboard

  1. Ensure you’re using Dashboard Server v5.4 or above.

    Already a SquaredUp customer?

    Get the latest version of SCOM Edition

    New to SquaredUp?

    Try it for free

  2. Install VMware’s PowerCLI on the server hosting Dashboard Server SCOM Edition.

  3. Create a PowerShell profile in Dashboard Server with the following settings:

    Name

    VMwarePowerCLI

    Note: The name is case-sensitive and must be entered exactly as given here for the tiles to recognize the profile automatically. If you name it differently, you will need to select the profile manually for each tile on the dashboard.

    Description (optional) Sets up the PowerShell Profile and connects to a vCenter Server
    Script

    Copy and paste the contents of the PowerShell script below.

    Note: You need to change the values for the parameters $User, $Pass, $vCenter, $VM and $vmHost according to the description in the script.

    ClosedPowerShell profile script
    Copy
    ###############################################################################
    # Load up our Custom Profile
    ###############################################################################
    $User = "RunAs Account UserName"
    $Pass = "RunAs Account Password"

    #The URL to our vCenter Server
    $vCenter = "FQDN of your vCenter Server"


    ###############################################################################
    # Before a connection to vCenter is initiated, check some specific settings
    # We mostly care about ignoring invalid certificate warnings and depreciated warnings
    # Wrap the settings change in a Try-Catch block to prevent any unhandled exception messages
    # This prevents error messages when multiple tiles attempt (and fail) to write to the PowerCLI_Settings.xml file at the same time
    ###############################################################################
    $lConfig = Get-PowerCLIConfiguration -Scope User
    If ($lConfig.InvalidCertificateAction -ne'Ignore') {
        try {
            Set-PowerCLIConfiguration -InvalidCertificateAction Ignore -Confirm:$false -ErrorAction SilentlyContinue
        }
        Catch {
            #$Error[0]
        }
    }

    If ($lConfig.DisplayDeprecationWarnings -ne'False') {
        try {
            Set-PowerCLIConfiguration -DisplayDeprecationWarnings $false -Confirm:$false -ErrorAction SilentlyContinue | Out-Null
        }
        Catch {
            #Error[0]
        }
    }

    ###############################################################################
    # Conenct to vCenter
    ###############################################################################
    $serverlist = $global:DefaultVIServer
    while ($serverlist.IsConnected -ne"True") {
        try{
            Connect-VIServer -Server $vCenter -User $User -Password $Pass -ErrorAction SilentlyContinue
        }
        catch {        
        }
        $serverlist = $global:DefaultVIServer
    }

    ###############################################################################
    # Page Timeframe code
    ###############################################################################
    $finish = [DateTime]::Now
    switch ($timeFrame) {
        "last1Hour" { $start = $finish.Addhours(-1); $MaxSamples = 150; }
        "last12Hours" { $start = $finish.Addhours(-12); $MaxSamples = 300; }
        "last24Hours" { $start = $finish.Addhours(-24); $MaxSamples = 400; }
        "last7Days" { $start = $finish.AddDays(-7); $MaxSamples = 500; }
        "last30Days" { $start = $finish.AddDays(-30); $MaxSamples = 600; }
        "last3Months" { $start = $finish.AddMonths(-3); $MaxSamples = 700; }
        "last6Months" { $start = $finish.AddMonths(-6); $MaxSamples = 800; }
        "last12Months" { $start = $finish.AddMonths(-12); $MaxSamples = 900; }
    }

    ###############################################################################
    # Some variables to resuse
    ###############################################################################
    $vm = "Insert the Name of a VM here"
    $vmHost = Get-VMHost -Name "FQDN of your vCenter Host"
    ClosedHow to create a PowerShell profile
    1. From the top right hand menu ☰ click system.
    2. Go to the PowerShell tab.
    3. Click add new profile.
    4. Enter a name and a description for the new profile.
    5. Enter the profile script.
    6. Click add profile.
      The profile is now saved and can be used in a PowerShell tile.
  4. Create a Run As account in Dashboard Server with the following settings:

    Name VMware_PowerCLI
    Username and password Enter the credentials you want to use for this Run As account
    ClosedHow to create a Run As account
    1. From the top right hand menu ☰ click system.

    2. Go to the PowerShell tab.

    3. In the Run As section, click on the + button to add a new Run As.

    4. Enter a name and a description for your new Run As.

      Note: Once you have saved the Run As account, you can’t change its name anymore. You can always change the description.

    5. Enter the user credentials you want to use for this Run As account.

      Do not use your own or anyone’s personal user account for Run As accounts. Instead, create a new account that is not used by a specific person (a “service account”), but only used for running PowerShell scripts. Consider the permissions of this service account carefully.

      Required permissions for service accounts:

      The service account you use for Run As must have at least the following permission:

      • Allow log on locally

      ClosedNote for Run As accounts if you are using any other application pool identity than NetworkService

      If you don’t use the default NetworkService as your application pool identity, you might see the following error message when using Run As accounts: A required privilege is not held by the client.

      In this case you need to add the application pool identity to the following policies:

      • Adjust memory quotas for a process

      • Replace a process-level token (you need to reboot the server for this policy to take effect)

      ClosedWhy shouldn’t you use user accounts for Run As accounts?

      The user credentials you enter for the Run As account are used to run all PowerShell scripts in tiles that use the Run As account. Once created, your Run As account can be used by other Dashboard Server administrators to run their scripts. By using your or any user’s credentials, you lose control over which scripts are executed in the name of this user which can cause privacy issues. In addition to that, users often have more rights than a script would need. By using a user account with extensive permissions, scripts that use the Run As can exploit those permissions.

    6. Click save to save the new Run As account.

      The Run As account is now available in PowerShell tiles and can be used to execute scripts.

  5. Download and import this dashboard pack.

    ClosedHow to import a dashboard pack
    1. Download the dashboard pack zip file for the dashboard pack you wish to import.

      There may be additional steps before or after the import to get the dashboard working in your environment.

    2. In SCOM Edition go to the top right hand menu ☰ > Import Dashboard Packs and drag the zip file into the Manual Import box.


    3. The dashboard pack is imported and if the pack contains top-level dashboards, these will automatically appear in the navigation bar, usually in a folder called ‘Community Dashboards’ for dashboard packs from the SquaredUp Community. If the dashboard pack also contains perspectives (see Working with perspectives), then you’ll see these when you drilldown to the relevant object.

    4. Carry out any additional steps required to make the dashboard work in your environment. These steps will be described on the download page for each dashboard. For example, you may need to create the correctly named Web API provider, create a PowerShell profile, or edit tile scopes.

    5. Edit the imported dashboard as required.

    Download zip for SquaredUp Azure Edition
    Download zip for SquaredUp SCOM Edition
    Download zip for SquaredUp Community Edition
  6. Publish the dashboard.

    ClosedHow to publish a dashboard

    A newly created dashboard will not be visible to others until you publish it. If you made changes to an existing dashboard, the changes will only be visible to others after you published the dashboard again.

    You can identify a dashboard that has not been published yet or has unpublished changes by the unpublished button at the top:

    When you click on the unpublished button, you’ll have two options:

    • Publish will make the dashboard or changes visible to others.
      Note: A newly created dashboard will appear on the menu where you created it. To move the dashboard to a different place on the navigation bar see How to edit the Navigation Bar.

    • Discard will delete your draft dashboard if it has never been published or, if you made changes to an already published dashboard, discard the changes.

    Publishing dashboards to different audiences

    Find out how to publish dashboards to a subset of users using Team Folders or visible to anyone even unlicensed users with Open Access (Sharing Dashboards with anyone – Open Access).


GET STARTED TODAY

Zero to dashboard hero in 60 seconds

Start now with hundreds of customizable dashboards.

  • Sites
    • Support
    • Download
    • Community Answers
  • Quick Links
    • Webinars and Events
    • About Us
    • Careers
  • Small print
    • Privacy Policy
    • Terms and Conditions
    • Staying COVID-19 Secure
UKAPR 2022-APR 2023

© SquaredUp 2022