Exchange monitoring
The Smart Way to Monitor Exchange. You already have the data. Just add the dashboards.
Need to monitor Exchange?
Don't deploy yet another monitoring tool.
You might not realize it, but with hundreds of metrics and monitors, Microsoft System Center Operations Manager (SCOM) monitors all you need to keep on top of Exchange availability and performance.
Sure, the SCOM console is clunky, and your inbox is probably spammed with alerts, but that’s why we developed SquaredUp.
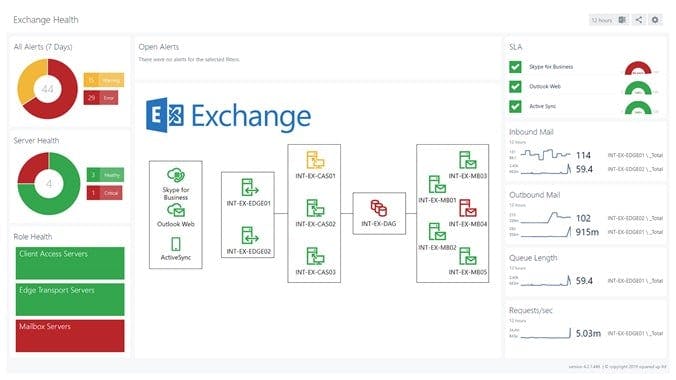
SquaredUp is the essential HTML5 dashboard for SCOM. It let's you take control of your Exchange monitoring and surface the metrics that matter in fully customizable, real-time views.
It's the smart way to monitor Exchange.
Exchange monitoring with Microsoft SCOM
Performance metrics
- Database: I/O Database Reads Average Latency (ms)
- Database: I/O Database Writes Average Latency (ms)
- Server: Transport Queue Database Size (MB)
- Server: EWS Response Time (ms)
- Server: Messages Received/sec
- Server: Messages Sent/sec
- Server: HTTP Proxy Failure Rate (%)
- Server: Queues by Type Count
- Server: Queue Length
- Server: SMTP Bytes Received/Sec
- Server: SMTP Bytes Sent/Sec
- Server: SMTP Connections (Current)
- Server: Store Messages Submitted/sec
Monitors
- Backup Host - Check Backup
- Mailbox - Last Any Backup
- Mailbox - Last Full Backup
- Check Active Preference
- Check DB Mounted
- External Aggregate Delivery Queue Length
- External Retry Remote Delivery Queue
- Internal Aggregate Delivery Queue Length
- Internal Retry Remote Delivery Queue
- Retry NonSMTP Delivery Queue Length
- Retry Mailbox Delivery Queue Length
- Submission Queue Length
- Unreachable Queue Length
You'll find many more monitors and rules available in the Exchange Management Pack
We know you're busy, and the last thing you want is a complicated setup process.
Good news – SquaredUp can be installed in 5 minutes, on any server, hassle-free. No new agents or configuration, just install the SquaredUp web application and go from zero to dashboard in a few clicks.
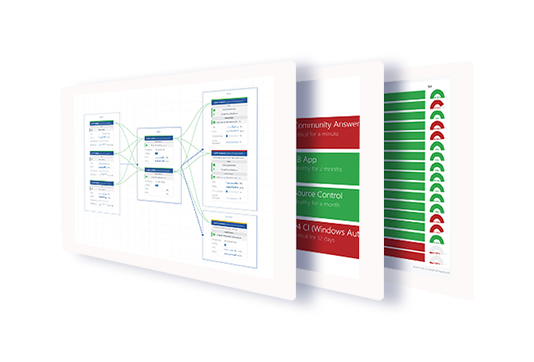
When things go slow, it’s not just the Exchange server performance that matters.
Is the virtualization host overloaded, the storage becoming a bottleneck, or client applications misbehaving?
With just a few clicks, our unique Visual Application Discovery and Analysis (VADA) technology leverages the SCOM agent to trace Exchange dependencies and pinpoint root causes.
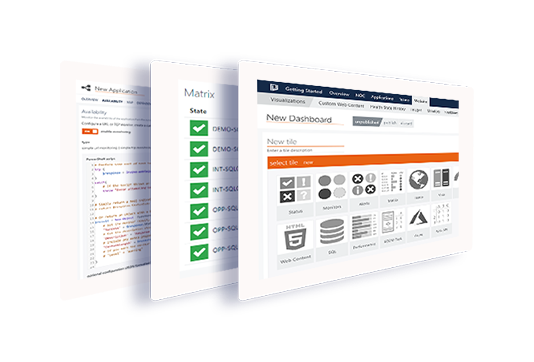
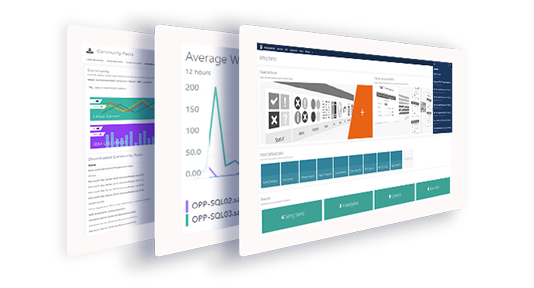
Take control of your SCOM monitoring data and make it work for you with our awesome Dashboard Designer.
Create stunning, intuitive dashboards and data visualisations perfectly tailored to your monitoring needs.
No clutter on your screens – only the information you need, presented in the most usable way.
Starting from $1,200 for 3 users
Unlimited
Dashboards
Unlimited
Servers & mailboxes
Unlimited
Monitoring
Trusted by leading enterprises worldwide


Try it now
We'd much rather let the product do the talking
Sign up for a fully featured 30-day free trial.