The smart way to dashboard Enterprise IT
Free, enterprise-scale dashboards straight out of the box. Expose your data without the fuss.

How much is your time worth?
This is an important question, and it goes hand in hand with: Why do you need Enterprise IT dashboards to start with? Generally, the benefit comes from quickly being able to spot trends, investigate problems and get a good overview of how your application is performing.
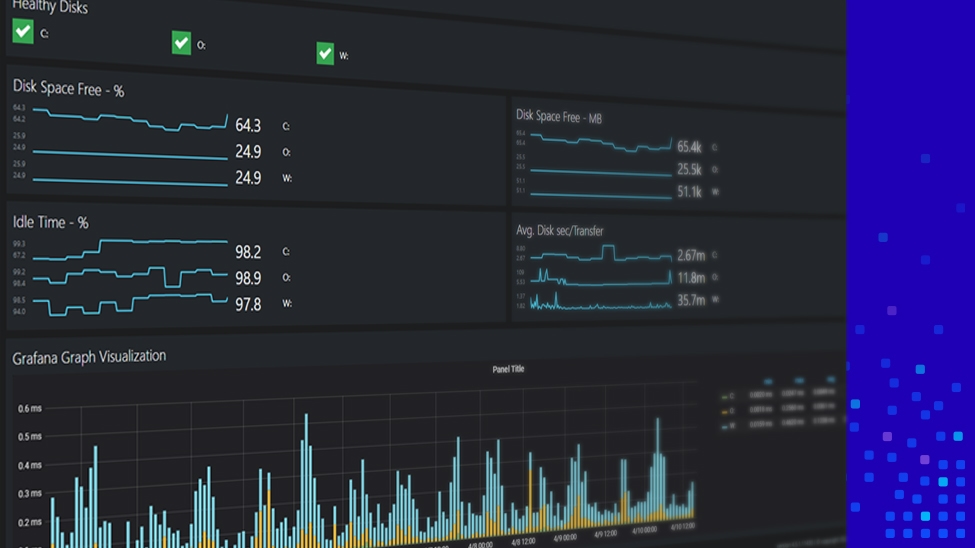
While a Grafana dashboard offers nice visualizations, if you have to spend weeks learning a new tool, building custom dashboards, getting to grips with the data and deciding what you need to surface, you have to ask yourself: Is your time better spent elsewhere?
Dashboard framework
Community Dashboard Server
- Range of pre-built templates means you can gain insights straight away
- Point-and-click configurations for integrations makes retrieving data simple
- Queries can be linked to an object to provide a dynamic and interactive experience
Grafana
- No default views – need to be custom-built
- Drill-through dashboards need to be specifically designed
- Custom KQL queries are required for dynamic dashboards
Powerful integrations
SquaredUp
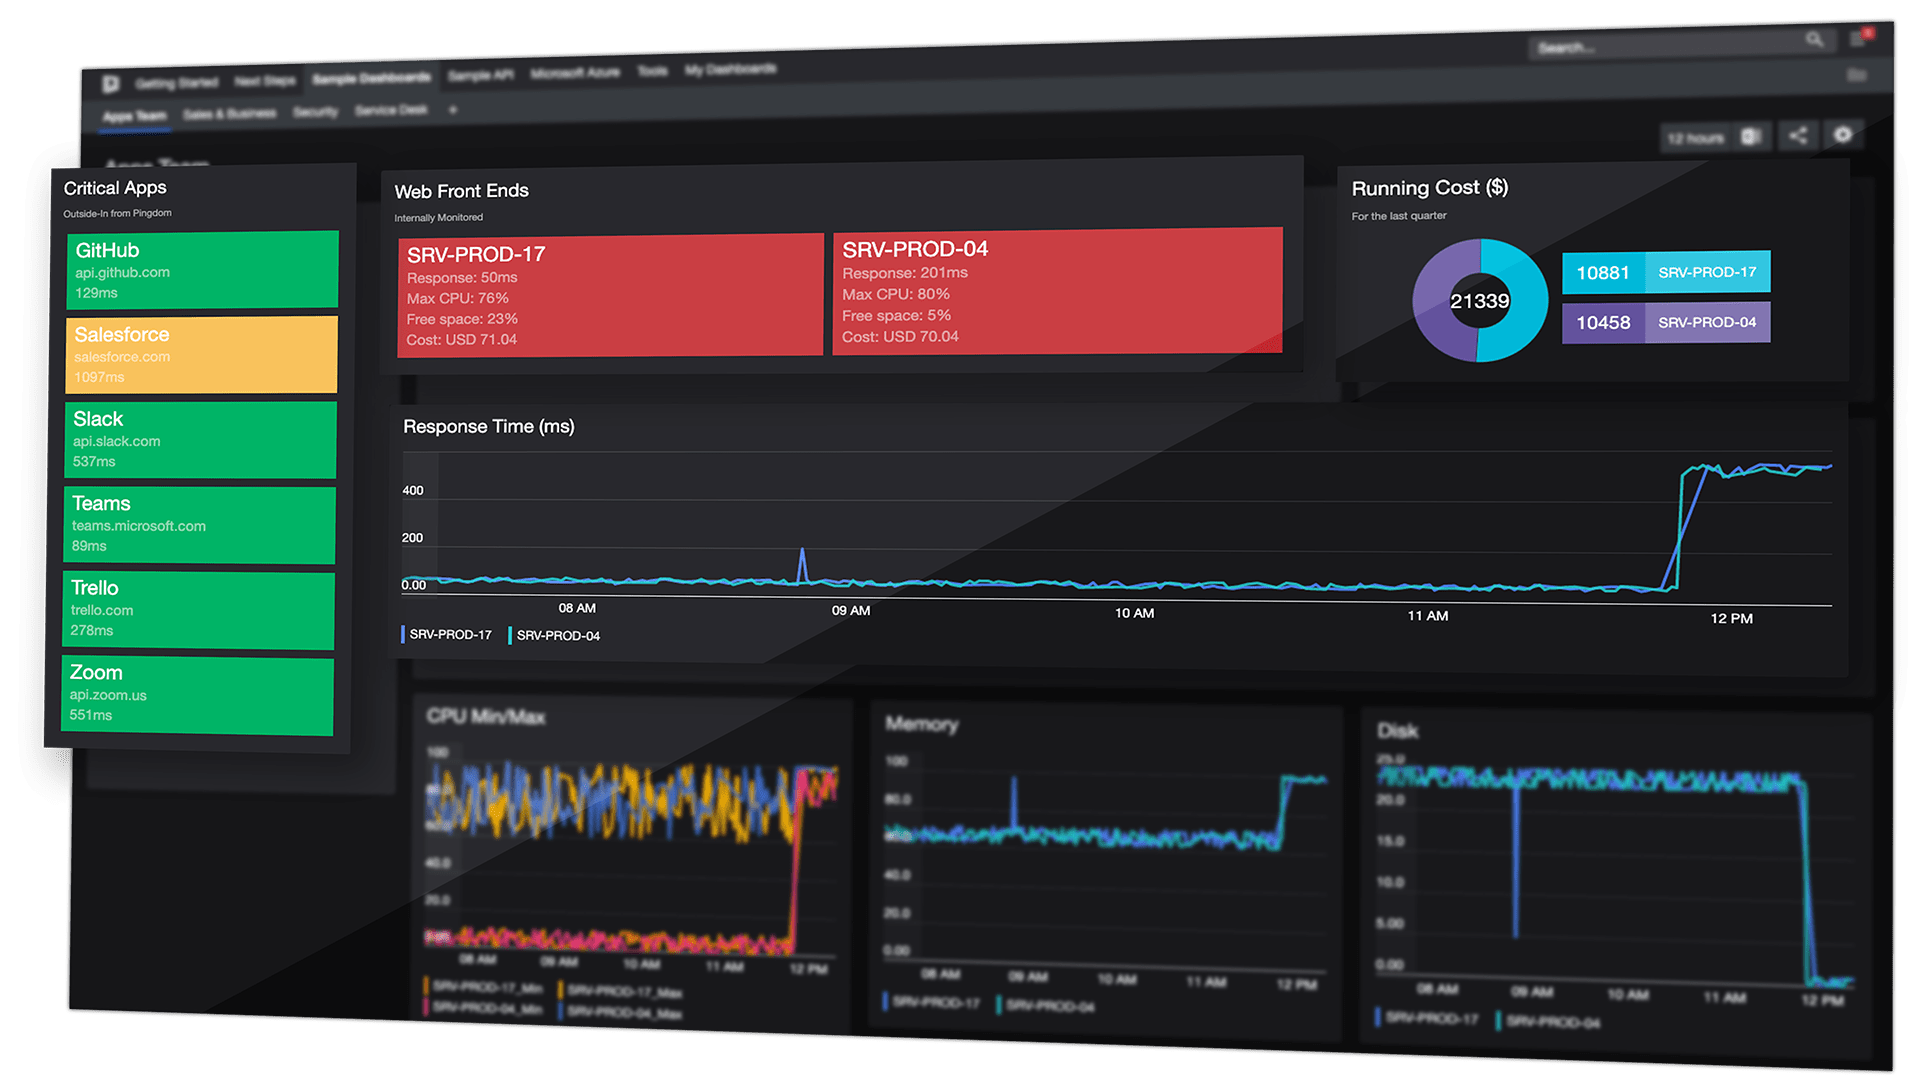
- Visualize detailed, real-time data from any application or data source, without having to know how to code
- Point-and-click integrations available with 100s of applications with the Web API, Elasticsearch and Azure Log Analytics tiles
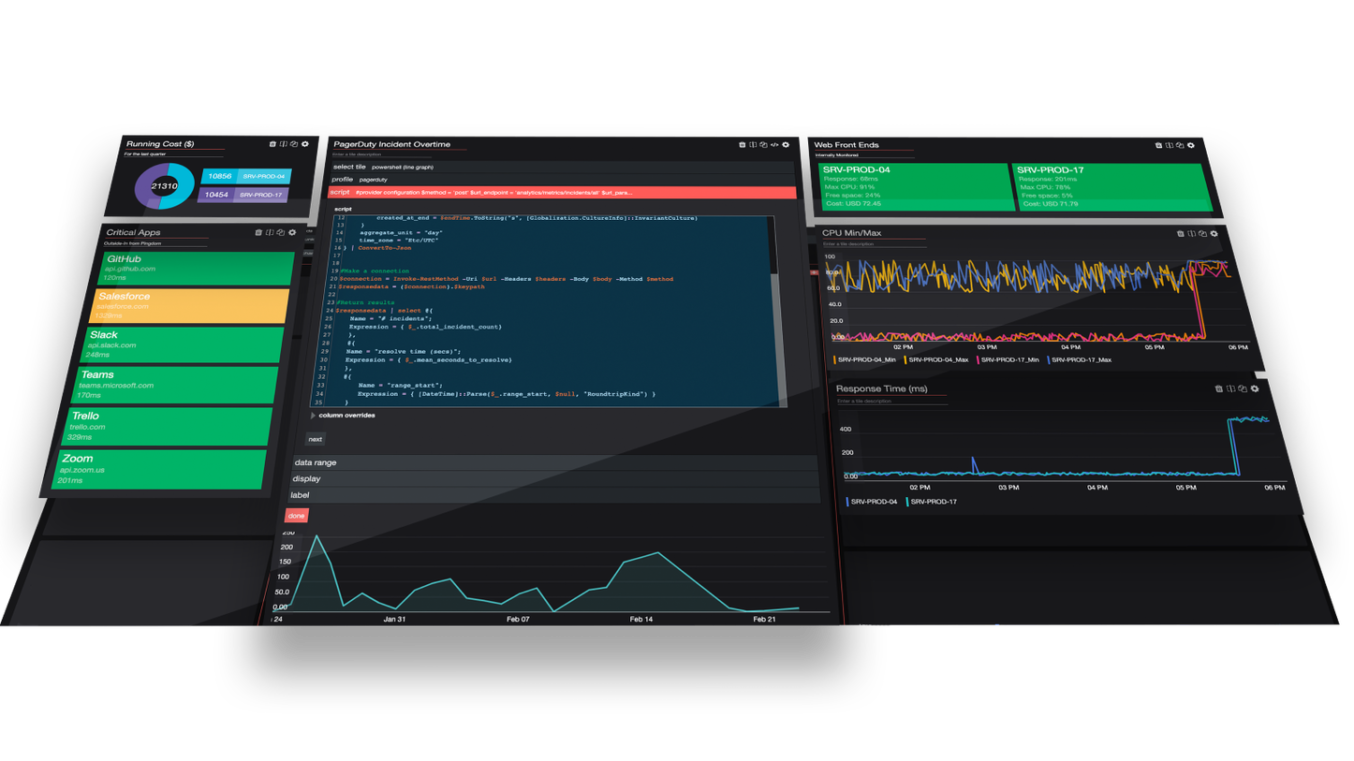
- Other powerful integrations available via PowerShell, SQL and more
Grafana
- Integrations available with 100s of applications
Dashboards for everyone
SquaredUp
- The joy of dashboarding can be shared more widely than just within developer teams. Anyone with some technical know-how can dashboard with Community Dashboard Server.
- Open Access – You don’t have to create an additional user. Share interactive dashboards with real-time visualizations via a link, with no login required. Now you can create unlimited dashboards for any team.
Grafana
- You can share a dashboard as a direct link or as a snapshot
A community of contributors
With a 3,000 strong community (who love to share their own dashboard creations) there’s always help at hand, no matter what you’re trying to dashboard. Check out our community driven Gallery pages for some inspiration and quick wins!
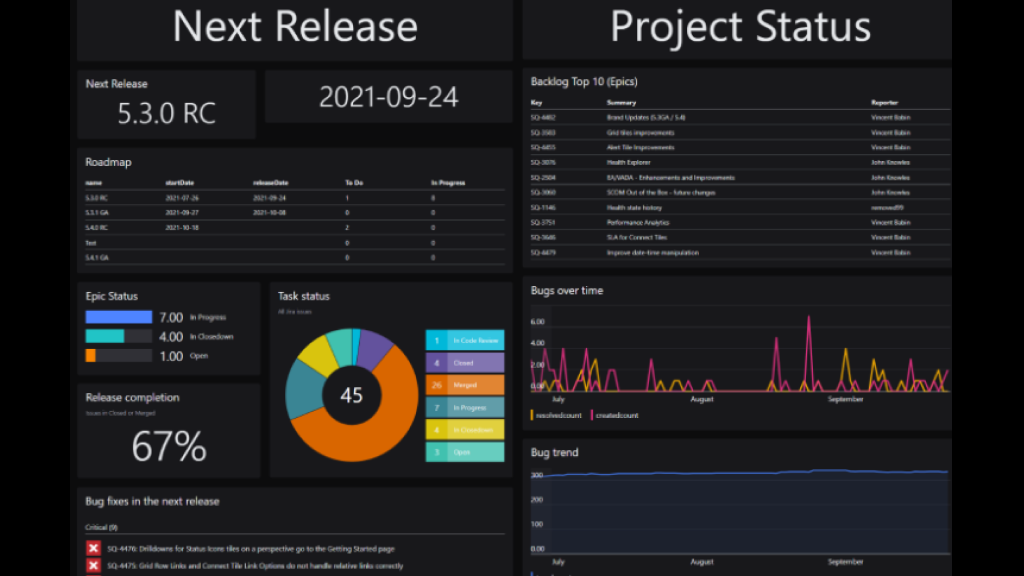
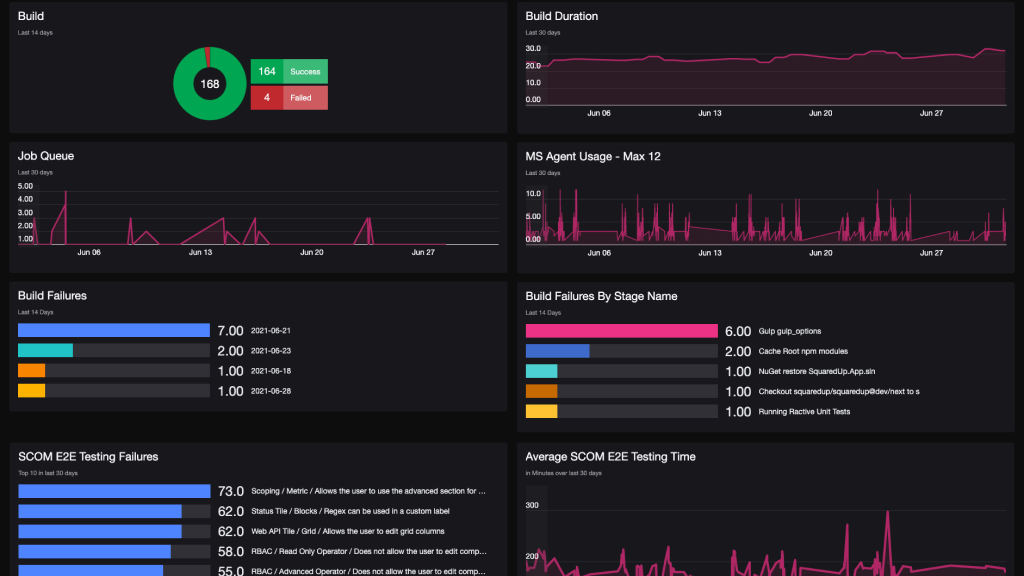
Jira Health
This dashboard displays the state of your next release and the health of the project as a whole.
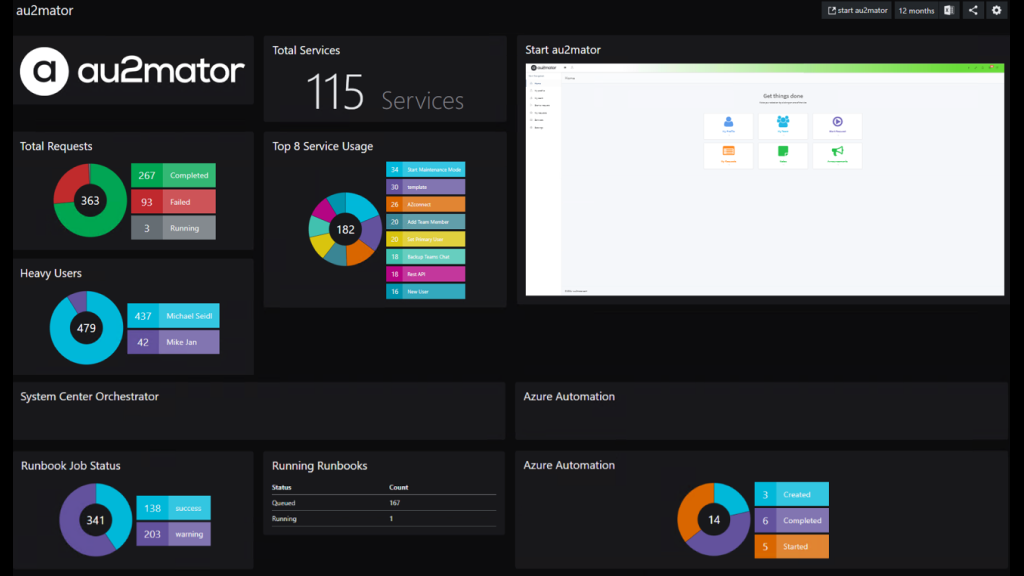
au2mator Services
This dashboard shows how au2mator were able to visualize all their services within a single view.
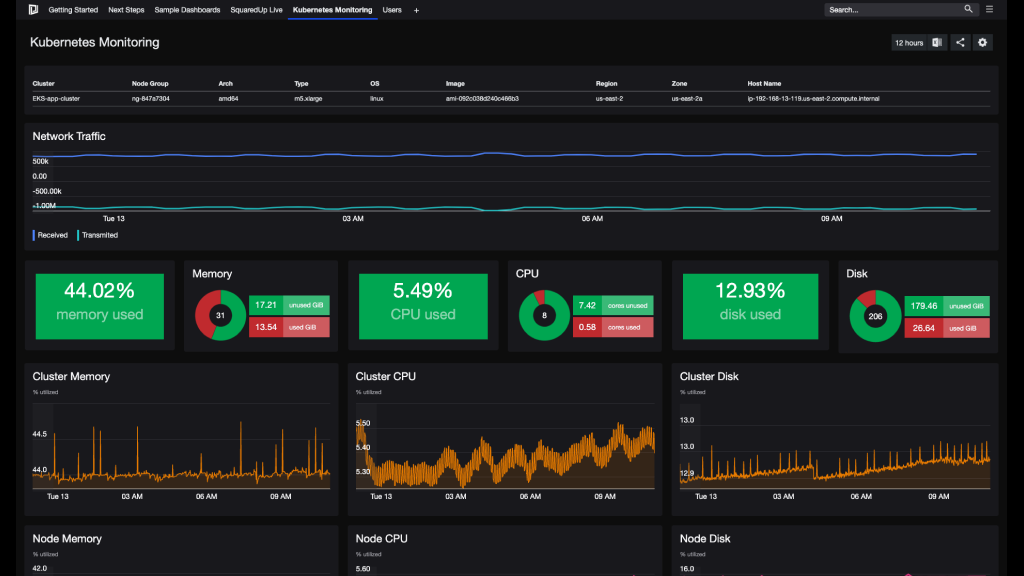
Kubernetes Monitoring (with Prometheus)
This dashboard combines live metrics from Prometheus to give a performance overview of a Kubernetes cluster.
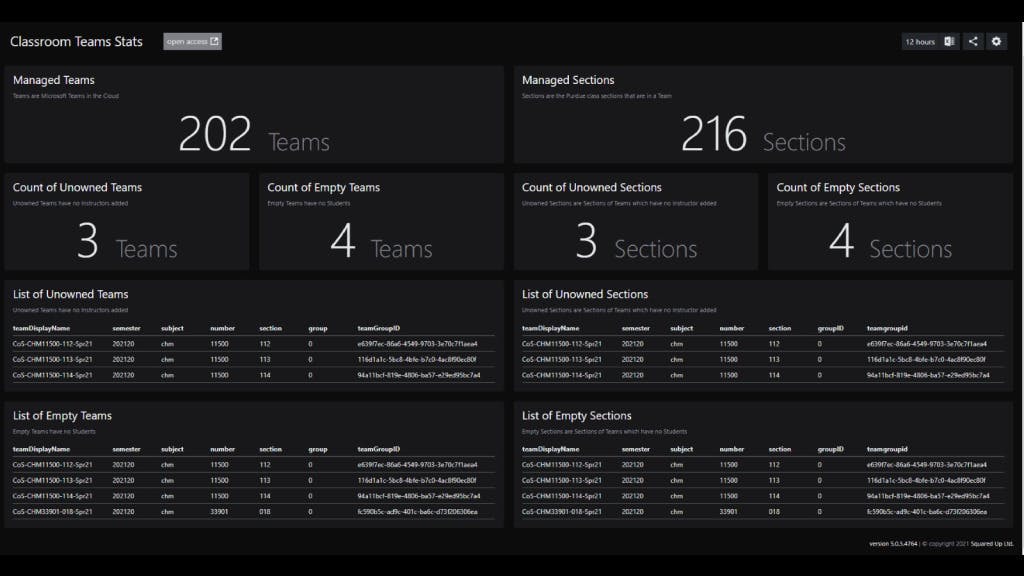
Microsoft Teams
This dashboard visualizes key Teams usage metrics for online classrooms (created by Purdue College).
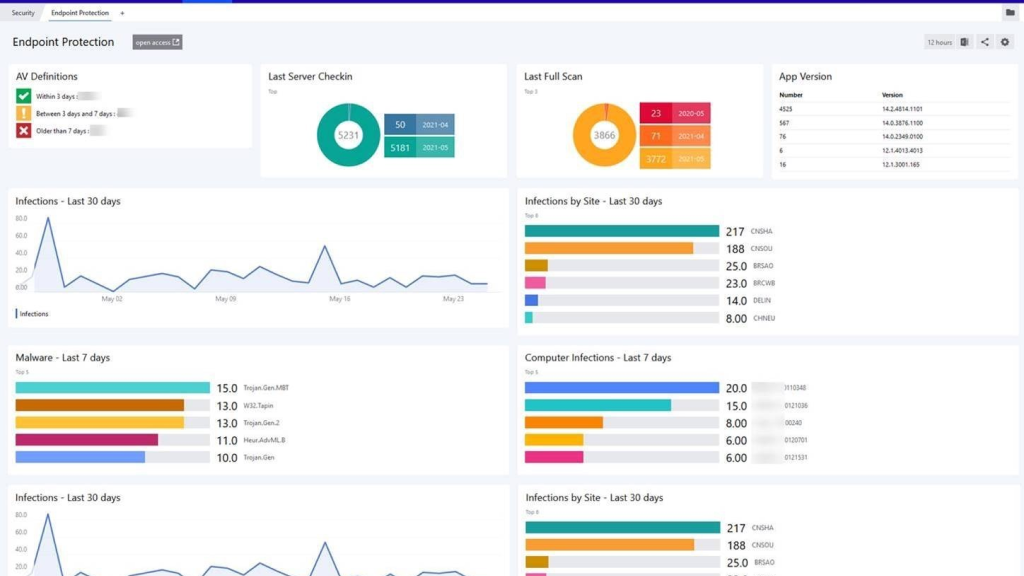
Symantec Endpoint Protection
This dashboard shows the status of endpoint protection systems to keep on top of device security and escalation.
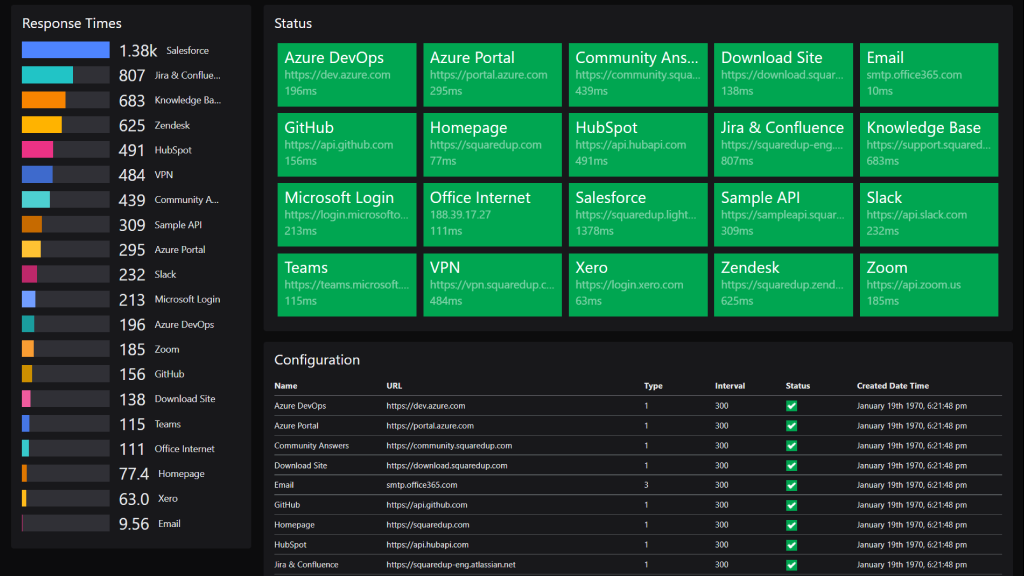
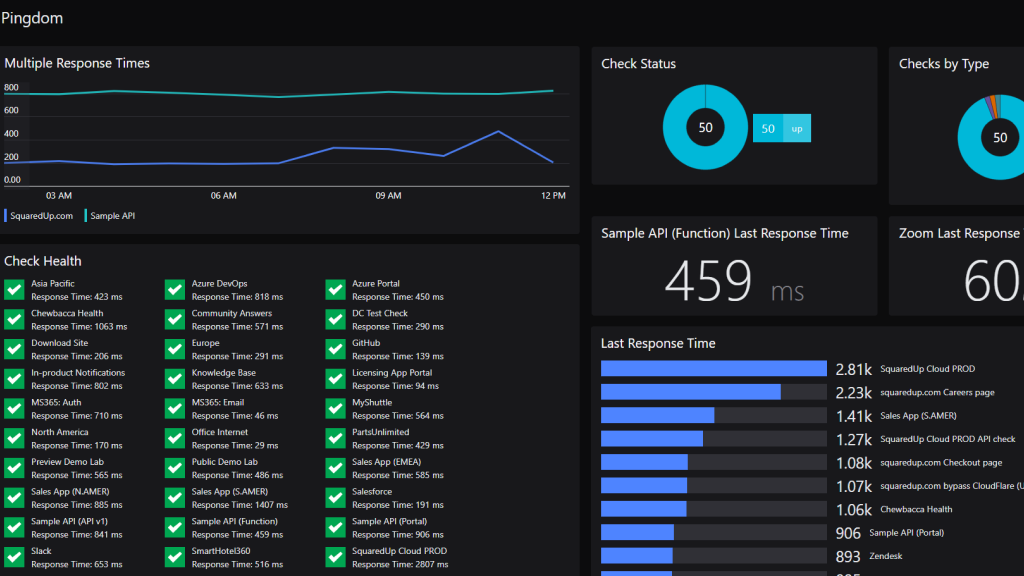
UptimeRobot Dashboard
This dashboard gives an overview of monitoring configured using UptimeRobot’s website monitoring features.
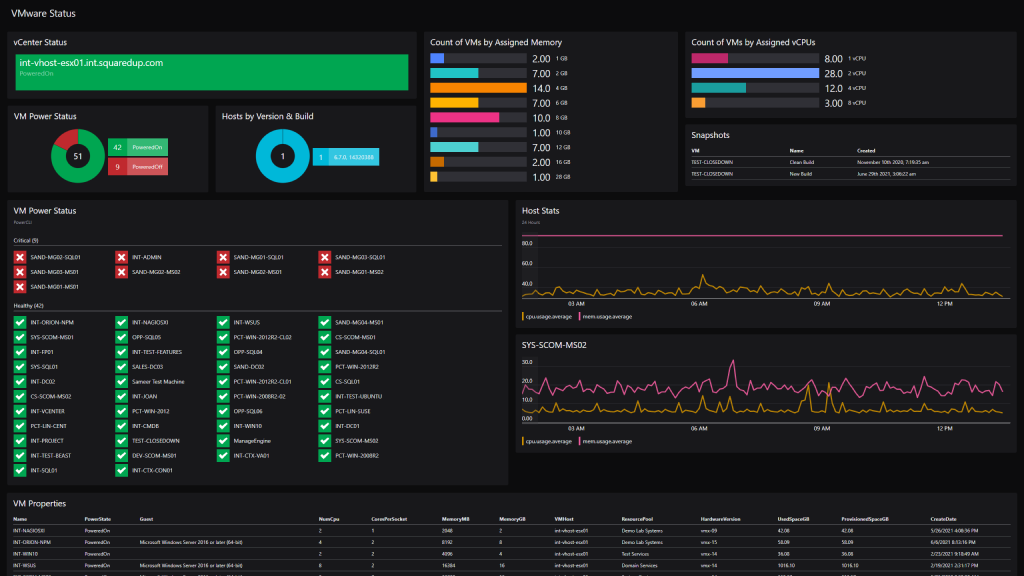
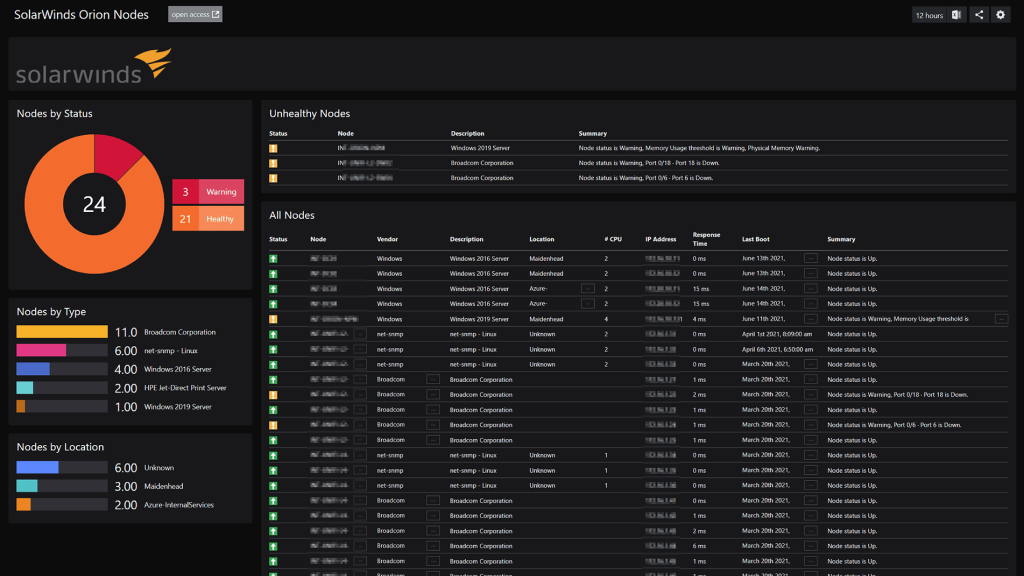
VMware Status Dashboard
This dashboard surfaces data from vCenter for Hosts and VM to provide a Virtualization Admin the information they need at a glance.
Jira Health
This dashboard displays the state of your next release and the health of the project as a whole.
au2mator Services
This dashboard shows how au2mator were able to visualize all their services within a single view.
Kubernetes Monitoring (with Prometheus)
This dashboard combines live metrics from Prometheus to give a performance overview of a Kubernetes cluster.
Microsoft Teams
This dashboard visualizes key Teams usage metrics for online classrooms (created by Purdue College).
Symantec Endpoint Protection
This dashboard shows the status of endpoint protection systems to keep on top of device security and escalation.
UptimeRobot Dashboard
This dashboard gives an overview of monitoring configured using UptimeRobot’s website monitoring features.
VMware Status Dashboard
This dashboard surfaces data from vCenter for Hosts and VM to provide a Virtualization Admin the information they need at a glance.
See more examples in the dashboard gallery
Get started today
Install on Windows Server or deploy on a VM in the cloud.
Community Dashboard Server is like Grafana but designed for IT professionals – it’s effortless to set up, visualize data, and share.
We think you might also like...
How to embed Grafana visualization in SquaredUp
In our previous post on Grafana and SquaredUp, we compared the two tools across various benchmarks like ease of deployment, time to value, dashboard creation, dashboard sharing, and more. Both tools have their specific advantages over the other, but since the ultimate goal is to give you a single place to look – why not…
SquaredUp Dashboard Server 6.1 is here
DS version 6.1 is now available! Updates include trend lines, undo / redo, EAM-X alert improvements, 24h time format option and more.