
Dave Clarke
Product Manager, SquaredUp
Monitoring my car with SquaredUp (Part 3)
This is part 3 of a three-part series where I showcase just how easy it is to build dashboards in SquaredUp using our WebAPI integration and our recently re-designed tile editing experience, centered around building a dashboard for my car. In my last post we looked at how to use SQL Analytics to format and manipulate data.
If you missed the first two parts check those out here:
In this post we’ll explore the scripting capabilities in SquaredUp and see how scripts can be used to handle advanced manipulation of data and more complex uses cases. We’ll cover:
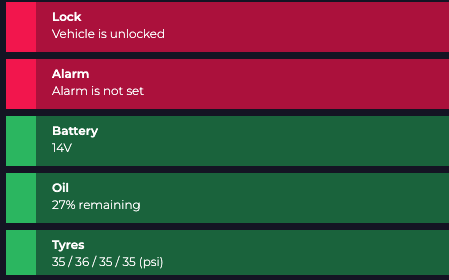
In this example, the Ford API returns various statistics and status information for the lock, alarm, oil, tyres and more. I wanted to combine these stats into a format that could be shown as several status blocks on my dashboard to make it easier to understand this data and see the red/green health colours at a glance.
LOCKED to success and error as these will be represented as red and green in SquaredUp.const toPsi = (v) => (v * 0.145038).toFixed(0);
async function getData(params, api) {
const { vehiclestatus: ford } = await api.post('/request', { method: 'get', url: 'https://api.ford.com/v1/vehicle/status?vin=ABCDEF1234' });
const data = [
{
"name": "Lock",
"state": ford.lockStatus.value === 'LOCKED' ? 'success' : 'error',
"sublabel": ford.lockStatus.value === 'LOCKED' ? '' : 'Vehicle is unlocked',
"timestamp": ford.lockStatus.timestamp
},
{
"name": "Alarm",
"state": ford.alarm.value === 'SET' ? 'success' : 'error',
"sublabel": ford.alarm.value === 'SET' ? '' : 'Alarm is not set',
"timestamp": ford.alarm.timestamp
},
{
"name": "Battery",
"state": ford.battery.batteryHealth.value === 'STATUS_GOOD' ? 'success' : 'error',
"sublabel": `${ford.battery.batteryStatusActual.value}V`,
"timestamp": ford.battery.batteryHealth.timestamp
},
{
"name": "Oil",
"state": ford.oil.oilLife === 'STATUS_GOOD' ? 'success' : 'error',
"sublabel": `${ford.oil.oilLifeActual}% remaining`,
"timestamp": ford.oil.timestamp
},
{
"name": "Tyres",
"state": ford.tirePressure.value === 'STATUS_GOOD' ? 'success' : 'error',
"sublabel": `${toPsi(ford.TPMS.leftFrontTirePressure.value)} / ${toPsi(ford.TPMS.rightFrontTirePressure.value)} / ${toPsi(ford.TPMS.outerLeftRearTirePressure.value)} / ${toPsi(ford.TPMS.outerRightRearTirePressure.value)} (psi)`,
"timestamp": ford.tirePressure.timestamp
}
]
return api.toStreamData(data, { rowPath: [], [{ "name": "name" }, { "name": "state", "shape": "state" }, { "name": "sublabel" }, { "name": "timestamp", "shape": "date" }] });
}
In addition to using scripting for fetching and manipulating data, we can also use scripting to achieve custom monitoring logic. In SquaredUp, you can create a monitor against any tile configuring typical monitoring using warning and error thresholds. Many of the tiles on the Ford dashboard use this, for example showing a warning when the fuel level gets too low. Learn more about Monitoring.
In this example we create some custom logic that triggers the following health states based on the car’s proximity to home.
This means that SquaredUp can notify me when my car leaves/arrives at home - awesome! 🎉
To achieve this we’ll create a monitor condition script that determines if the latitude and longitude returned from the Ford API are within those given areas (home, nearby, away).
const inBox = (ix, iy, ax, ay, x, y) => (ix <= x && x <= ax && iy <= y && y <= ay);

async function getState(params, api) {
    // Get the latitude and longitude from the tile data
    const lat = (await api.getColumnData(params.data, 'lat')).map(row => row.value)[0];
    const lon = (await api.getColumnData(params.data, 'lon')).map(row => row.value)[0];

    // These coordinates map a bounding box at home, and a slightly larger box for nearby
    const home = [-0.729651,51.519180,-0.714416,51.527204];
    const nearby = [-0.740933,51.512402,-0.703683,51.532028];

    // Return an appropriate state for at home, nearby
    if(inBox(...home, lon, lat)) {
        return { state: "success" };
    }

    if(inBox(...nearby, lon, lat)) {
        return { state: "warning" };
    }

    // If the car is anywhere else, return an error!
    return { state: "error" };
}That’s all for now, folks! I hope you enjoyed this three-part series and had as much fun as I did building your dashboards. And don’t forget, if you're eager to join the ranks of the #DataJedi with your very own limited-edition t-shirt, you've still got a chance! Learn more and get involved here: