Blog

How Arup achieved unified visibility across teams and tools

How to use scripts: Data manipulation and custom monitoring
Using SquaredUp for a complex use case? Let our Product Manager Dave Clarke show you how to use scripting for advanced data manipulation.
How to format and customize data using SQL Analytics
It’s easy to combine datasets and manipulate data with our SQL Analytics feature. Let our Product Manager Dave Clarke show you how.
Monitoring my car with SquaredUp: a 3-part series
With our WebAPI plugin you can visualize data from anywhere! See how our Project Manager Dave Clarke built his Ford dashboard.

What on earth are DORA Metrics?
What are these “DORA Metrics” that everyone is talking about? How can they help my team or organization?

DORA Metrics Considerations
DORA metrics are not a framework that can be mindlessly applied. In this article we explore some considerations to take into account.
Win prizes when you try the new SquaredUp
Get creative and build a cool dashboard using SquaredUp Cloud. Enter the competition for a chance to win big!
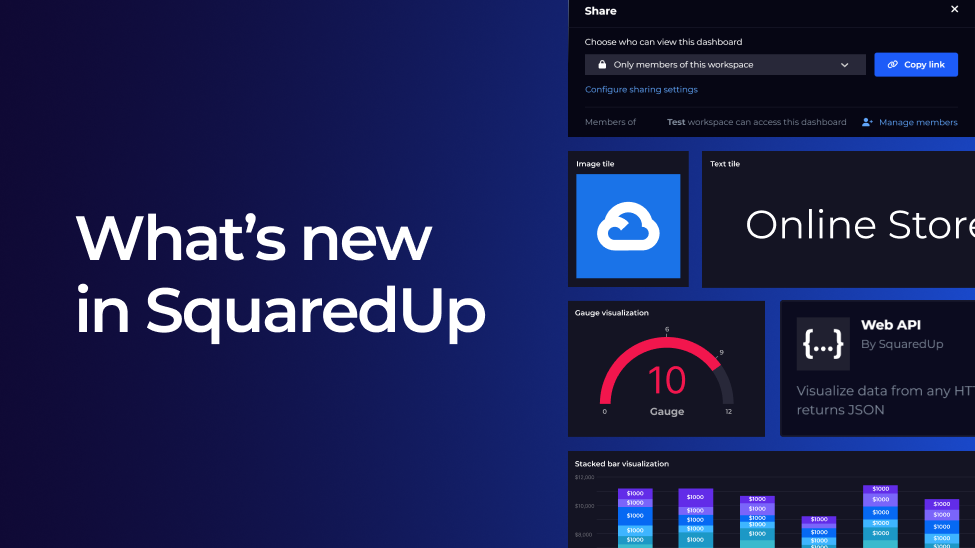
Launching a new dashboarding experience
We’re excited to announce a fully redesigned dashboarding experience. New features include an upgraded dashboard designer, new data sources and much more!

Running Postgres in Docker
Stephen Townshend shows us how to set up and run Postgres in a Docker container, a cleaner and simpler way to run it on your device.
Installing Backstage on a Mac
In this short guide I will provide step by step instructions on how to set up and run Backstage on a Mac.

Three Ways to Run Prometheus
In this article I will show you how to get Prometheus up and running as a binary, a container running in Docker, and inside Kubernetes.

Metrics vs. Logs vs. Traces (vs. Profiles)
A clear and concise overview of four different telemetry signals: Logs, traces, metrics, and profiles.

Instrumenting Node.js code with Prometheus custom metrics
How to instrument your Node.js code with custom Prometheus metrics using the prom-client package.