
Most modern IT tools have extensive APIs that you can use to integrate all your application data into one dashboard. SquaredUp’s Web API integration lets you surface all your application data into one dashboard.
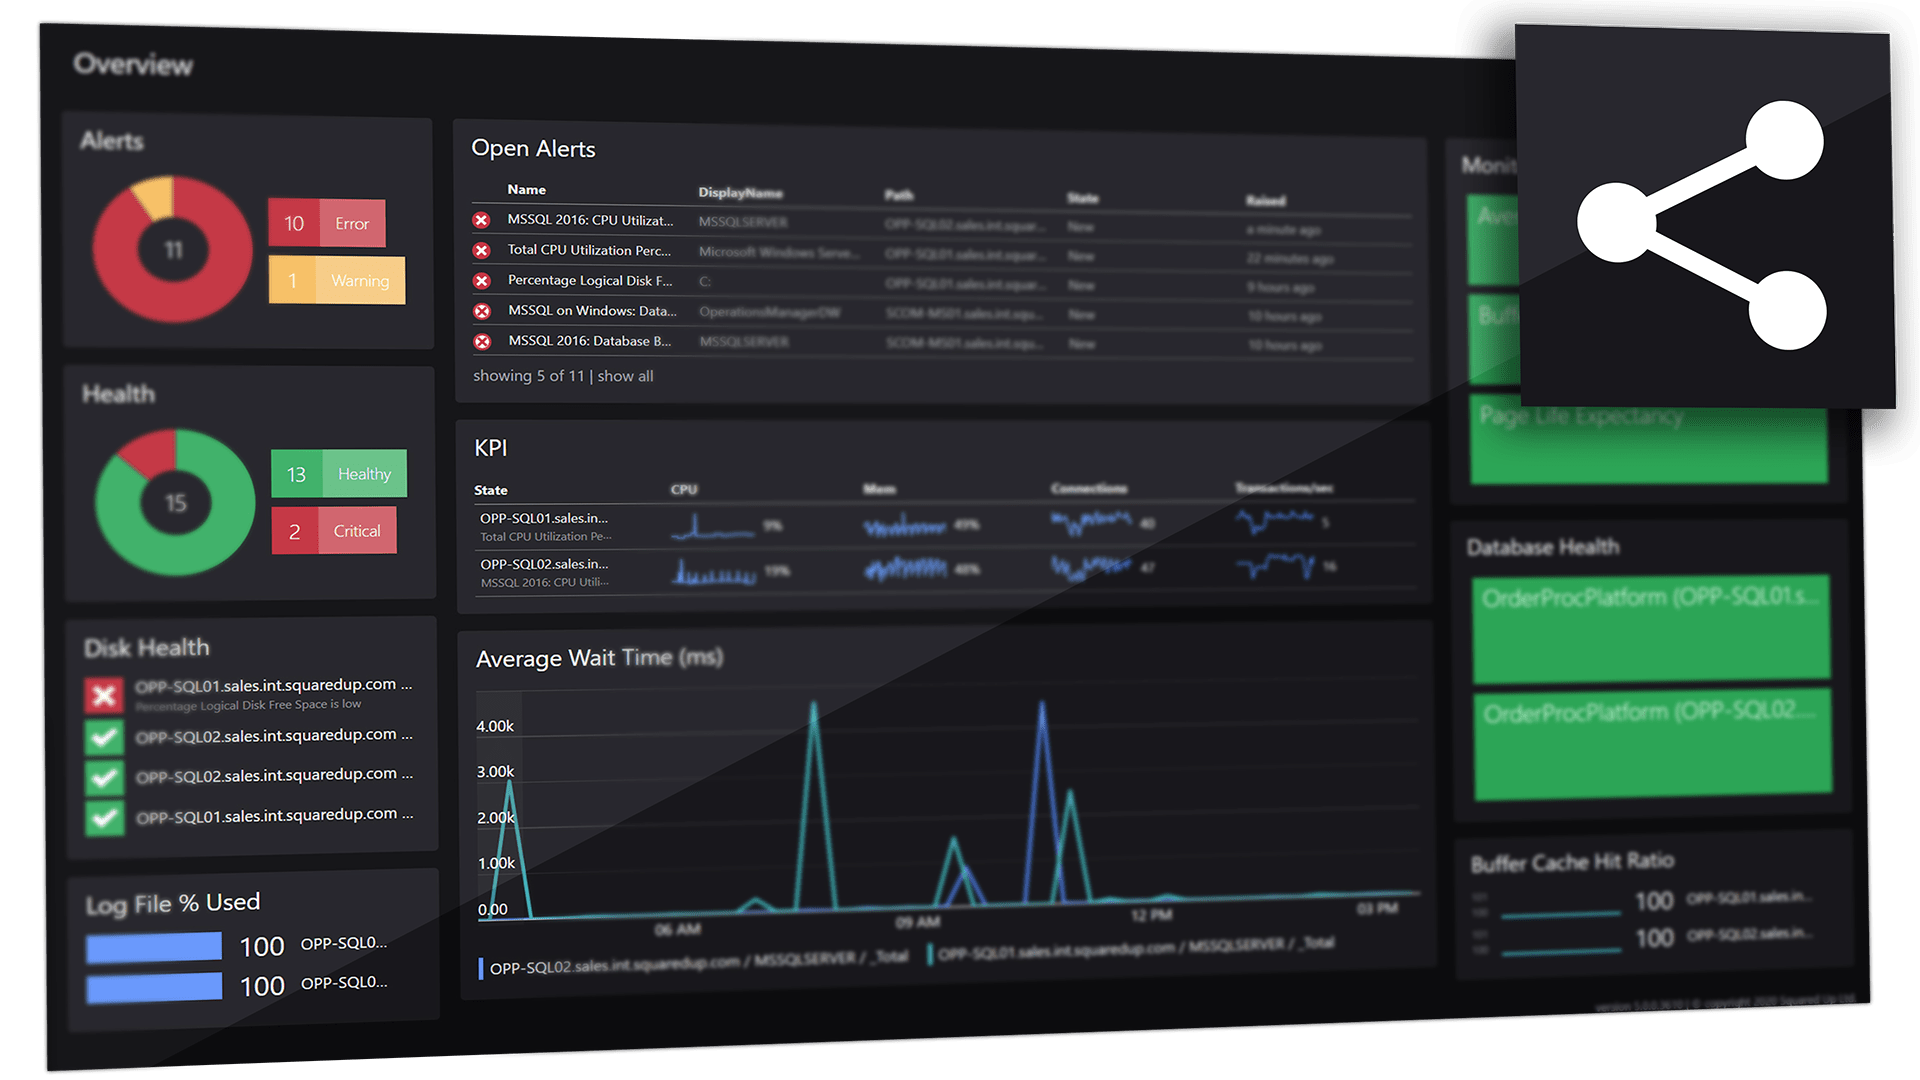
Sample Web API Dashboard
Here’s an example of a dashboard using the SquaredUp Web API tile to visualize PagerDuty data using multiple visualizations.
Share with the team
Proudly share your awesome dashboards with everyone using Open Access.
Integrate in four easy steps
STEP ONE
Pick the Web API tile.
STEP TWO
Choose how you want to visualize your Web API data – a single value (scalar), a grid of data, a line graph, sparklines, bar, donut, or two different status blocks.
STEP THREE
Configure your API authentication provider.
STEP FOUR
Select the method, your API endpoint, and supporting data in the query as required.
Want to know more?
Find out more about working with the Web API integration in the following blog posts:
Dashboard Server: Working with the Web API tile
https://ds.squaredup.com/blog/dashboard-server-working-with-the-webapi-tile
Working with the Web API tile – tips & tricks
/blog/working-with-the-webapi-tile-tips-tricks
Reduce monitoring silos with SquaredUp Web API and SQL tiles
/blog/reduce-monitoring-silos-with-squaredup-webapi-and-sql-tiles
How to build insightful M365 analytics dashboards with SquaredUp and Microsoft Graph API
/blog/how-to-build-insightful-m365-analytics-dashboards-with-squaredup-and-microsoft-graph-api-part-1
But if you want to dig a little deeper, check out these knowledge base articles:
How to add a Web API provider
See Support Article
How to use the Web API tile
See Support Article
How to use the Web API tile with ServiceNow
See Support Article
How to use the Web API tile with Pingdom
See Support Article
GET STARTED TODAY
Zero to dashboard hero in 60 seconds
Start now with hundreds of customizable dashboards.