Smart dashboards. Total visibility.
SquaredUp is the operational intelligence platform that enables data-driven IT and engineering teams to make better decisions, faster.


"Thanks to my dashboards in SquaredUp, we can have discussions based on facts, not fiction."

Get the insights you need, from the data you already have
Connect
Connect to any data, anywhere
With over 60 pre-made integrations with your favourite tools, you can connect directly to the data that matters. No data ingestion, no new databases, just real-time insights at your fingertips.
Visualize
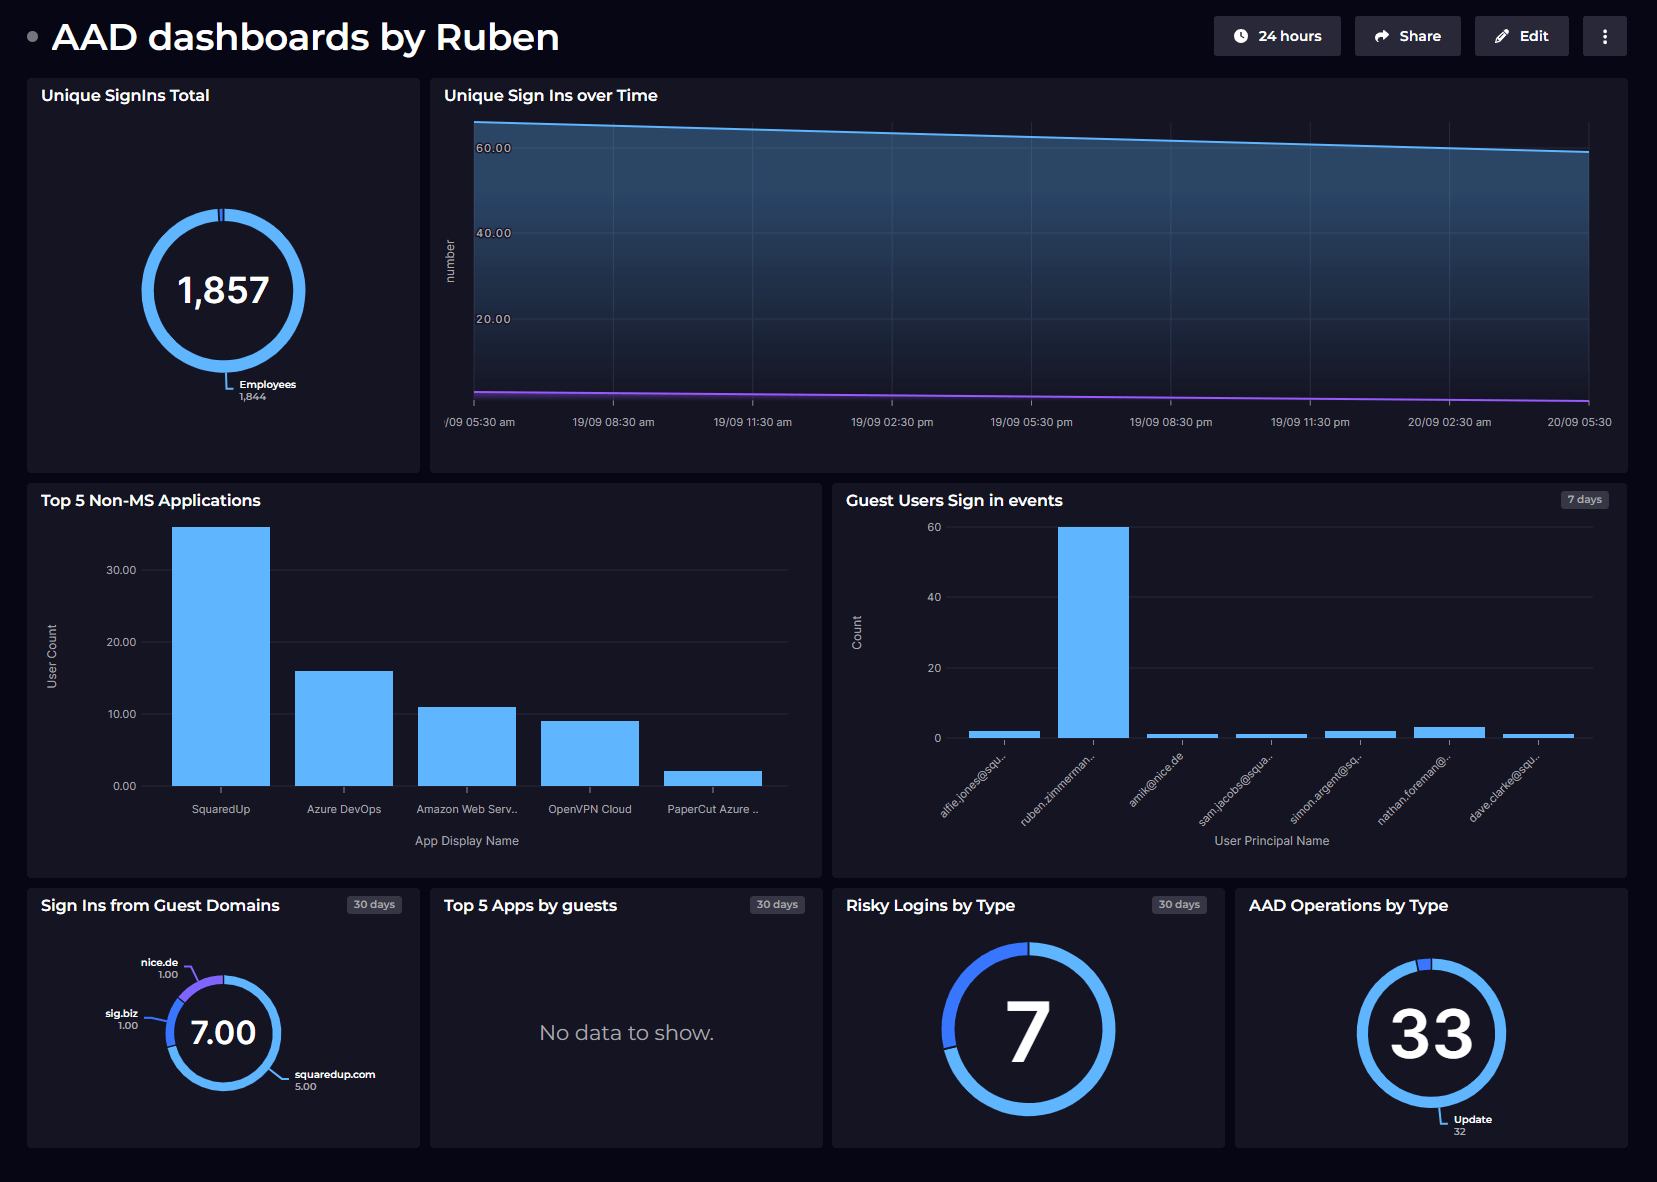
Build the perfect picture in minutes
Starting with 100s of out-of-the-box datasets and views, it's easy create and share the dashboards you need. But don't stop there – effortless monitoring, powerful analytics and universal search put you in complete control of your data insights.
Summarize
Centralized rollup, smart drilldowns
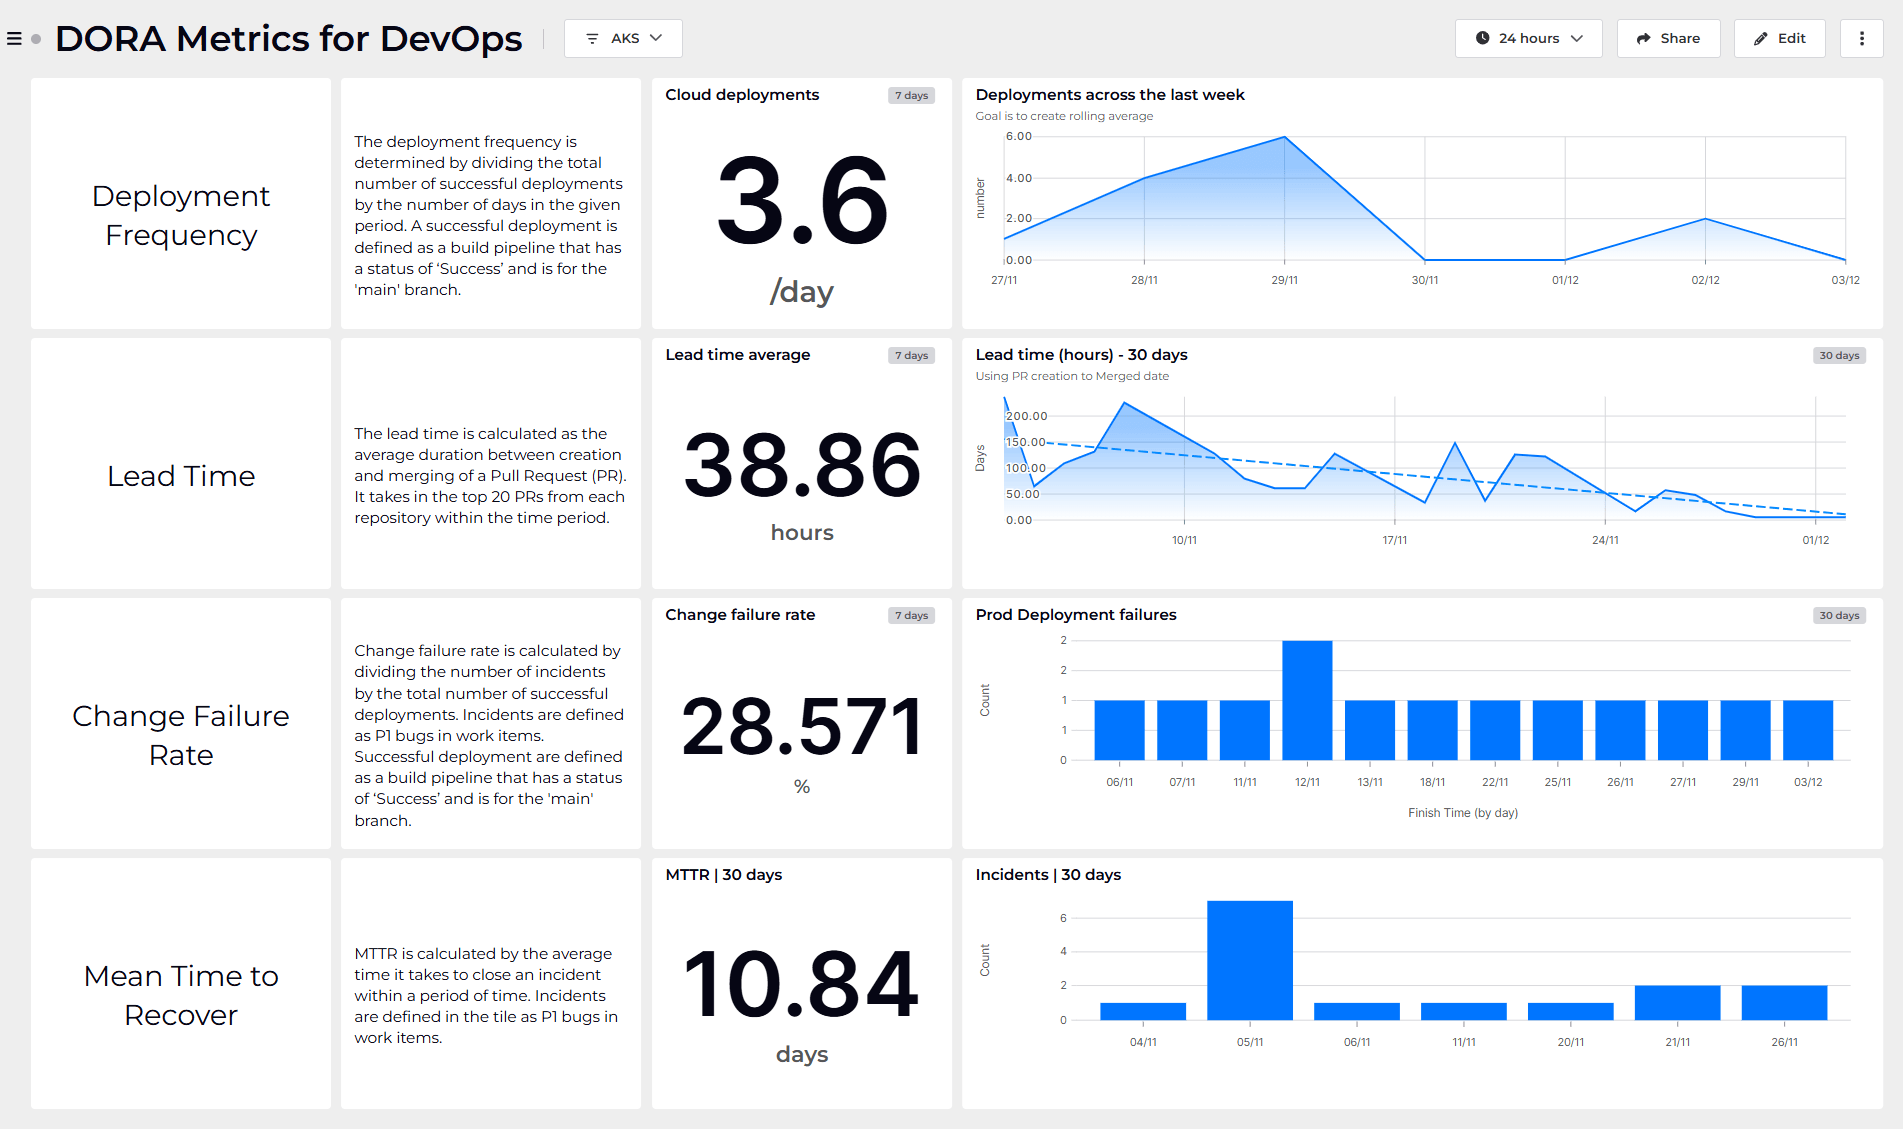
It's easy to get lost in a mountain of metrics. SquaredUp's unique RollUp architecture gives management teams a summary of status, while operations teams can get straight to the answers.


Everything you need to know, all in one place
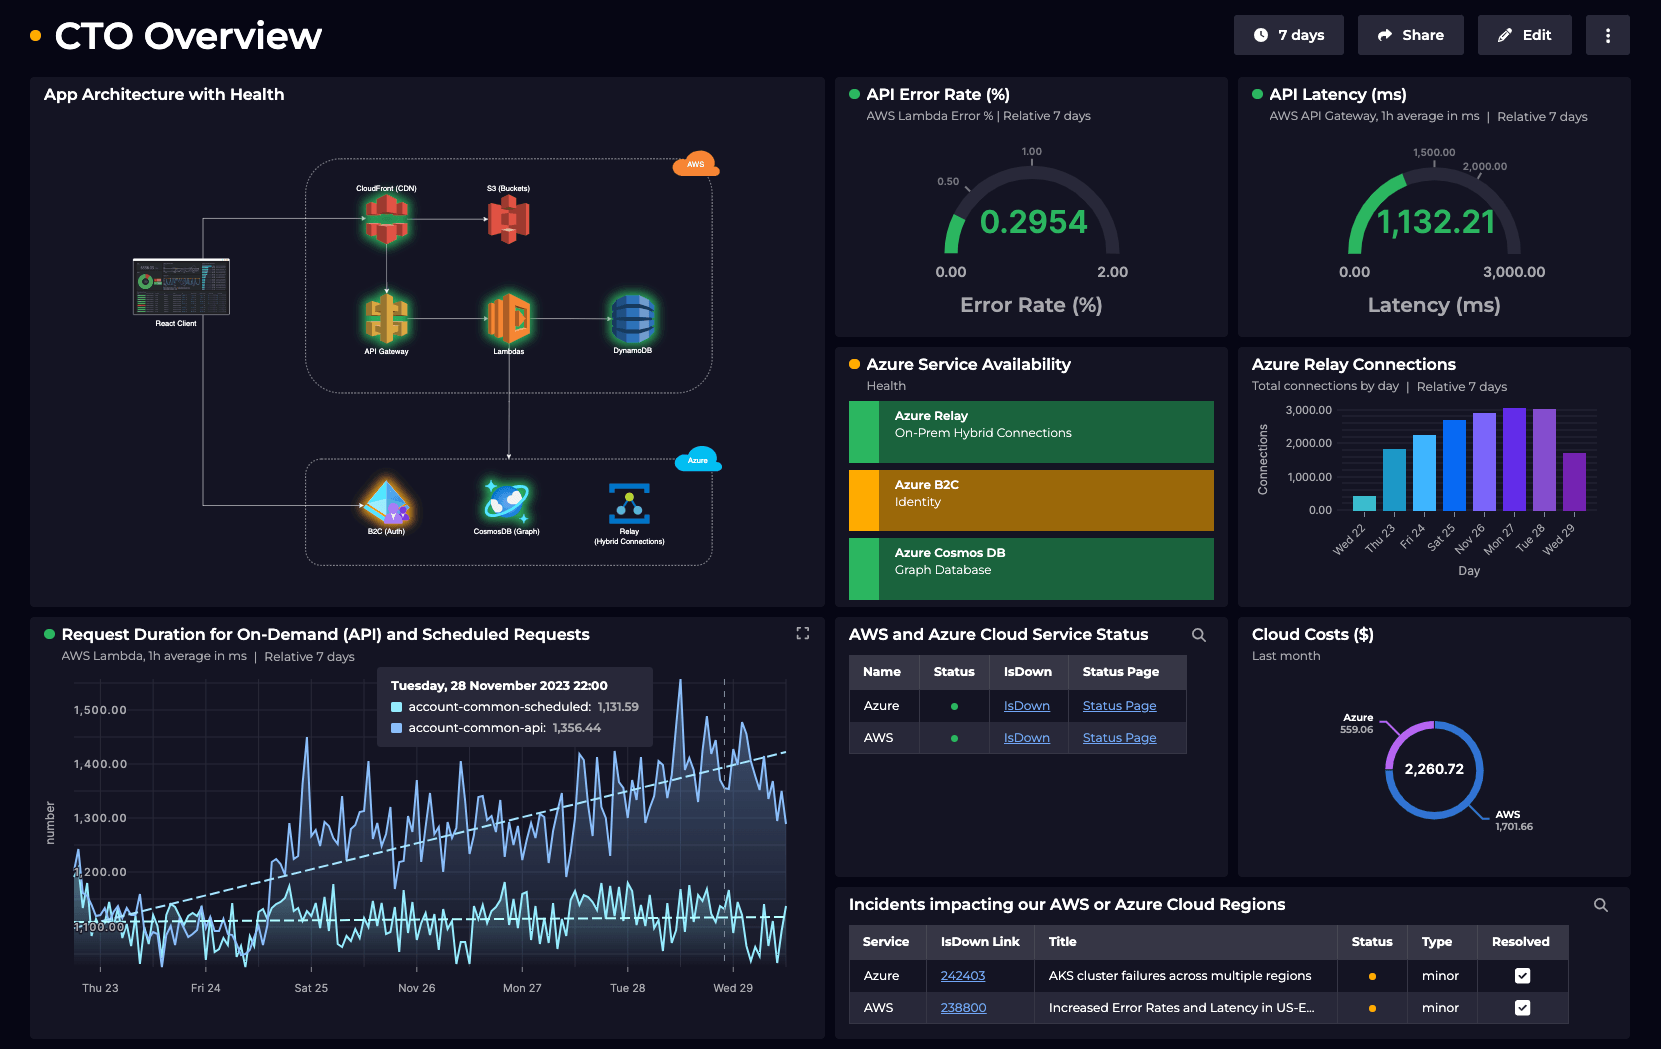
A single pane of glass, without the ingestion costs.
SquaredUp does not ingest your data. Instead it connects and correlates each tool to form a Data Mesh architecture. You get unified, real-time insights, without paying to move all of your data.

“We wanted to create a modern observability platform with the tools we already had. SquaredUp provided the missing visibility piece.”
Anthony Ashmead, Enterprise Monitoring Lead
Join the SquaredUp community
3300+
community members
Connect with a community of experts to share and find answers
97.8%
customer satisfaction
Access SquaredUp docs, videos, and a friendly support team
Top 10
best workplace 2024
Discover the vision, people, and values that make us unique
Figures taken from the average of the last 12 months, as of May 2025