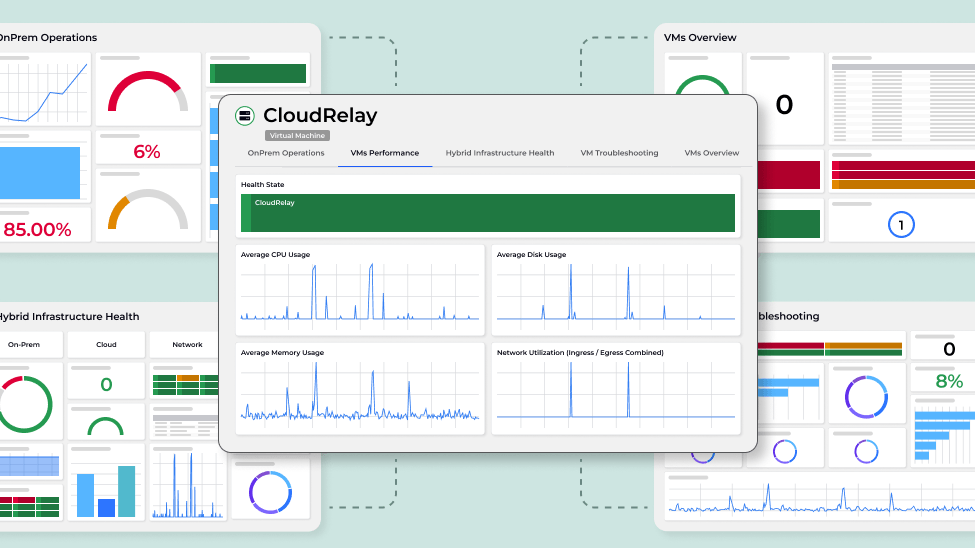
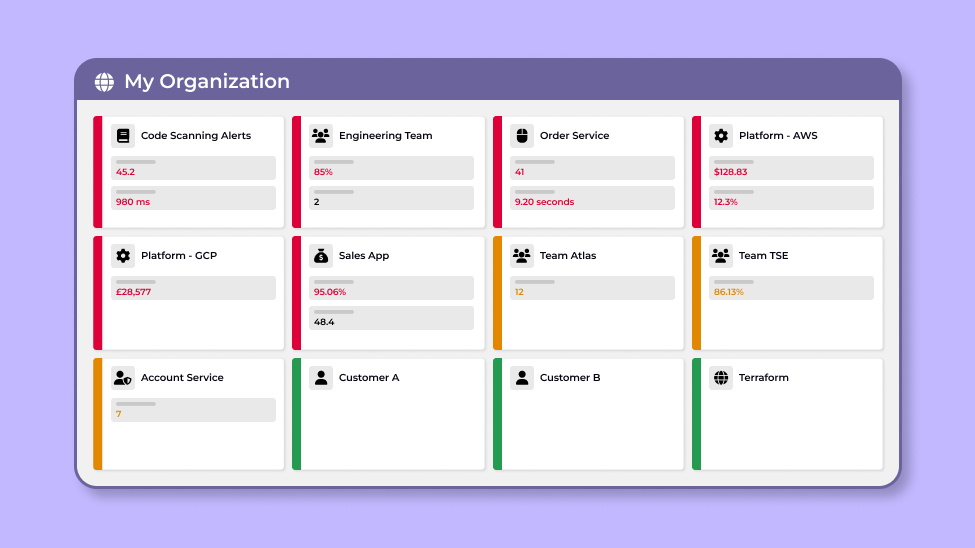
Skip to Main Content

Features at-a-glance

SquaredUp is absolutely jam-packed with awesome features that make it a breeze to tell any story, at any scale, with the data you already have. Simply plug in and start dashboarding.

Dashboarding

Your data, made beautiful

Dashboard Designer

Our super-flexible dashboard designer lets you build the views you need, without the steep learning curve you might expect. Simply point-and-click to add data.

Awesome Visualizations

With a growing library of visualization options, you can present your data in a way that makes sense to you.

Image and Text Tiles

Data doesn't always tell the whole story. With our image and text tiles you can add pictures and notes to complete the picture.

Light and Dark Theme

Our beautiful themes let you see your data how you want. Pick your own, or default to your system settings.

Live Status Diagrams

From network diagrams to building plans... bring your favourite SVGs to life with health state symbols, colour fills, or cool glows.

SQL Analytics

Take data shaping to the next level by turning any data stream into a SQL table, ready to power the most advanced queries that finally uncover the insights you've always wanted.

Sharing

Share insights with the whole team

Data Export

Take your data out of SquaredUp and drop it into Excel, Sheets, Notion, or many other table-shaped data tools. Long-term reporting solved!

Image Export

Enhance any email, DM, or social post with a live snapshot of your data. Just hit export and share away.

Unlimited Dashboard Sharing

Sharing makes dashboards available to anyone in your organisation, with or without a user license. Protected by your own list of safe domains.

Public Links

Put your dashboards where you need them with anonymous public links. Read-only of course, but just as alive.

Report Scheduling

Automate dashboard delivery to any channel with our flexible Notification API. Daily stand-ups sorted!

Plugins

Quickly connect to your data

50+ Plugins

Instantly connect to your data with our growing library of powerful plugins. They even come with starter dashboards!

Custom Web API

If we don't have a plugin for your favourite data source yet, no need to worry! Our custom Web API plugin makes it simple to roll your own.

Custom PowerShell

For our wonderful community of Microsoft admins, simply paste your favourite script into your dashboard and watch it come to life.

Custom JavaScript

For the most advanced cases, our JavaScript feature allows you to request, process, and shape data from any source.

20+ On-prem Plugins

We don't just do data from SaaS tools... we have a growing library of on-prem plugins designed to unlock those datacentre silos.

On-prem Relay Agent

Our on-prem relay agent can be deployed wherever your data lives, and only requires access to the internet to connect. No inbound rules required

Loom video thumbnail
Monitoring

Know when something changes

Monitors

Seeing your data is one thing, but knowing if its a problem or not is the real win. Enable a monitor and be told when something isn't right.

Configurable Frequency

From business critical to rarely changing, you can configure your monitors to check for new data from every minute to every day.

Email, Slack and Teams Notifications

Sure, they're great to look at, but nobody wants to stare at dashboards all day. Turn on notifications and we'll tell you when you're needed.

Tile Previews

Add context to your notifications with a point-in-time snapshot of the tile that sent the alert.

Script Evaluation

For more advanced cases, use our script-based monitors to check for complex conditions or compare multiple data sets.

Custom Webhook Notifications

If our existing channels don't cut it, you can build your own custom webhooks to send notifications wherever you need them.

Zapier Integration

Our premium Zapier integration lets you build your own downstream automations. Send an SMS, turn on a light, sound an alarm...

ServiceNow Ticket Creation

Empower your service desk to react at lightning speed when a notification is sent. Create contextual tickets directly in ServiceNow.

Learn more

Monitoring docs
Monitoring cloud costs blog

Map

Understand and explore relationships

Universal Search

Every object from every tool is carefully indexed and correlated into our map, and is surfaced via our powerful search.

Object Drill-down

See the real detail by drilling into any object in the map. See how that object relates to others, and get instant access to every datapoint.

Status Roll-up

Our unique status roll-up model takes the health of your monitored tiles and brings that state to their dashboards and workspaces.

Organization Overview

See the real "big picture" from your organization overview. All your workspaces, dashboards, or monitors in one place.

KPIs

Standardise your key metrics from any data source into flexible KPIs, ready to combine, aggregate and alert on.

Custom Types, Correlations, and Tags

Bring your own knowledge to the map by importing custom object types, correlating with your own rules, and turning tags into searchable entities.

Access Control & Collaboration

Keep it private, or share the love

Microsoft and Google SSO

Keep your credentials secure by signing into SquaredUp via a trusted identity source, that you control.

Workspaces

Organize your dashboards into meaningful workspaces and stay on top of dashboard sprawl.

Workspace Access Control

Don't worry about that sensitive dashboard being viewed by the wrong people. Keep your workspaces locked to the right people and groups.

Data Source Access Control

Go a step beyond workspace access control by adding protection to each data source connection.

User Groups

Simplify the management of access control by creating user groups to protect your workspaces and data sources.

Okta SSO

Our Okta SSO integration allows you to protect access to SquaredUp through your own private identity provider.

Custom Domain

Give your users confidence that they're in the right place by adding a custom URL to your SquaredUp organization.

API & Automation

Supercharge your workflows

Automation API

Full control over your SquaredUp organization from any external tools. Manage users, create dashboards, rotate API keys...

Terraform Provider

Deploy and manage dashboards as part of your dev process by integrating our Terraform provider into your pipelines.

Notification API

Trigger notifications on demand, regardless of monitoring conditions. The perfect way to get your dashboards wherever and whenever you need.

Query API

All the power of SquaredUp's platform but with your own tools on top. If you can do it on a dashboard, you can access it via our API.

Plug into your data.
Discover and share insights.

PagerDuty

Monitor the Incidents and Alerts from your PagerDuty environment.

GitHub

Monitor the Incidents, Issues and Pull Requests from your GitHub environment.

Google Cloud Platform

Monitor your GCP environment, including GKE, Hosts and more.

Dynatrace

Monitor the Applications and Synthetic Transactions from your Dynatrace environment.

Azure DevOps

Monitor the Builds and Releases from your Azure DevOps environment.

Azure

Monitor your Azure environment, including VM, Functions, Cost and more.

AWS

Monitor your AWS environment, including EC2, Lambda Functions, CloudWatch and more.

AppDynamics

Monitor key metrics from your AppDynamics environment.

Prometheus

Monitor metrics from Prometheus using custom PromQL queries.

SquaredUp has 50+ pre-built plugins for instant access to data.

Learn More

Launching a new dashboarding experience 

We’re excited to announce a fully redesigned dashboarding experience. New features include an upgraded dashboard designer, new data sources and much more!

Dashboard Stories

Browse our catalog of dashboards for inspiration and real life use cases.

How to use scripts: Data manipulation and custom monitoring

Using SquaredUp for a complex use case? Let our Product Manager Dave Clarke show you how to use scripting for advanced data manipulation.

Engineering team dashboard: A management view

Dashboard Preview Challenge This dashboard came about after a chat with Tim, our Director of Engineering Excellence, when he asked, “what would your ideal engineering dashboard look like?”. We agreed that first and foremost, the dashboard needed to give us a clear understanding of how the team is actually performing, without having to dig around…