Skip to Main Content

Azure DevOps

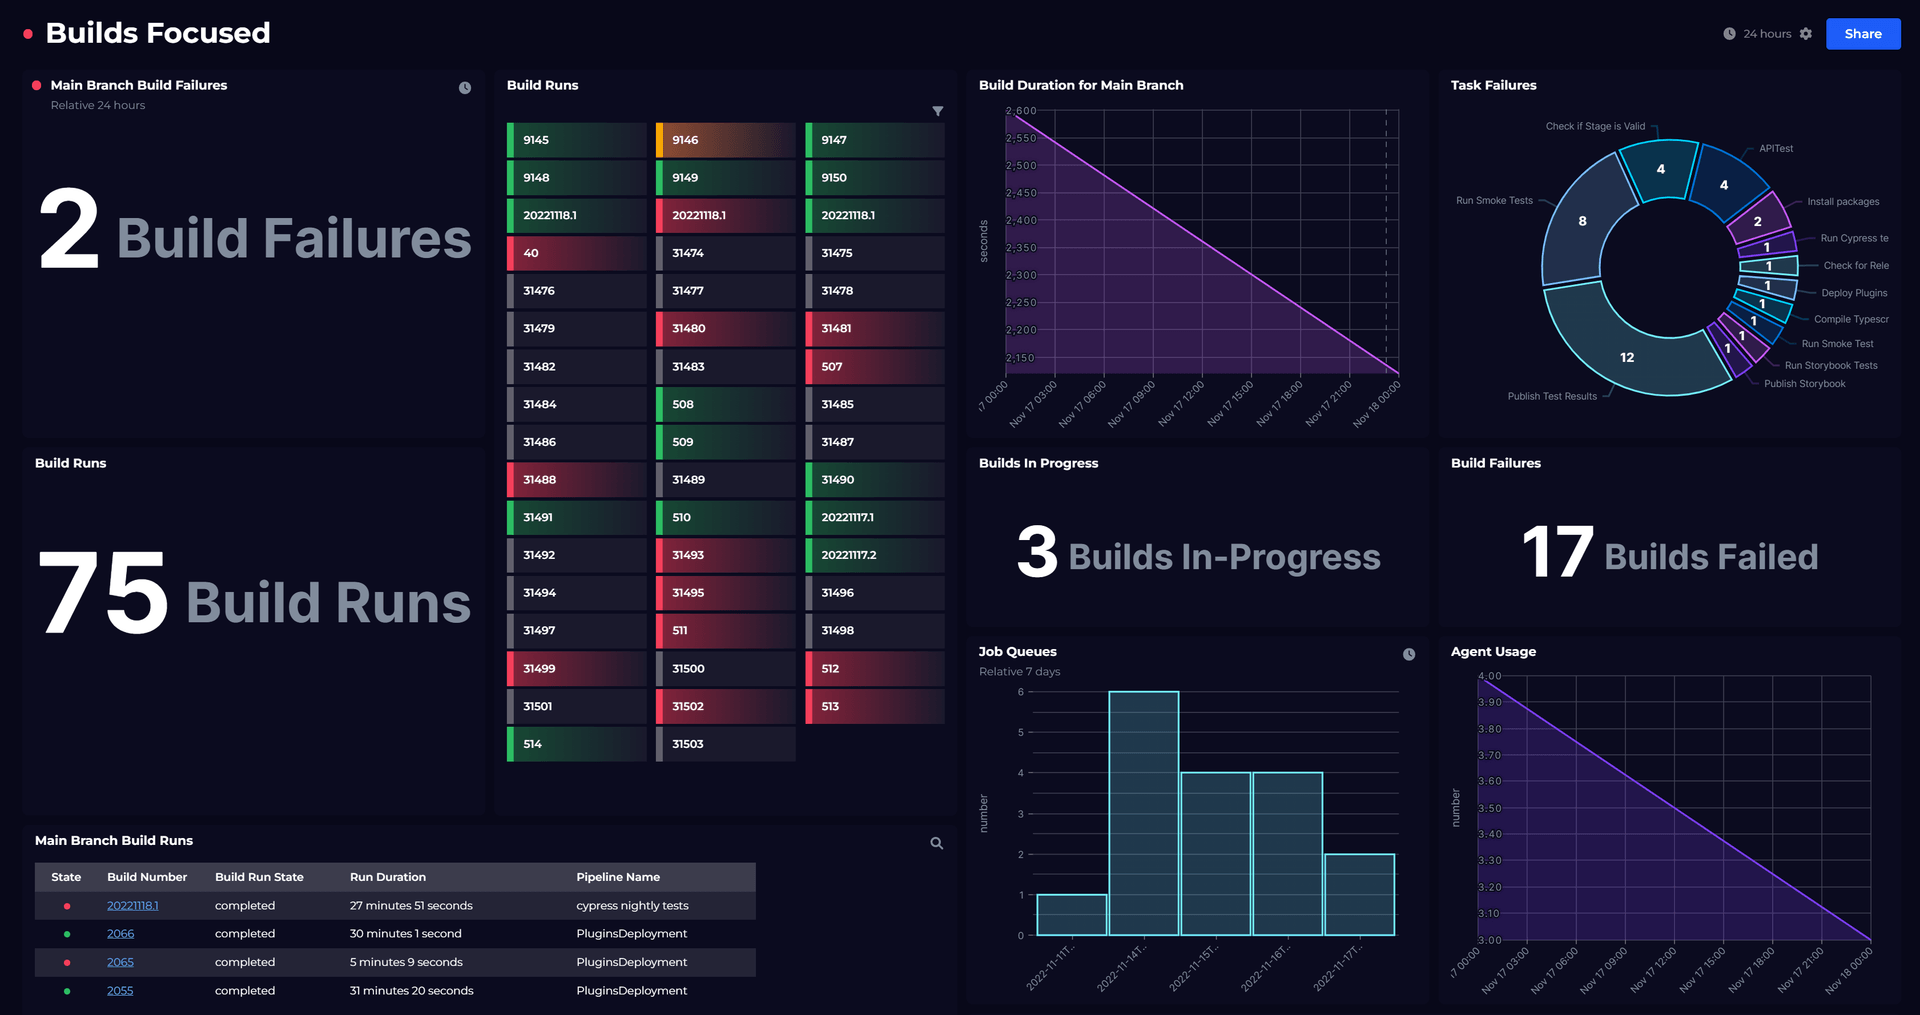
This SquaredUp dashboard uses the Azure DevOps plugin to let you monitor the status of your CI/CD automation, monitor Azure DevOps for failures and large queues, track the usage of your agents and resources, and summarise work items and test cases.

Dashboard Preview

Challenge 

Azure DevOps is a feature rich and powerful tool for CI/CD, testing and work management. However, the native dashboards are very limited and limit the scope of what you can visualize and how you can display it. For example, there is no way to bring together metrics across projects on one page. You also do not have the ability to aggregate metrics and monitor metrics so you can be proactive in managing DevOps in your organization.  

As a specific example, when you can’t understand the current status of your pipelines then you are not going to know if you are blocked when trying to deploy to production. 

Solution 

The Azure DevOps plugin in SquaredUp allows you to combine data across your whole organization and visualize these in a single tile or dashboard. You can bring in data from your pipelines, releases, work items, test cases, artifacts, agents, deployment pools, resources, and repos. SquaredUp also has out-of-the-box data streams that will let you focus in on pipeline failures and agent usage in a couple of clicks. 

By combining data from across several pipelines and projects, you get the complete picture of the state of your CI/CD processes at a glance. You can quickly highlight failures or slow pipelines that are impacting your business. You can also monitor these tiles and get notified when they break the thresholds that you set. 

Using SquaredUp dashboards with Azure DevOps allows you to split the data across projects, products, or even down to microservices. You will quickly be able to create several dashboards tailored to the needs of different teams. For instance, if you have several microservices for a single product that deploy regularly to production, you can see the state of those pipelines in one tile. You can easily and quickly investigate how efficient you are being with your resources by displaying agent usage and job queues. 

Dashboard walk-through 

Here's a quick overview of all the tiles on this SquaredUp dashboard for ADO.

The ‘Main branch Build Failures’ tile is a scalar that counts the number of build pipelines that have failed in the last 24 hours. We are also monitoring this tile so that if this number is above ‘0’ then the tile and dashboard will go red. This means you should scope this tile to your most critical pipeline. 

The ‘Build Runs’ tile is a health blocks visualization where each tile is showing the status of a pipeline result. 

‘Build Duration for Main Branch’ is displaying a line graph of the duration of a specific pipeline. 

'Task Failures’ is a Donut visualisation that lets you easily see which tasks are the most common cause of a failure in your pipelines. 

These two tiles allow you to look at the performance of your pipelines by looking at the size of job queues and how many agents are in use at a specific time. 

Get the dashboard

This dashboard is available out-of-the-box, so you can be up and running in minutes.

  1. Create a free SquaredUp account.
  2. Add the Azure DevOps data source.
  3. All OOB Azure DevOps dashboards are automatically added to your workspace, so you can instantly view your live data

To see what other dashboards you can create, check out our Dashboard Gallery.

Read more from our blog

Combine your Azure DevOps data with...

Azure DevOps

Monitor the Builds and Releases from your Azure DevOps environment.

SquaredUp has 50+ pre-built integrations for instant access to data.

Get all your engineering insights in one platform