It's not like it used to be back in the day! Before CI/CD, we were building on-premises, service-oriented products following system style architecture and we were able to map out the build system and end-to-end process in a PowerPoint or Visio document. Although time-consuming and inefficient, it was relatively straightforward and the build pipeline was unlikely to change drastically. But that's no longer the case.
Organizations have switched to servicing SaaS-type applications that connect to multiple clouds in new ways each day. They are made up of ever-changing microsystems deployed straight into production. Continuous implementation and continuous delivery/development (CI/CD) leaves no time for mapping out the build beforehand. Changes are constant and you need to be able to get visibility of all that.
Engineering teams now “own their pipeline”, from the build system they use right down to how those build systems deploy into prod. The “build engineer” is now a Site Reliability Engineer, responsible for not just build, but infrastructure, cloud, and monitoring (historically a job handled by the end customer) too!
With the expansion of builds and role scopes, you need new tools to help you deliver in a new system. Observability of the full CI/CD pipeline is crucial.
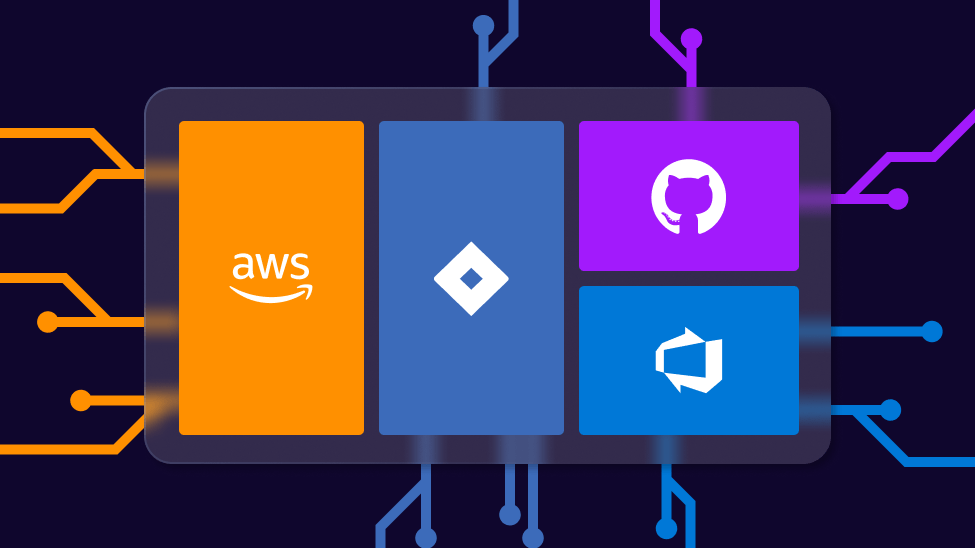
SquaredUp’s enterprise-grade, BI platform for software engineering teams has you covered. With a knowledge graph at its core, SquaredUp connects all your engineering tools and provides analytics on top, so you have complete visibility of everything that matters.
Here's how you get Azure DevOps connected to SquaredUp so you can build a complete view of production health showing everything from build failures to queue length.
Get started with SquaredUp
First, sign up for a SquaredUp account. It takes 30 secs, no card information is needed, and it is free!
When you are logged in, at the bottom left corner click Settings then the plugins tab
On the “Select a Plugin” screen choose Azure DevOps (under the CI/CD group or it can be string searched)
Enter the Display name if you want to change if from the default. This name will be seen in the list of installed plugins. You might have multiple instances of the same plugin configured if you have multiple Azure DevOps companies, for example, so we recommend being descriptive here
Enter the Azure DevOps organization name of the organization you are plugging in (not case sensitive)
Copy and paste a personal access token for the account you will use to connect with. This account will need access to the types of Azure DevOps resources you want to be able to work with in your dashboards (read only). See this for how to create a Personal Access Token in Azure DevOps
Check the workspace checkbox to automatically create a workspace when the plugin is saved. Workspaces are used like folders to group dashboards, scopes, and more. They also have health status which is derived from the health of their contents. A workspace's health can be rolled up and Information from a workspace can be shared with other workspaces using the “KPIs” feature. Find out more about creating KPIs. Hit Save when done and the plugin will begin populating the knowledge graph with information from the Azure DevOps organization.
The workspace that was automatically created should look like the image below. This gives you a little flavour for the sorts of data pulled into the knowledge graph from your Azure DevOps organisation.
Build a Production Deployment Health dashboard
To get visibility into production deployment health, we will create a Production Deployment Health dashboard and create tiles in it to show:
Build failures
Build runs
Average build durations
Failures by pipeline stage
Build runs
Job queue length
Agent usage
Build durations
With all this data at your fingertips, you will be well equipped to assess the overall health of what feeds production and so be able to act quickly when things go wrong.
Create a dashboard
Start by creating a blank dashboard, and don’t forget to give it a name. To do this, hit the plus icon next to Dashboards. We will then follow these steps for each tile.
Configure your first tile – Build failures
We are going to start by creating a “Build failures” tile.
Hit the plus button in any area of whitespace on your dashboard to create a new tile. Call the tile “Build failures in master” then click Configure.
You are now asked for a Scope, Data Stream, and Visualization. A scope is much like it sounds, a subset of the data from a plugin. Scopes, once created, can be used for multiple tiles, are stored within each workspace, and can be viewed by clicking the Scopes item under Graph. Select the Azure DevOps plugin, then scope to project(s) or build pipeline(s) that you want to see build failures from. For this example, I will show build failures from all Build Pipelines.
Once a scope has been selected, the list of data streams is shown. Click Build failures.
The list of visualizations available is now shown. The default will be blocks. Take a moment to click through available visualizations to see how the data is displayed, then select Scalar and you will be presented with something like the below (assuming you have failed builds):
Let’s now discover how we filter, group, and sort the data returned. Click the Configure button next to the Build Failures data stream and you will see sliders to configure these options. Slide filtering to on. For this example, we will filter on builds from our master branch only. So, under Filter Options, select Source Branch, then select Equals, then enter your master branch name (ours is refs/heads/master). Finally, hit Done.
If we click Save and Close, we have our first fully configured tile. Easy!
Configuring the rest of the dashboard
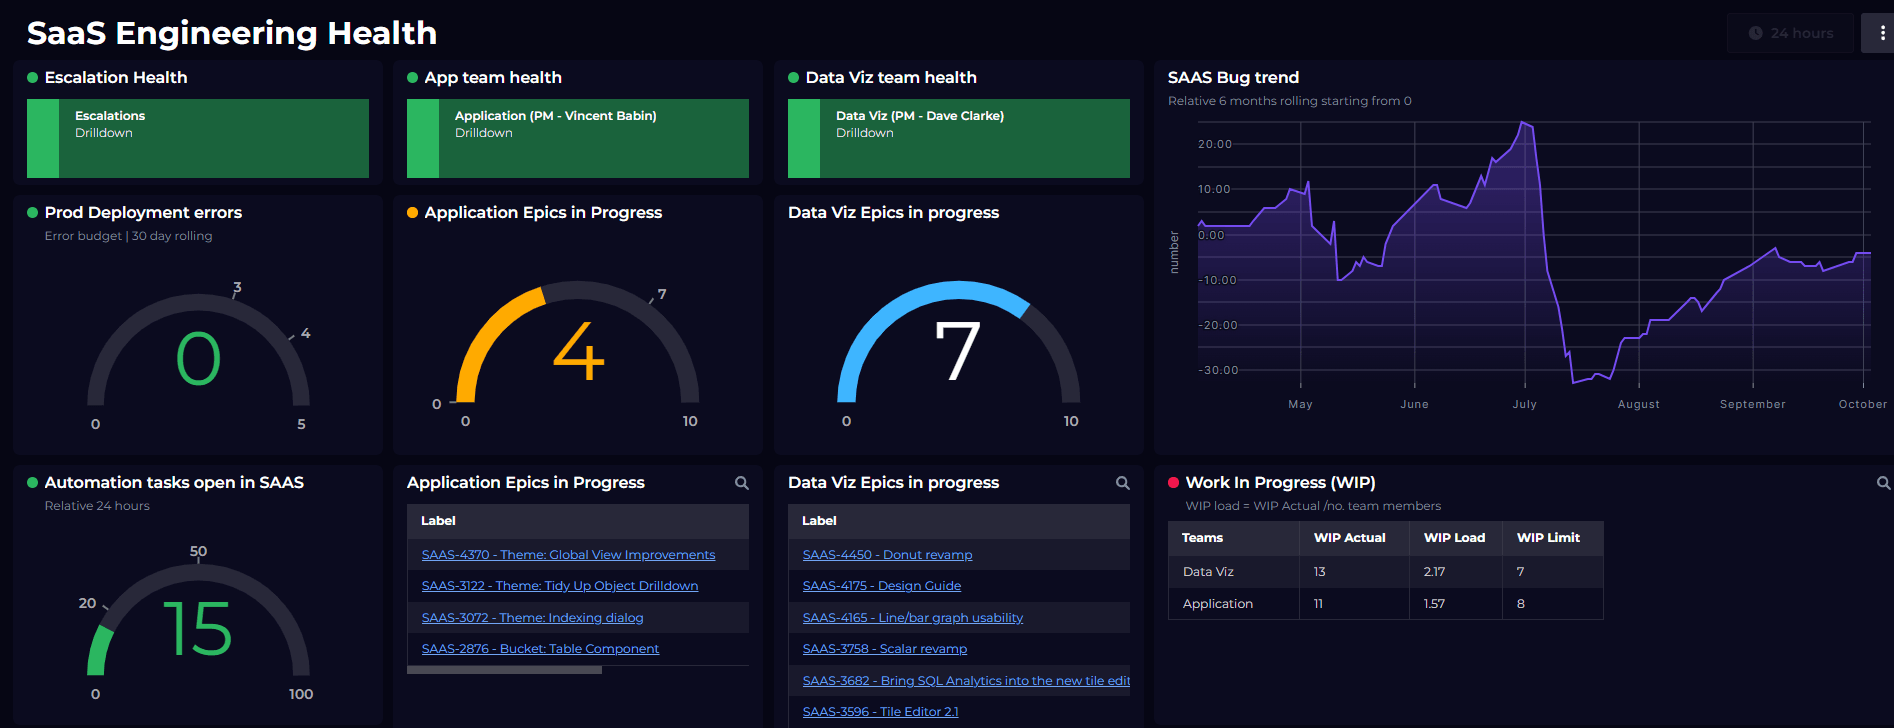
The process for configuring the other tiles is very similar but with different scopes, filters, and visualizations. The result will be something like this:
To finish building this dashboard, follow the same steps as for the first ‘Build failures’ tile, but with the below configuration:
Build Runs
Scope: either to Project(s), Build Pipeline(s) or Release Pipeline(s)
Data Stream: Build Runs
Visualization: Scalar
Filtering/Grouping/Sorting: None
Average Build Duration for Master
Scope: either to Project(s), Build Pipeline(s) or Release Pipeline(s)
Data Stream: Build Runs
Visualization: Line Graph
Filtering/Grouping/Sorting:
Filter on the “Source Branch” that equates to your master branch
Group by “Start Time (by day)” Aggregate by column “Run Duration” type “Average”
Build stage failures
Scope: either to Project(s), Build Pipeline(s) or Release Pipeline(s)
Data Stream: Task Failures
Visualization: Donut
Filtering/Grouping/Sorting: Group by “Task Name” with Aggregate column “Task Name” and type “Count”
Build Runs
Scope: either to Project(s), Build Pipeline(s) or Release Pipeline(s)
Data Stream: Build Runs
Visualization: Blocks
Filtering/Grouping/Sorting: None
Job Queues
Scope: either to Project(s), Build Pipeline(s) or Release Pipeline(s)
Data Stream: Job Queues
Visualization: Line graph
Filtering/Grouping/Sorting: None
Agent Usage
Scope: either to Project(s), Build Pipeline(s) or Release Pipeline(s)
Data Stream: Agent Usage
Visualization: Bar Chart
Filtering/Grouping/Sorting: None
Builds for Master Branch
Scope: either to Project(s), Build Pipeline(s) or Release Pipeline(s)
Data Stream: Build Runs
Visualization: Blocks
Filtering/Grouping/Sorting: Filter on the “Source Branch” that equates to your master branch
How to configure timeframes
One thing I have yet to touch on is the timeframe you wish data to be returned for. You will notice that in the top right corner of each tiles configuration, there is a clock icon, when clicked the timeframe that data is returned for can be set, the default being “Use dashboard timeframe”:
When viewing a dashboard, you will notice a similar clock icon in the top corner which changes the timeframe for all times set to “Use dashboard timeframe”:
Generally, tiles are most effective when set to ‘Use dashboard timeframe’, but there are times when you want to see less/more data. You will see, for example, that the above dashboard shows Job Queues for the last 30 days so you can see whether queue length is trending up. If the tile timeframe was 24 hrs, which is the same as the rest of the dashboard, this would likely be lost.
Monitor your CI/CD pipelines with ease
Now you can create your own dashboards that will give you full CI/CD pipeline observability and monitoring.
To make it even easier to get started, we offer out-of-the-box dashboards for certain CI/CD tools: