Ben Hawthorn
Software Engineer, SquaredUp

Getting started with SquaredUp is free and easy. Our free tier includes:
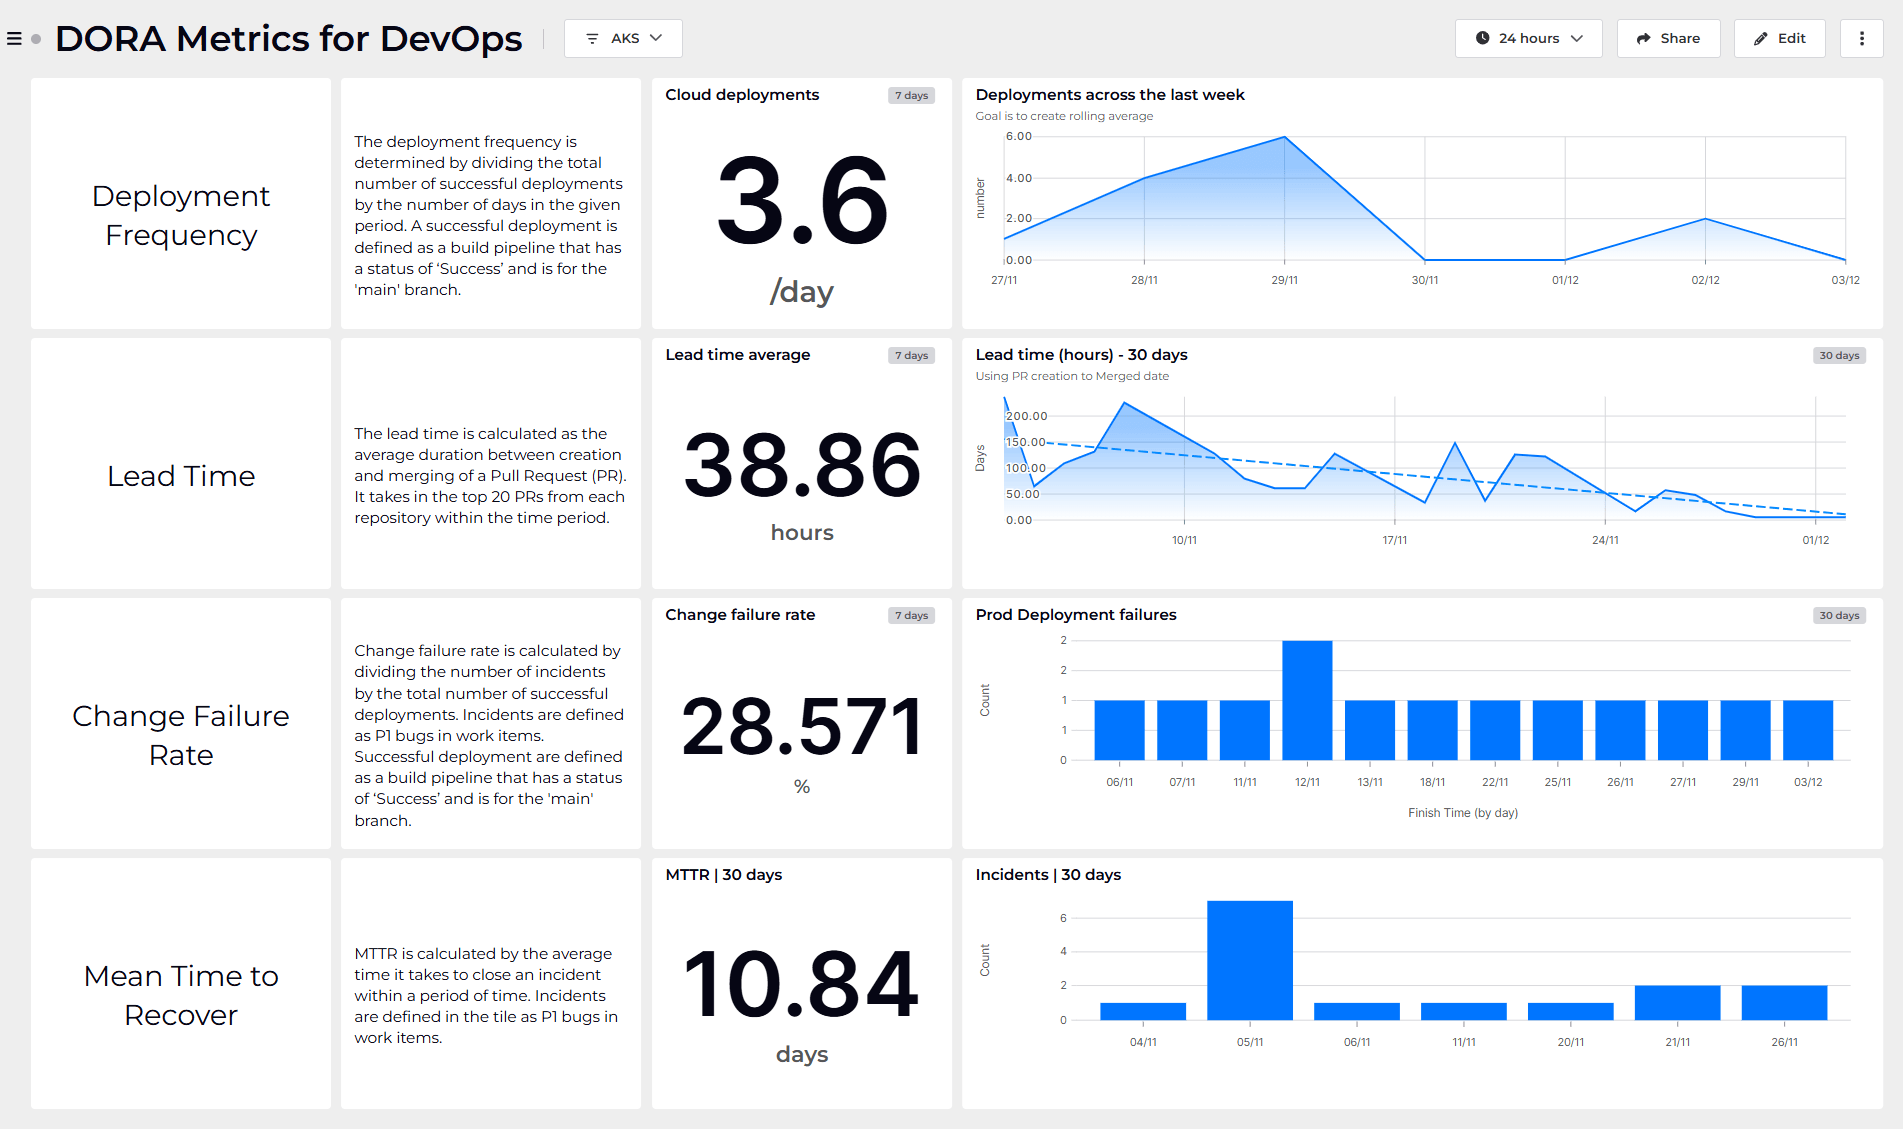
This CircleCI dashboard provides an overview of all projects in your CircleCI organization, as well as some high-level insights for workflows such as total runs, average duration, and success rate.
Software Engineer, SquaredUp

CircleCI allows you to view some statistics within their app but it’s fairly restrictive in presenting the data. For example, while your DevOps team can see statistics around total runs and success rate, they can’t display these metrics on a line graph.
In addition, there’s no way to monitor or alert on these metrics, such as credits used or duration. Being able to alert on these metrics might warn you of a problem before racking up a big bill. Plus, only CircleCI users can see the data held in CircleCI and there’s an additional cost for every CircleCI user added.
With the SquaredUp dashboard for CircleCI, you can display the relevant data using different types of visualizations, like scalars, tables, and line graphs. Now you can monitor project status so users can be notified of failing pipelines/workflows and avoid racking up big bills without warning. Plus, you can make the SquaredUp dashboard available to the wider team without needing individual CircleCI licenses.
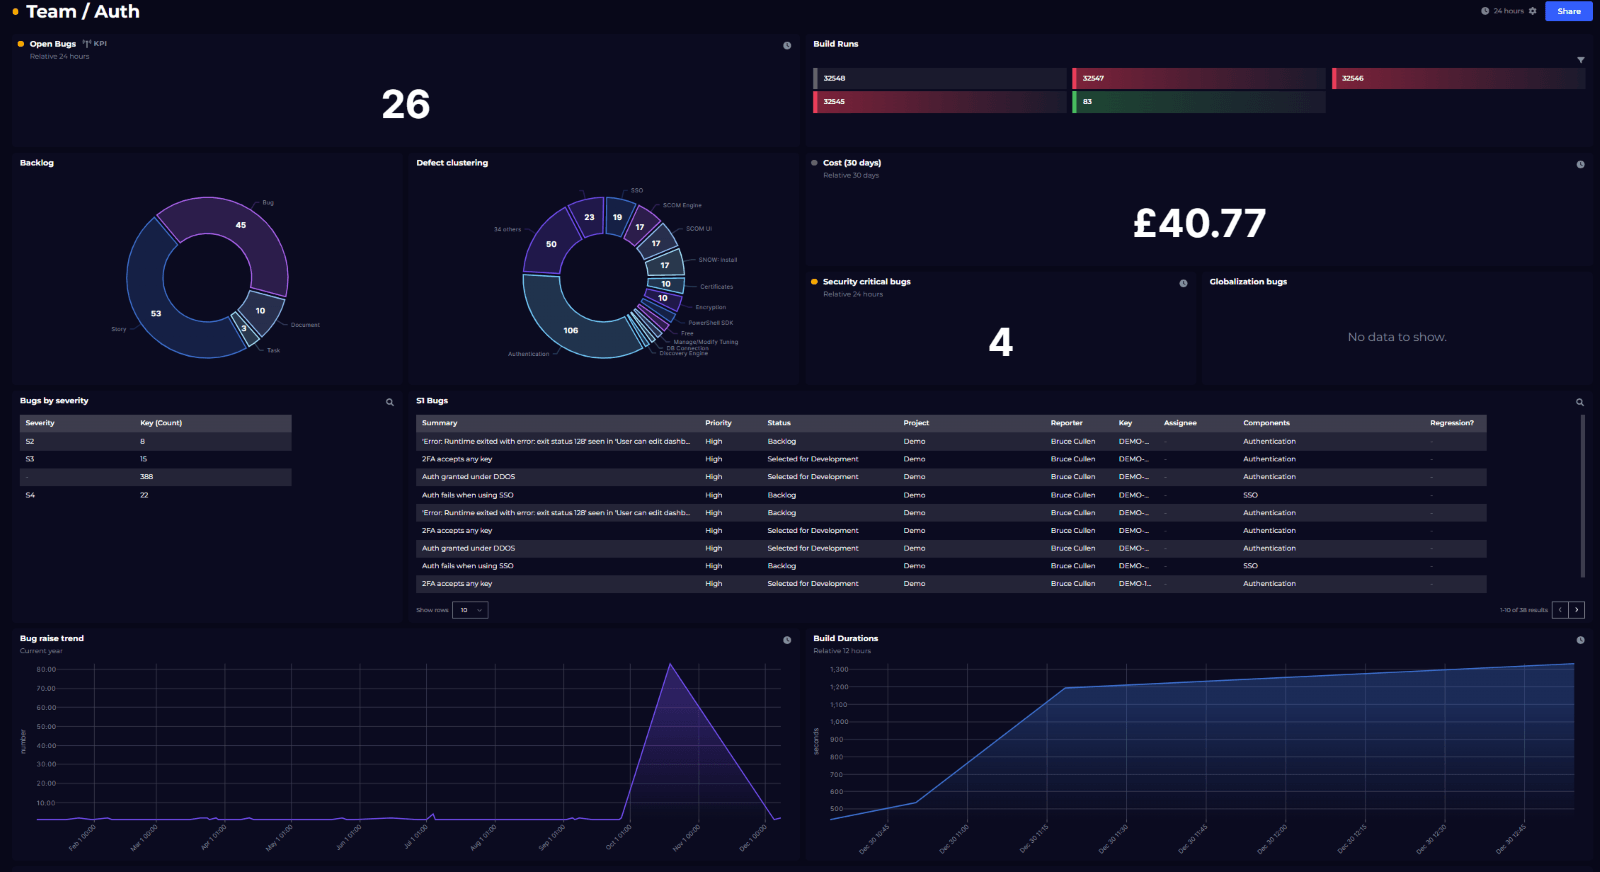
This SquaredUp dahboard shows multiple helpful metrics from CircleCI.
Along the top, you can see:
In the middle row is:
At the bottom is:
This dashboard is available out of the box, so you can be up and running in minutes.
To see what other dashboards you can create, check out our Dashboard Gallery. We also offer an out-of-the-box Azure DevOps dashboard you may be interested in.