Stephen Townshend
Developer Advocate (SRE)

Developer Advocate (SRE)
DORA metrics, not to be confused with the beloved children’s cartoon character, are a bit trendy at the moment in the world of technology.
The DevOps Research and Assessment group (DORA) is run out of Google. They run surveys and do research into what makes organizations successful in the Digital Age. They’re probably most well known for their yearly State of DevOps Reports and the book Accelerate.
Along the way, DORA has identified five key indicators which show a strong correlation with high performing organizations:
The theory is that we can use these five metrics to get a sense of how effectively we are building and operating our technology services, and perhaps more importantly, track how that changes over time.
But DORA metrics are not a concrete framework that you can mindlessly apply to any situation. They are, ultimately, a starting point for discussion. In this article I’m going to explore some of the considerations to take into account when using DORA metrics within your teams and organizations.
Every organization and every team is unique. What matters to one team may be less important to another, and this is constantly shifting and changing over time.
One of the greatest lessons that Site Reliability Engineering (SRE) has taught me is that every framework or approach needs to be adapted to your unique context in order to get real value out of it.
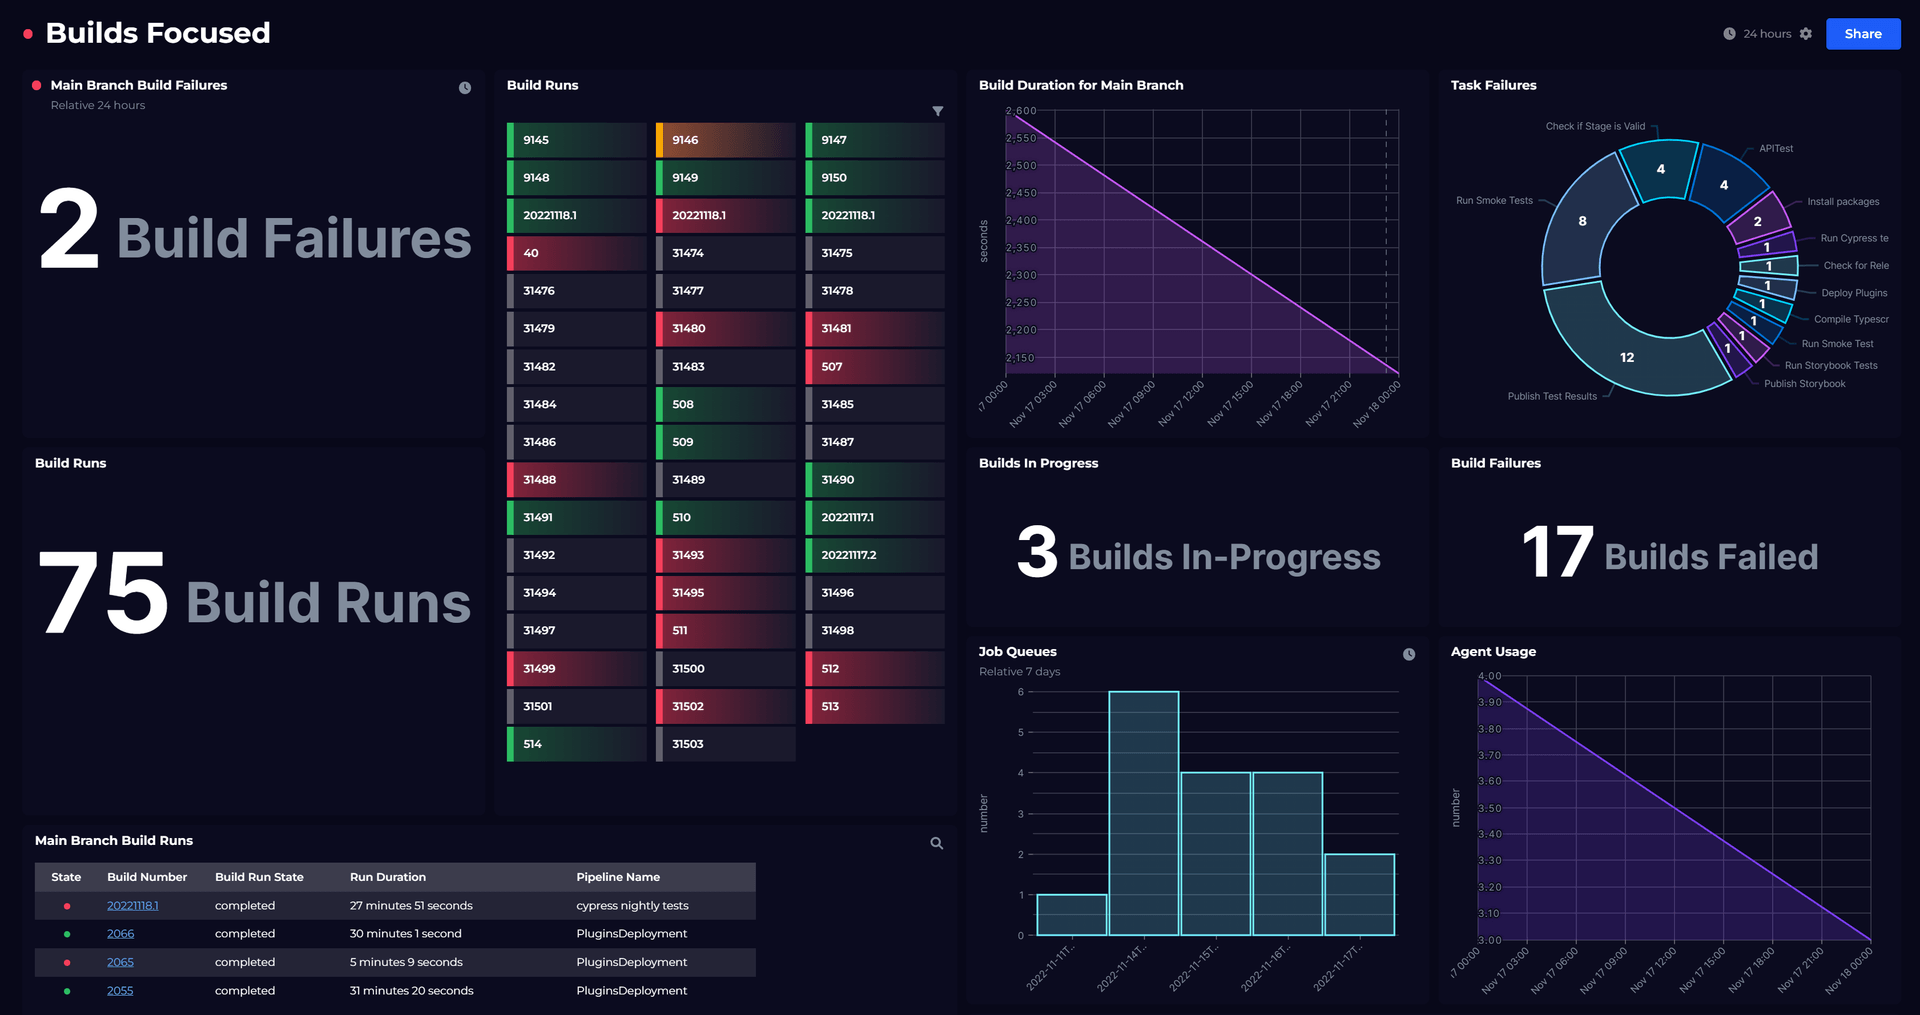
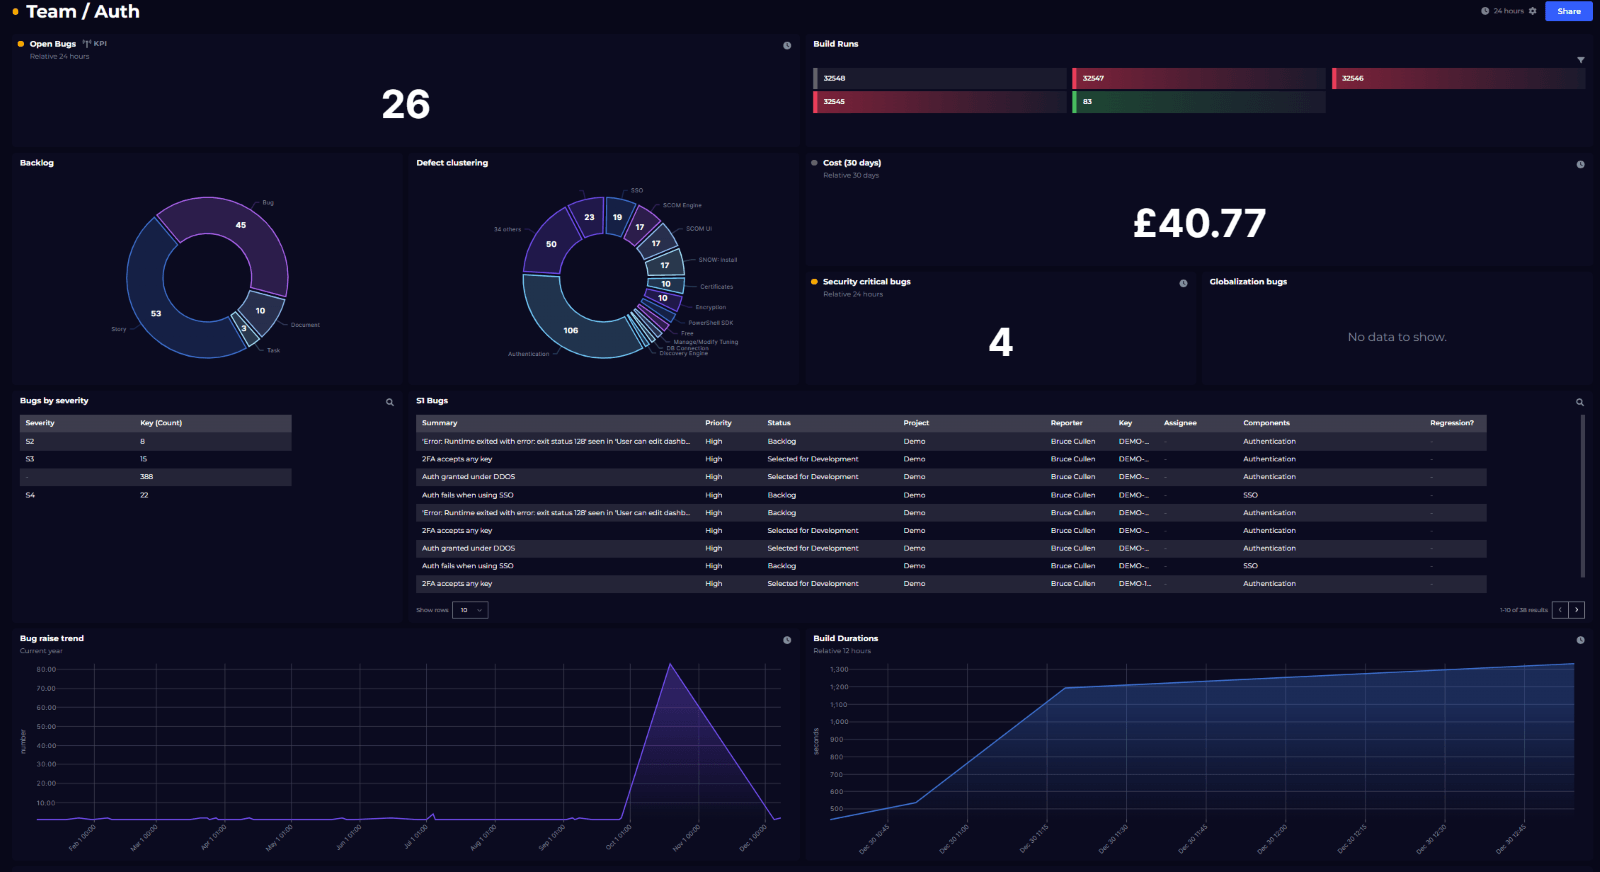
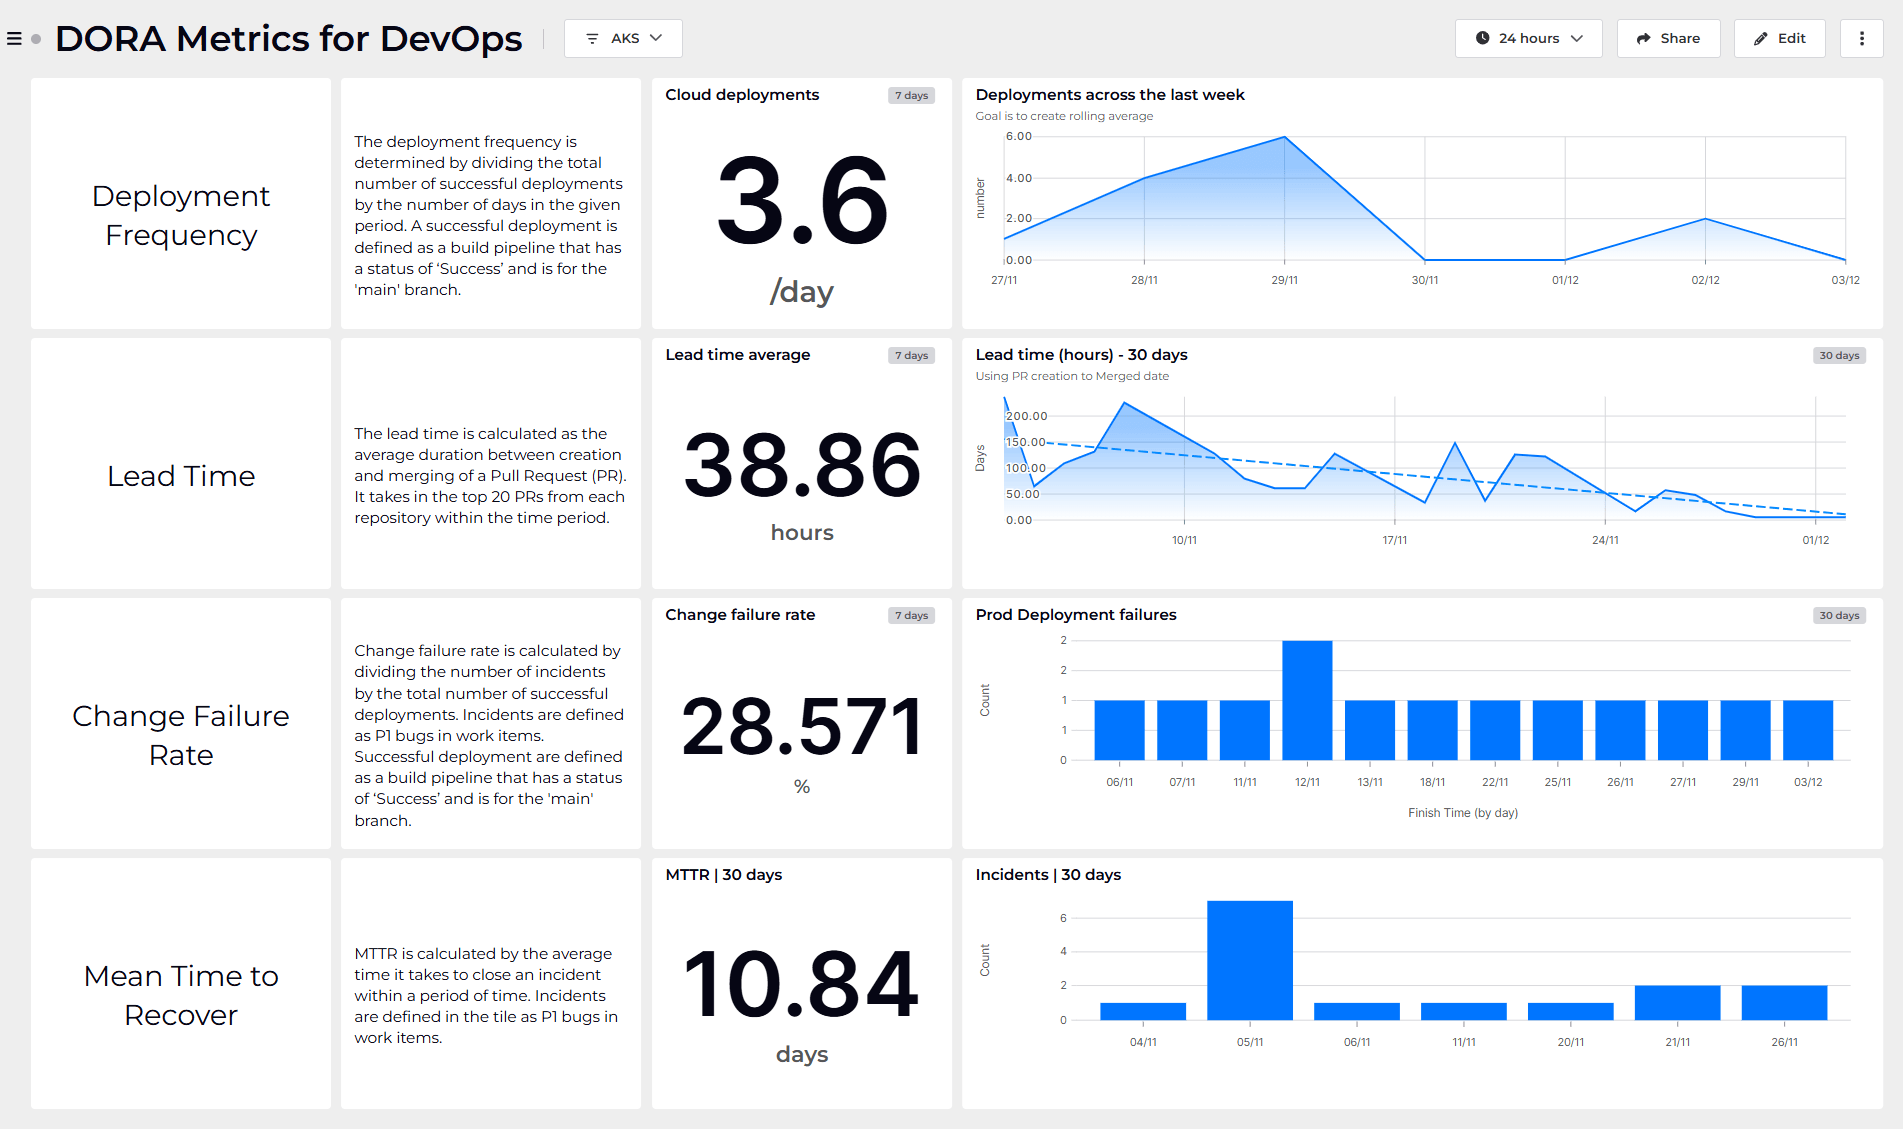
I have a concrete example of this. My colleague, Tim Wheeler, recently went through the process of setting up continuous monitoring of DORA metrics internally at SquaredUp. See his DORA metrics dashboard here.
SquaredUp is going through a period of rapid and continual change, both to our product and our organization. Tim wanted a way to assess how effectively our engineering teams were adapting to that change. At the time Tim set this up, the SquaredUp cloud product had experienced maybe one or two what you could possibly consider a major incidents in the last year. There really wasn’t enough data to calculate a meaningful metric, or one that we could act on.
So, Tim adjusted our interpretation of DORA metrics to adapt to our unique context. We weren’t experiencing major outages, but we were making constant changes to production (multiple times a day), and sometimes those changes impacted our customers in a negative way. When this happens, we would raise an “escalated ticket”, which is our highest priority defect. So instead of tracking the time to recover after a major incident, we started tracking how long it was taking us to resolve escalated tickets.
As I said, I think taking a framework like DORA metrics but adapting it to your unique context is absolutely key to getting real value out of it (and isn’t done enough).
Mean Time to Recover (MTTR) is a ubiquitous metric in the industry, but it's one that we have to be careful about. Courtney Nash in her SREcon22 Americas talkTales from the VOID: The Scary Truth about Incident Metricsessentially dismantled “MTTR” (mean time to recovery) as a useful or meaningful metric.
Courtney found, by analysing the Verica Open Incident Database (VOID), that there was no correlation between MTTR and how mature incident management practices were, how frequently incidents occurred, how severe they were. Or anything at all.
Part of it comes down to statistics. In a nutshell, using the average value of anything is only a reasonable indicator of what’s happening when the events you’re measuring follow a normal distribution. Courtney’s analysis showed that incident duration both within and across organisations universally showed a skewed distribution.

This is going to be a little challenging to accept for some, but Courtney has effectively proved that MTTR is a meaningless and unhelpful metric. Yet, outside of the SRE community, it is still used pervasively. Managers and executives around the world have bonuses and incentives attached to whether or not they bring MTTR down, and MTTR is the metric most people use when calculating DORA metrics for tracking the time taken to recover from major incidents.
This is exactly the topic I banged on about for over a decade as a performance engineer, how using average (and even percentile) response time metrics was misleading and unhelpful in many situations.
So, what can we measure when it comes to tracking how long it is taking us to recover from incidents? The answer is, unfortunately, it’s complicated. I chatted to Courtney recently as part of the Slight Reliability podcast and her advice was that it’s not about tracking a single metric, we have to let that go. What’s more important is to look at customer feedback, how many people and tools are involved in managing incidents, whether there are themes or narratives related to your incidents, and to pay attention to your near misses (situations that almost led to an incident). It’s so tempting to have this simple metric that we can report and feel good about, but it’s truly not helping anyone.
This makes calculating “time to recover from major incidents“ an extremely difficult (if not impossible) DORA metric to calculate. Perhaps it’s not about coming up with a single metric, but instead the value is in questioning for yourself how long it’s taking you to remediate incidents and whether you can improve your incident management processes.
Leveraging what I used to do in performance testing, one possible approach would be to look at scatterplots of the raw data to see how long it took to recover from incidents over time. This won’t give you a nicely packaged metric that you can report, but it does give you a visual overview of all the incidents you experience and whether there’s any patterns or themes that you can investigate.

The “lead time” metric in particular raises questions for me.
Lead time is defined as the time from code commit until it is running in production, but what if the bottleneck your organization has is further upstream?
For example, I’ve been in situations before where the time between identifying a need or opportunity and then delivering that to production has exceeded a year… yet it was only taking days or weeks to go from code commit to production. In this situation the organizational bottleneck is nothing to do with the release or deployment process, but in the analysis, design, and decision making that occurs earlier on.
In this situation, is it possible to expand the scope of lead time? And if we did, how would we measure it? Because if it’s taking 10 months before an important feature even gets in front of developers, then to me that’s the bottleneck I want to measure (and alleviate).
At a higher level, I wonder whether DORA metrics could or should be applied specifically within the context of technology, or if they are equally as applicable to the wider context of an organization? I don’t have an answer, but I think it’s worth a conversation.
With anything we monitor, we want the data we collect to be accurate and meaningful. But sometimes the thing we really want to track is difficult or impossible to monitor directly.
Take the example of change failure rate. The concept sounds simple enough... we want to know what % of deployments cause degraded service to our customers. But when it comes to actually getting the data, it gets messy.
It's easy to see when a deployment fails, but what about deployments which go ahead but subsequently cause issues for customers?
In an ideal world we would want to know about any time that a change we make to production impacts any of our customers in a negative way. But how do you measure that? How do you define "degraded service" for customers in a non-fluffy way? And when customer service is degraded, how do we know if it was a deployment that caused it? And if so, which deployment?
Perhaps compromises need to be made. You could, for example, decide that every incident or customer ticket raised within 30 minutes of a deployment is automatically attributed to that deployment. That flies in the face of accuracy, but it's measurable... so is it good enough to use?
It's about finding that sweet spot. What can be measured? And what indicators can we use which tell us about what we really want to know about as closely as possible?
The worst thing you could possibly do with DORA metrics is to weaponize them. In other words, to use them as a carrot or a stick regarding performance reviews or financial incentives.
They are not an accurate measure of how effectively you are building and operating technology. They are simply a starting point to begin the discussion. Whatever you find when you calculate them, the only value is in reflecting on where you are at and where you want to go.
As soon as you bundle DORA metrics (or any metric) with performance reviews and incentives you encourage weird behaviour. People will game the system, and how can you blame them? Decisions will be made that support shifting a metric in the short term, even if it hurts the organization in the long term. This is, unfortunately, prevalent across the industry. We became obsessed with being “data driven organizations”, even if the data we tracked was inaccurate or meaningless.
So… with all the caveats and exceptions I’ve raised, is it worth calculating or continually monitoring DORA metrics?
To me, the answers is that if it helps you to better understand your teams, organization, and how you build and operate technology services… then yes.
As Tim put it when I asked him about tracking DORA metrics internally at SquaredUp – perhaps the most valuable thing of all was the discussions we had about what each metric meant to SquaredUp. Because it forced us to think about what success looks like, and how we could measure it.
As long as you take them for what they are – a starting point for discussion, then I think they are a useful tool to be applied whenever you think they could add value.
To hear directly from Tim Wheeler about his work implementing DORA metrics, check out Slight Reliability podcast episode 53: DORA metrics with Tim Wheeler.
Alternatively, check out the DORA metrics dashboard Tim created.
Developer Advocate (SRE)

Monitor the Builds and Releases from your Azure DevOps environment.
Dashboard Story
Dashboard Story
Dashboard Story

Here's what our free tier includes: