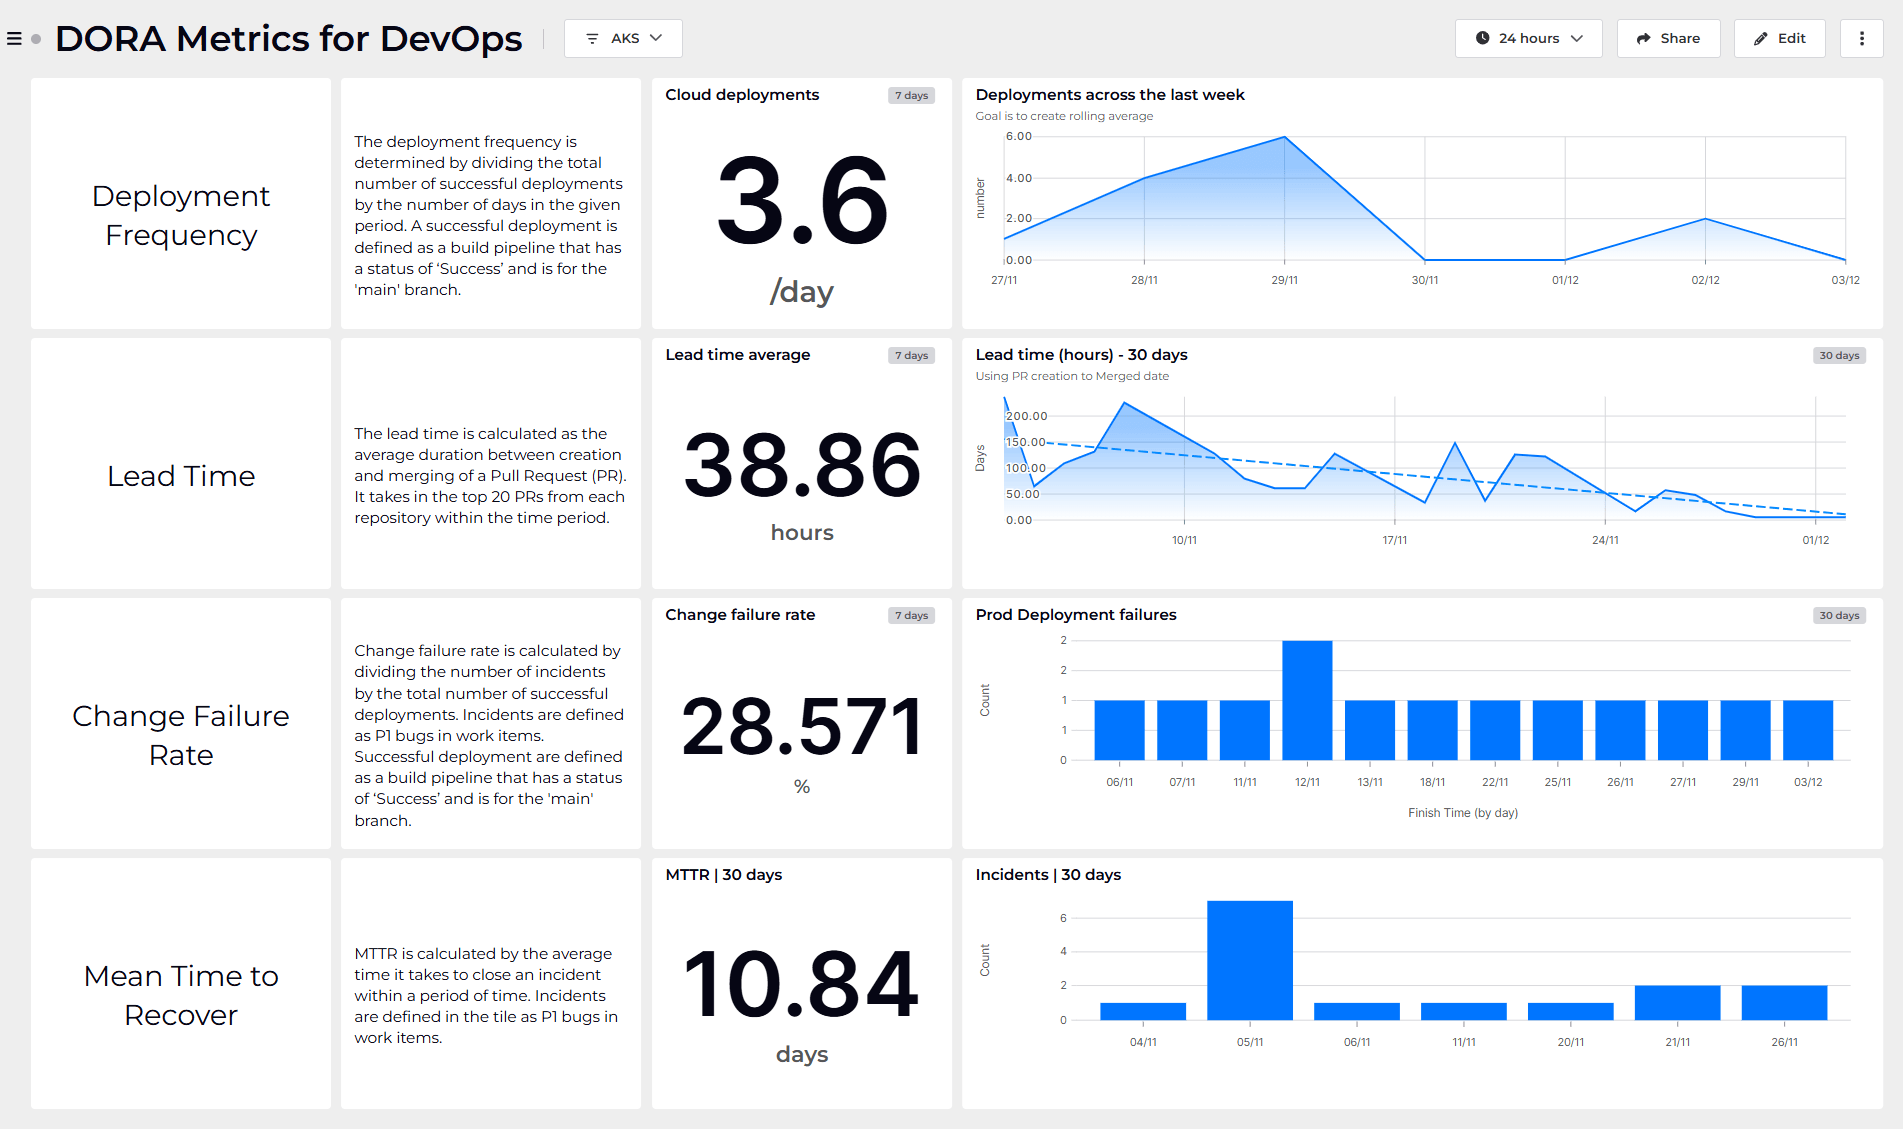
Grafana is an open source tool widely used by DevOps teams for dashboarding key metrics and data related to their applications and services.
However, as your usage of Grafana grows, you might find rolling up status from multiple applications or different DevOps teams challenging. And typically, your Grafana dashboards are too low-level to share with your manager or Executive team.
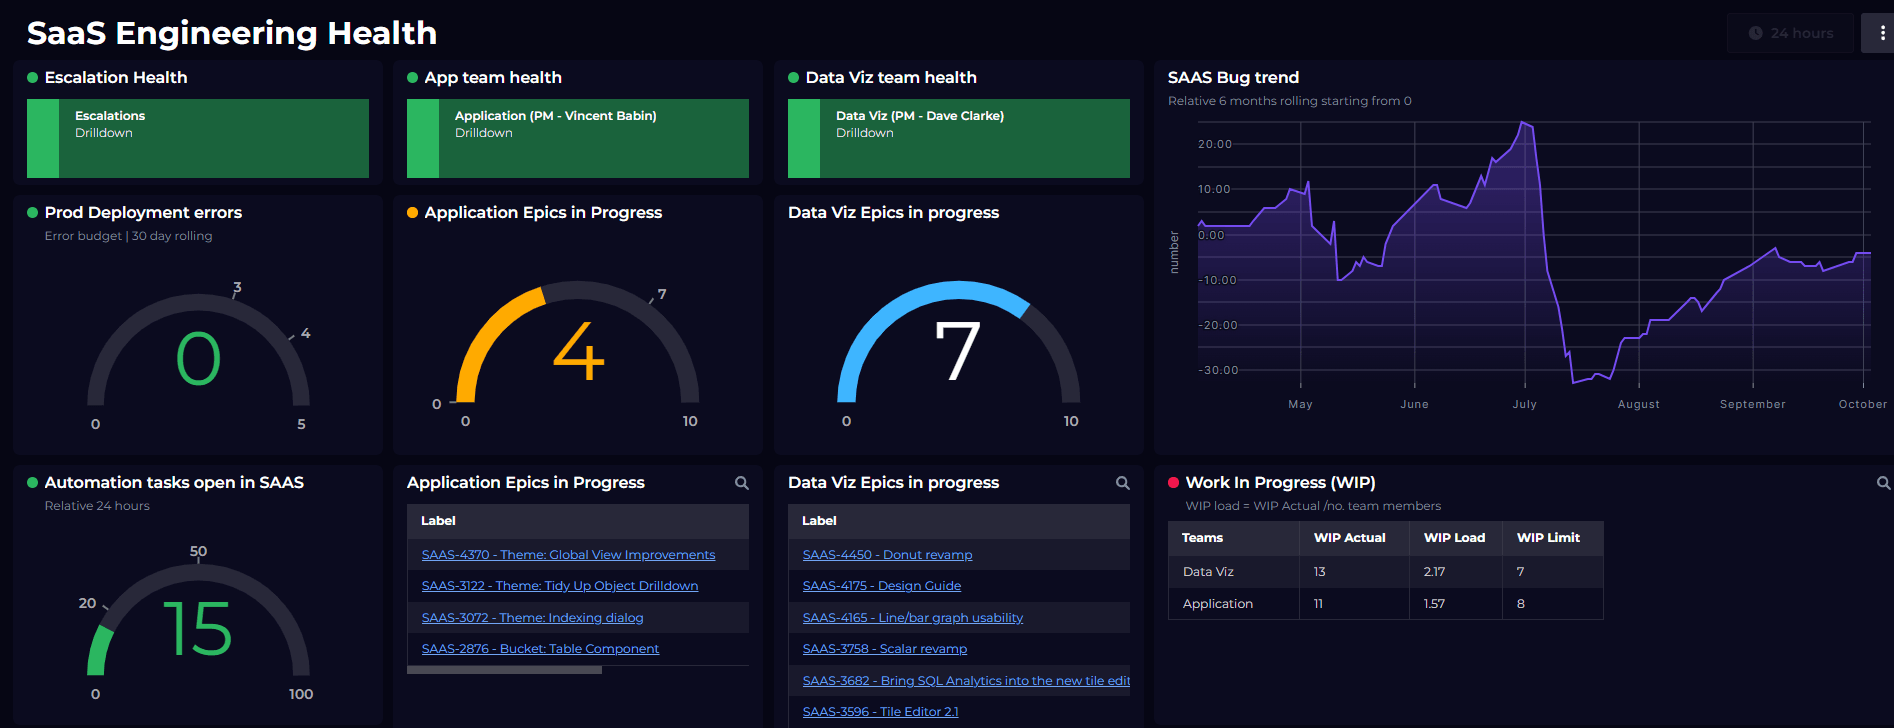
For that management audience, you’ll want to deliver high-level health rollup and statusat a glance, as opposed to lower-level observability data.
Enter the SquaredUp observability portal
SquaredUp’s observability portal models the relationships between your services and rolls up their health to a simple red/green dashboard that's suitable for an executive-level view.
Using the power of this connected knowledge graph, there are a few ways you can aggregate and roll up data from Grafana inside SquaredUp:
- Roll up health status from multiple Grafana dashboards to a single measure of health—e.g. representing the overall health of an application
- Aggregate health from multiple services into a health status that represents the application as a whole
- Rollup health status from multiple Grafana instances across multiple teams
- Share Grafana health status with someone who doesn’t have direct access to Grafana
Getting started
Creating an account and getting started with SquaredUp is simple. Just head over to app.squaredup.com to get started for free.
Once you’ve created and verified your account, you’ll be able to quickly plug into your Grafana instance and start dashboarding! Let’s walk through this process.
Step 1: Connect SquaredUp to Grafana
To connect SquaredUp to Grafana we simply use a Grafana API key with read-only (Viewer) access — this allows SquaredUp to read the dashboards, their health status and any alert rules.
Generating a Grafana API key
- Login to Grafana
- Browse to Settings → API keys
- Generate a new key with Role: Viewer, and note down the value
Configure the Grafana plugin
Next, we’ll setup the Grafana plugin within SquaredUp. This is as simple as pasting in the API key you noted down earlier.
- Login to SquaredUp
- Browse to Settings → Plugins → Add plugin
- Select ‘Grafana’ from our plugin gallery of 50+ plugins
- Follow the steps to configure the plugin
- Once the plugin is added, a new workspace will be created showing everything we’ve found from Grafana, e.g. your dashboards, alert rules and so on
Step 2: Create your workspaces
Now that you’ve connected to Grafana, you’ll want to start organizing your dashboards into what SquaredUp calls Workspaces. A workspace might represent a single application, service, team or platform — it’s up to you. In this example, we’re going to create a workspace for each microservice that makes up our application.
- Select < WORKSPACES from the main menu
- Create a new workspace (+), e.g. my-service and add a new dashboard
- Add some tiles to your dashboard showing the Grafana status
- Dashboard Health
- Alert Rules
Step 3: Enable monitoring
Now that you’ve created your dashboards, you’ll want to enable monitoring. Monitoring powers the health rollup between your dashboards and workspaces.
- Edit the dashboard you created in the previous step
- Enable monitoring for the Dashboard Health tile
- You’ll see the dashboard and workspace health change colour as rollup kicks into action
Step 4: Create your boss’s dashboard
Having created workspaces for each of your services, you can now create a top-level workspace to show the status for each service.
- Create a new Overview workspace
- Add workspace dependencies for your apps
- Boom. You’re done! ?
Step 5: Taking it further with KPIs
While rolling up the health state from your low-level Grafana dashboard might make your boss happy, we could take this even further using KPIs. In SquaredUp, KPIs can be published by each workspace, e.g. each individual surface, and then aggregated at the higher level.
For example, for each service we could publish a cost per service and then sum them up to provide a total cost. Or perhaps we'd like to publish a count of Alert rules that are failing. Let’s look at that:
- Via Settings → KPIs, create a new KPI called Alerts
- On each service dashboard, create a new tile showing a count of failing alert rules
- Publish this tile to our new Alerts KPI
- In our Overview workspace, create a new tile showing the Alerts KPI
- This tile now shows the count of Alert Rules that are failing for each service, and will automatically update as and when the Grafana alert rules change state!
Getting more out of SquaredUp
Getting that rollup running is a great start, but it’s just that… a start. Here are a few other things you could try:
- Configure additional KPIs for each service to report and aggregate on more metrics such as Cost or SLOs.
- Explore our plugin gallery of 50+ plugins to connect to other tools beyond Grafana such as AWS Cloudwatch, CircleCI, Azure DevOps and more.
- Browse the SquaredUp Demo Workspace for demos of all our visualizations and other datastreams that might be available.
- Browse our Knowledge Base for information on setting up the Grafana plugin.
Good luck, and happy dashboarding!
Visualize over 60 data sources, including: