Get started in seconds
Getting started with SquaredUp is free and easy. Our free tier includes:
- 2 users
- 3 data sources
- 10 monitors
- Unlimited dashboards
Getting started with SquaredUp is free and easy. Our free tier includes:
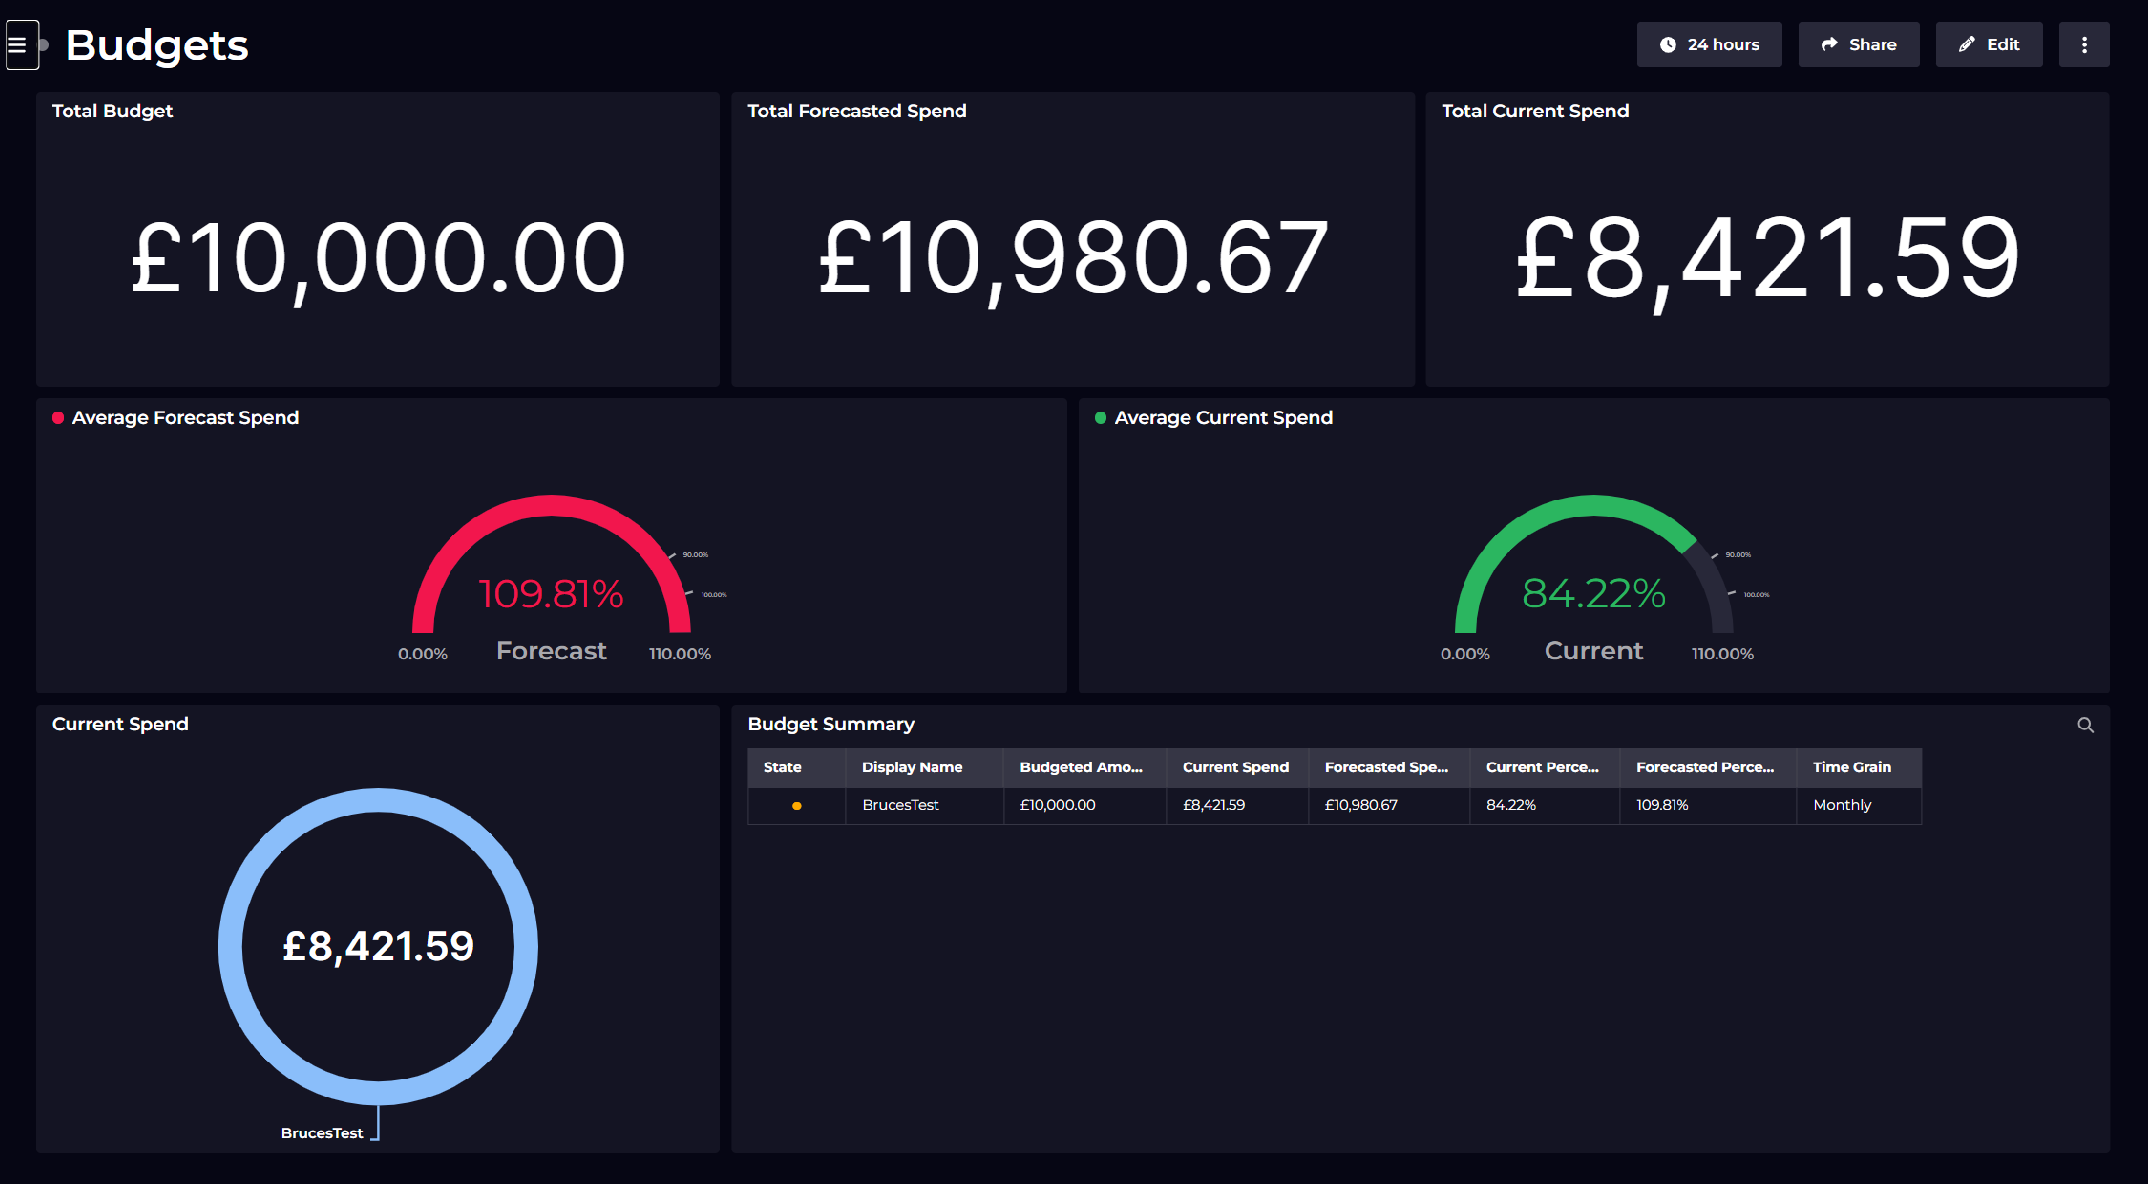
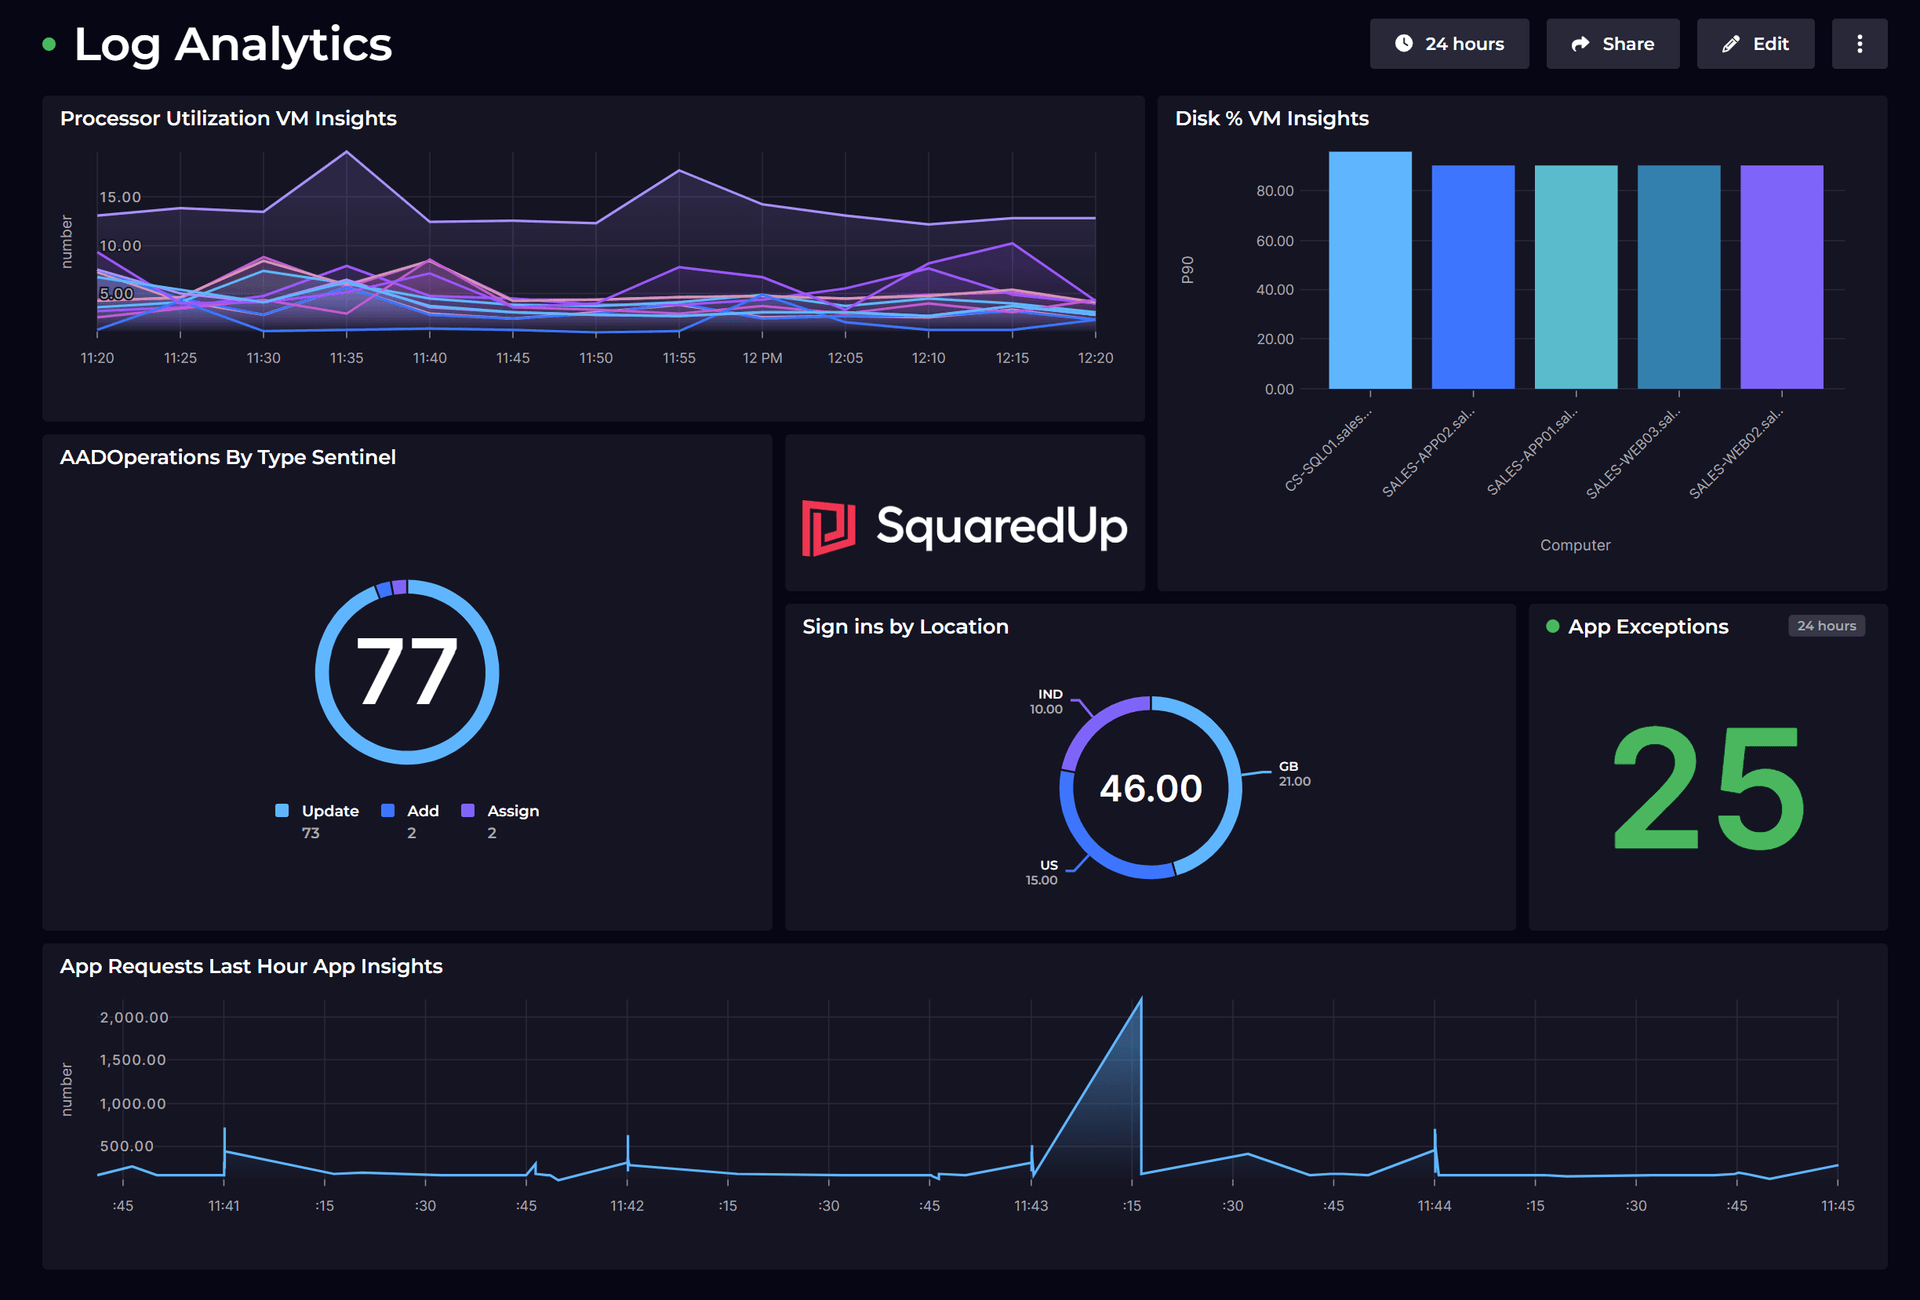
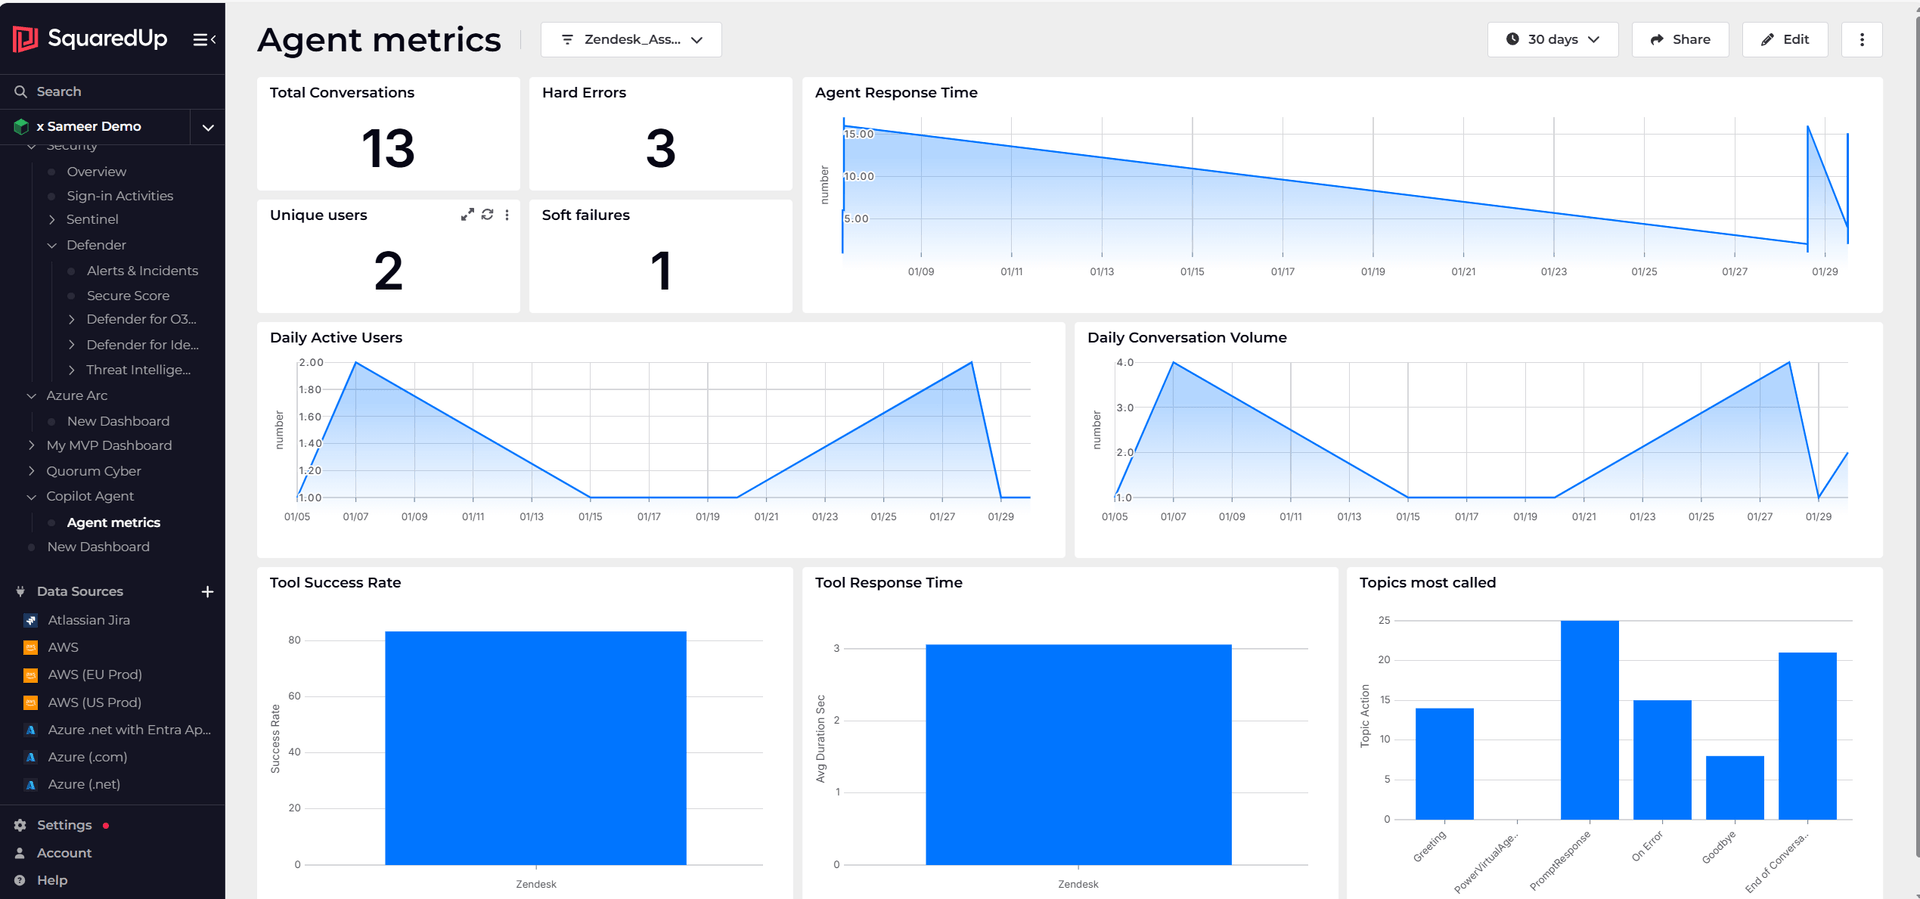
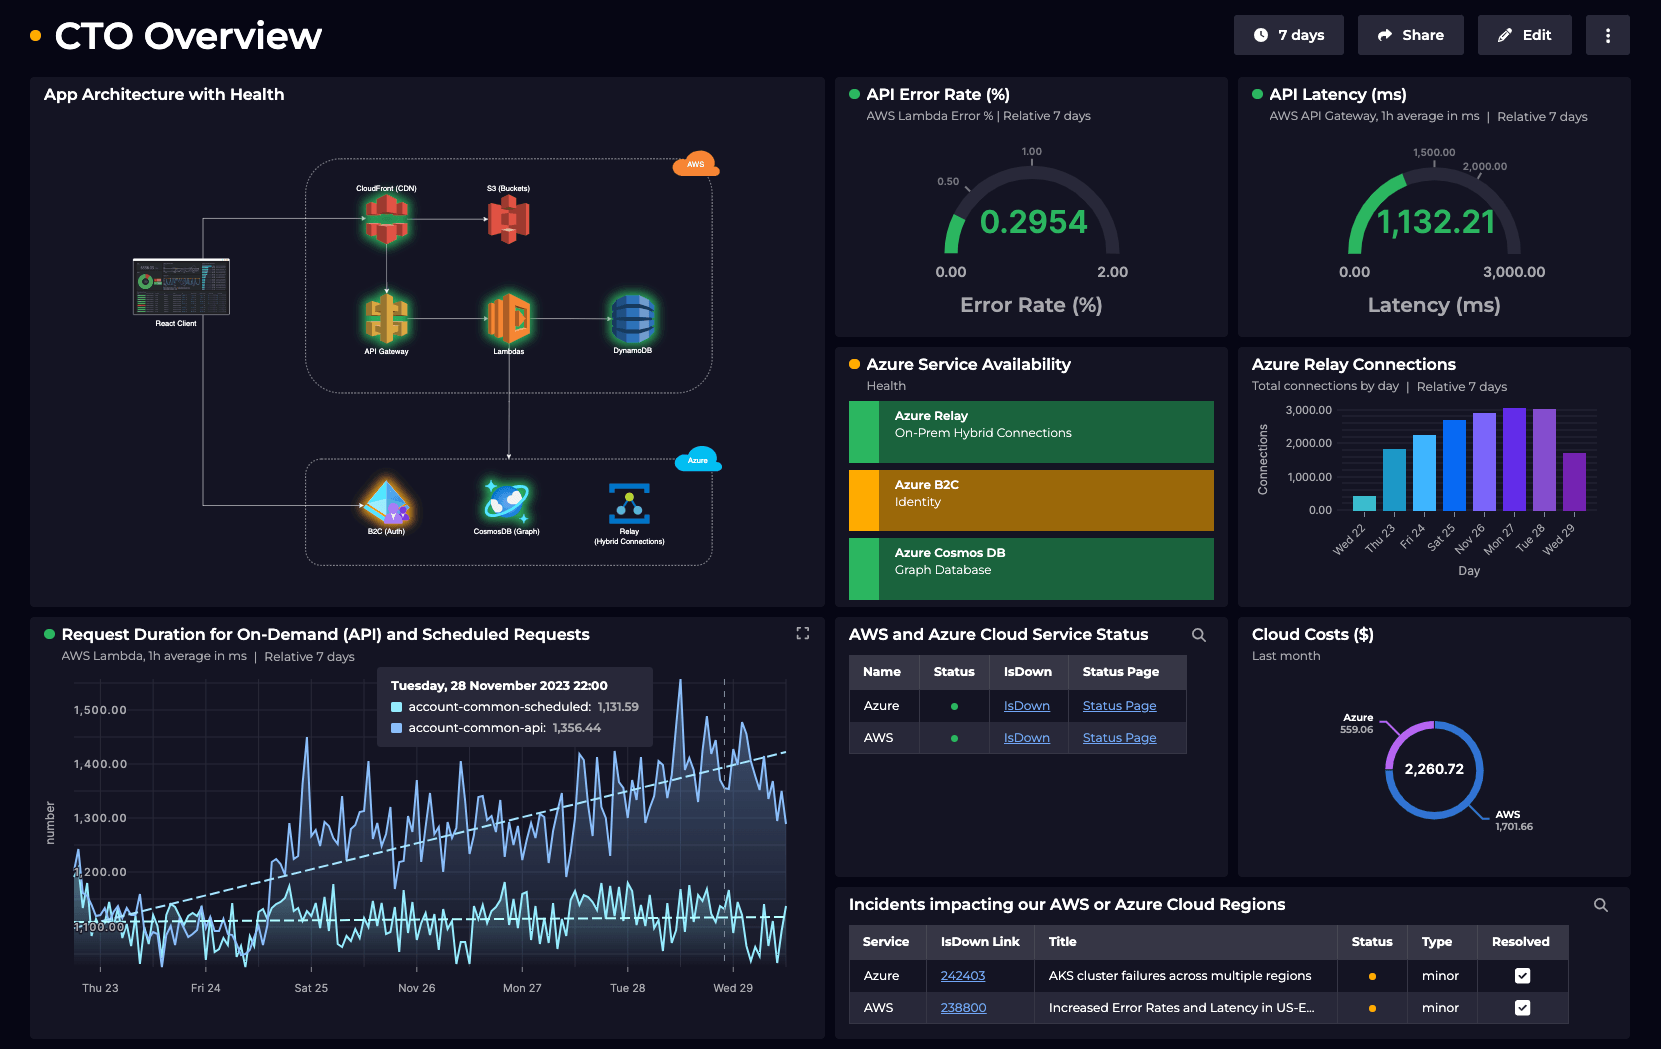
SquaredUp is the smart dashboard that makes it easy to visualize, monitor and share Azure data in minutes.
Get started free


Thanks to my dashboards in SquaredUp, we can have discussions based on facts, not fiction.

In this article we discuss how you can create useful Azure dashboards using the Azure plugin in SquaredUp.