
Sameer Mhaisekar
Developer Advocate, SquaredUp


Join me on my Azure Monitor journey as I learn all there is to know about the platform. Check out my intro note for a brief series overview and a bit about me (tl;dr former SCOM admin, avid tech blogger, SquaredUp tech evangelist).
Now that we’ve talked a lot about how to monitor your Azure resources, let’s talk about how to monitor Azure itself. As the classic statement goes, “there is no cloud – it’s just someone else’s computer” – and all computers can go down. Even Microsoft’s. So how do you know when poor availability or performance of your resources is actually a result of Azure itself being sick?
Azure Service Health is a free offering from Microsoft that enables you to track the health of Azure services in the regions where your deployments are. It keeps you informed about the ongoing service issues, planned maintenances, or relevant health advisories. Let’s see how it looks in the portal.
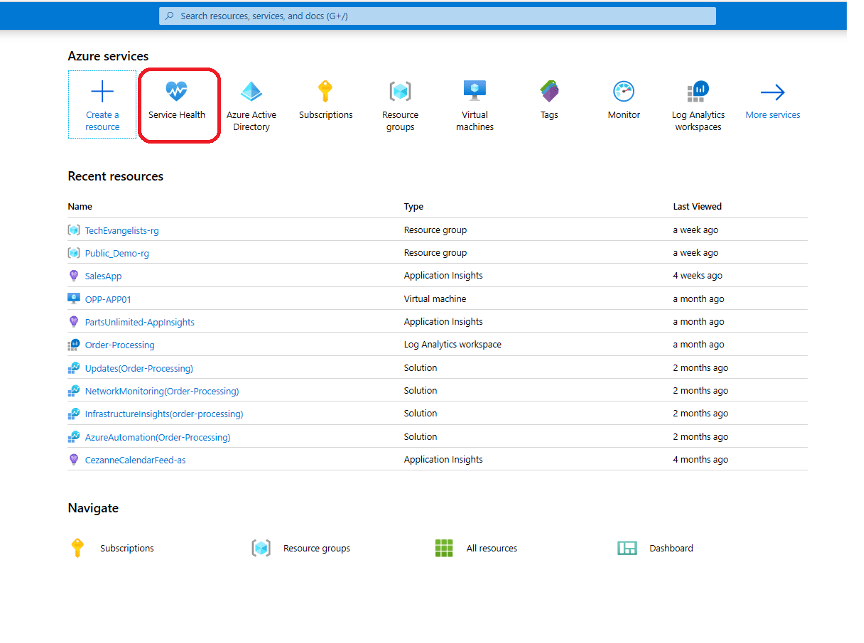
Jump into the portal and search for “Service Health”:
Take a look at all the options available to you on the left:
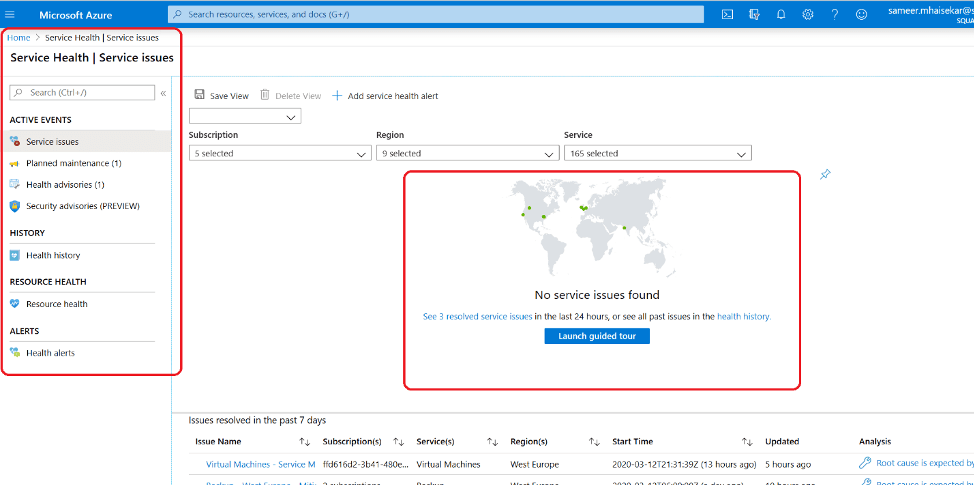
This tab displays to you the ongoing service issues impacting you currently. As you see on the right in the red box, luckily there seem to be no issues going on currently affecting my resources. Note the filters – I can filter my resources by subscription, region or the type of service. Let’s try that.
So here’s the result I got after applying the filters that gives me the health of the regions where all my VMs from one of my subscriptions are deployed:
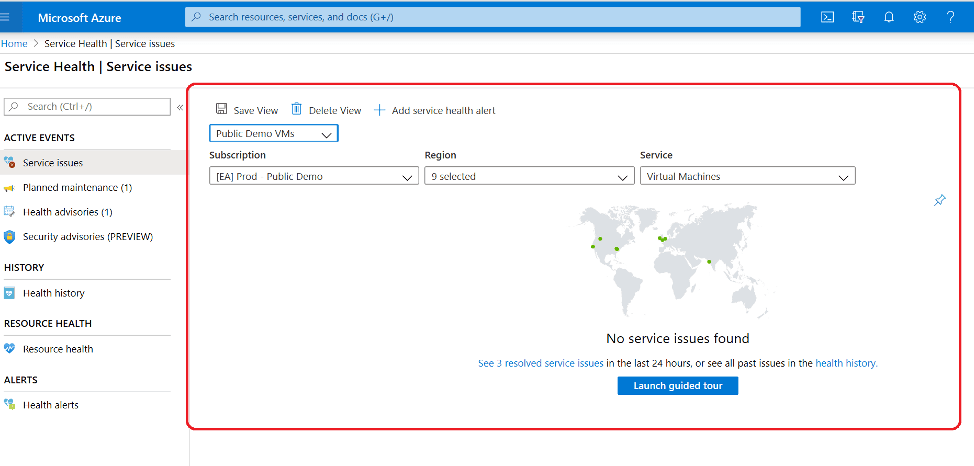
You’ll also notice that you can actually save this view now and select it later by choosing from a dropdown. You can also pin this to your dashboard.
It looks like all is happy and healthy right now – excellent! If you had any issues going on, you can view their detailed summary, their potential impact and also see what Microsoft is doing about fixing it.
Note that it has found that there have been some service issues with these regions in the last 24 hours. You can also see them in the Health History tab. We'll visit that in a bit.
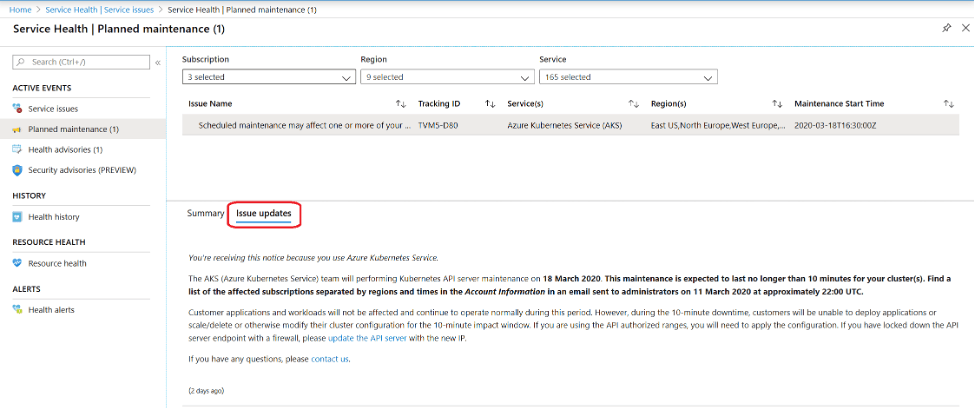
As the name suggests, these are the maintenance activities planned by Microsoft – notified to you well in advance so you can see them coming and prepare for them appropriately.
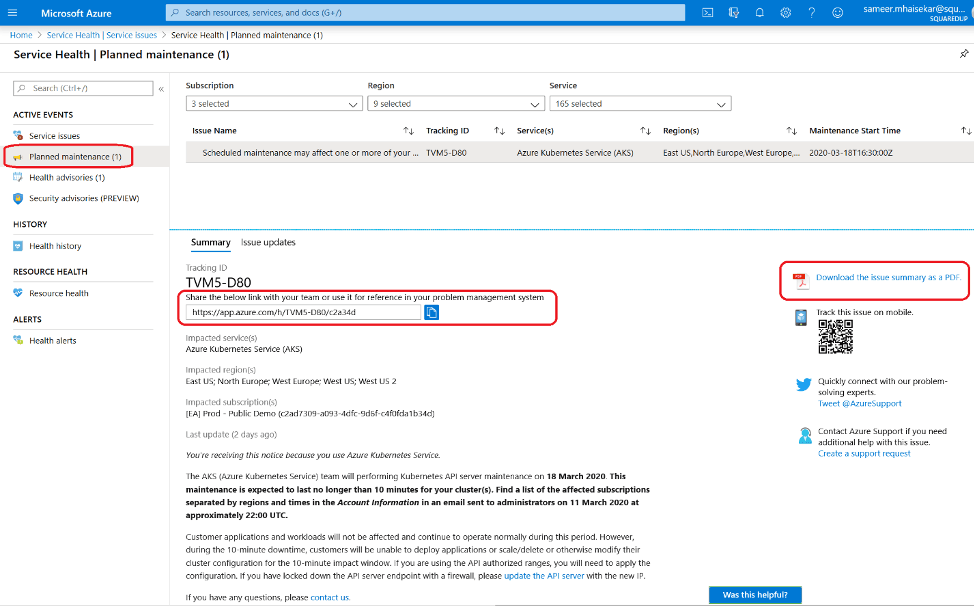
Here we can see that there’s one planned activity that’s going to happen on March 18th. It is also showing me which of my services are going to be impacted, along with the impacted regions and subscriptions.
In a helpful summary, it is also giving me an overview of what the maintenance pertains to and what is expected to happen. There is also a tracking ID and a shareable link that you can use for reference or feed into your other tracking systems.
You can also download all these details in the form of a PDF file, which you can then share with your stakeholders.
On the “Issue Updates” section beside the Summary, you can track what actions are being taken on this particular task.
Health advisories provides you with suggestions for some of the services you are using that aren’t necessarily service issues or maintenance tasks – such as service deprecations. Let’s take a look:
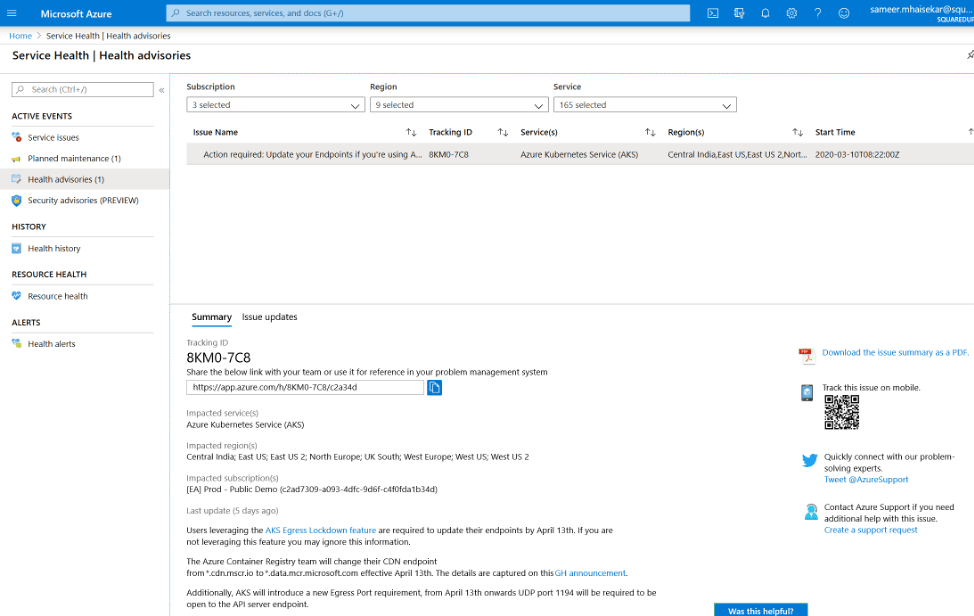
As you can see, I’ve got a suggestion here. Organizations using the “AKS Egress Lockdown feature” (in blue in the summary), need to update their endpoints by a cut-off date. Perhaps the existing endpoints are going to be deprecated. This notice is very useful for us end users so we can plan and execute the change in advance and minimize or eliminate any downtime.
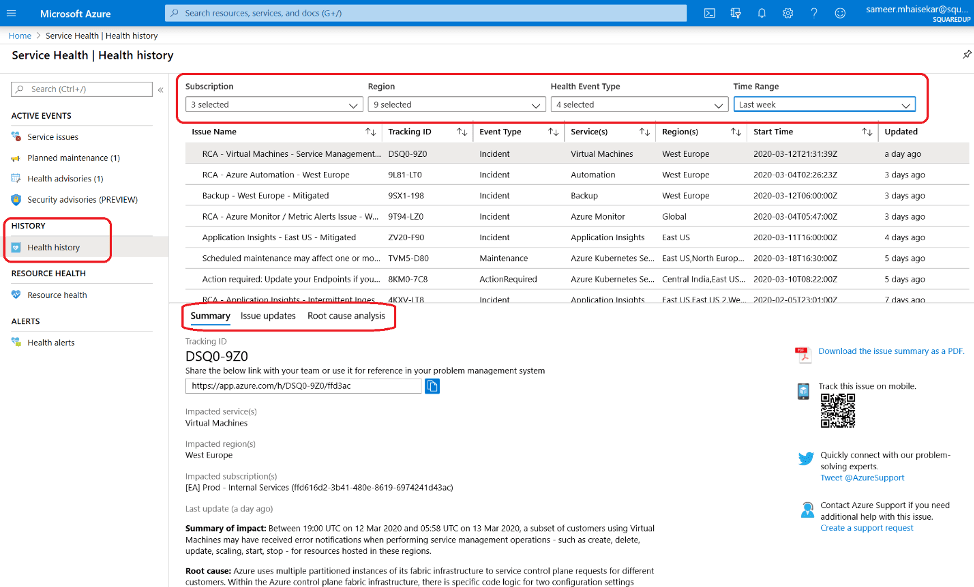
As you have probably guessed, this tab shows the history of all issues, going as far back as 3 months. You can export all of this as a PDF document and archive for tracking, records, audits, etc.
Now this tab is here to display the health status of your individual resources, as opposed to only the issues from Azure.
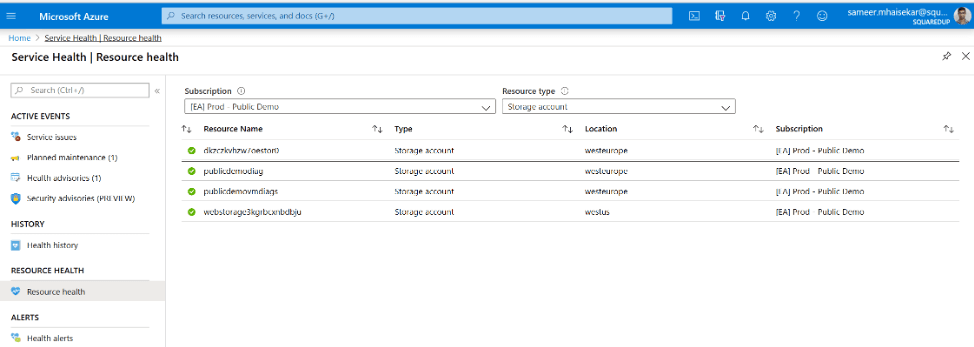
If you click on one of the resources, the health state history of that resource is displayed, along with any health state events and whether the event was caused by Azure or the customer.

Now lastly, it’s obvious that you can’t keep browsing to Azure Service Health manually to check for new issues. Instead, you will want to set alerts to notify you when there’s a new issue that requires your attention.
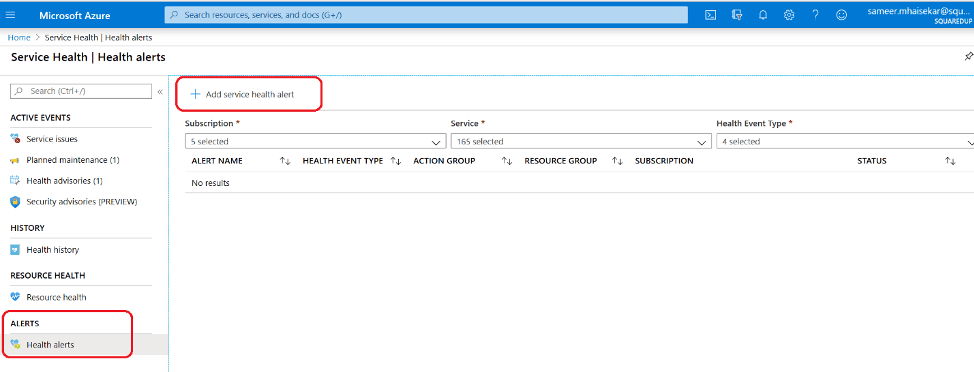
Navigate to the “Health Alerts” tab under the Alerts section and hit the “Add service health alert” button. The process is basically the same as we’ve seen in the last part of this series – Alerting in Azure Monitor.
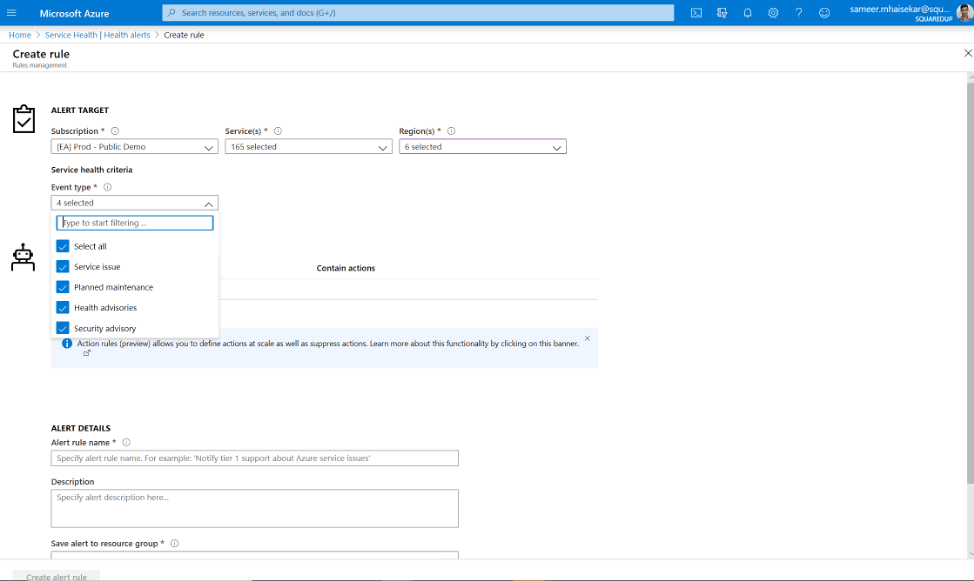
After selecting the subscription, type of services you’d want to be notified for and the regions you’re concerned with, you can choose the Event Type, select the action group, punch in some details for the alert such as the name, description, etc – and you’re good to go!
There is another way to check Azure’s health which you may have heard of before. The Status page:
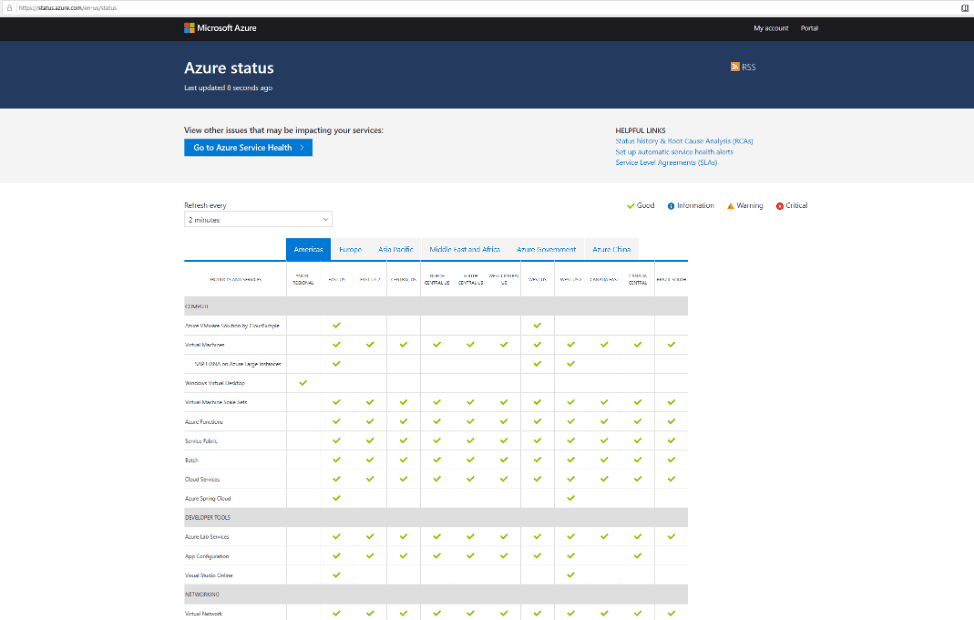
If you enter status.azure.com in your browser, it will take you to the page above. Here you can take a glance at all the services and their health in various regions. However, as you can see – this is very high-level and not very interactive. Certainly not as thorough as the Service Health in the portal, but still good if you want to take a brief look at your Azure health without logging in into Azure.
Awesome! As I dramatically wipe the tears from my eyes, I have to announce that this marks the end of the amazing journey we’ve taken together of going from Azure Monitor zero to hero! I hope that this series has been of value to you and that it helps you get going with your own Azure monitoring adventures.
Until next time!
Cheers
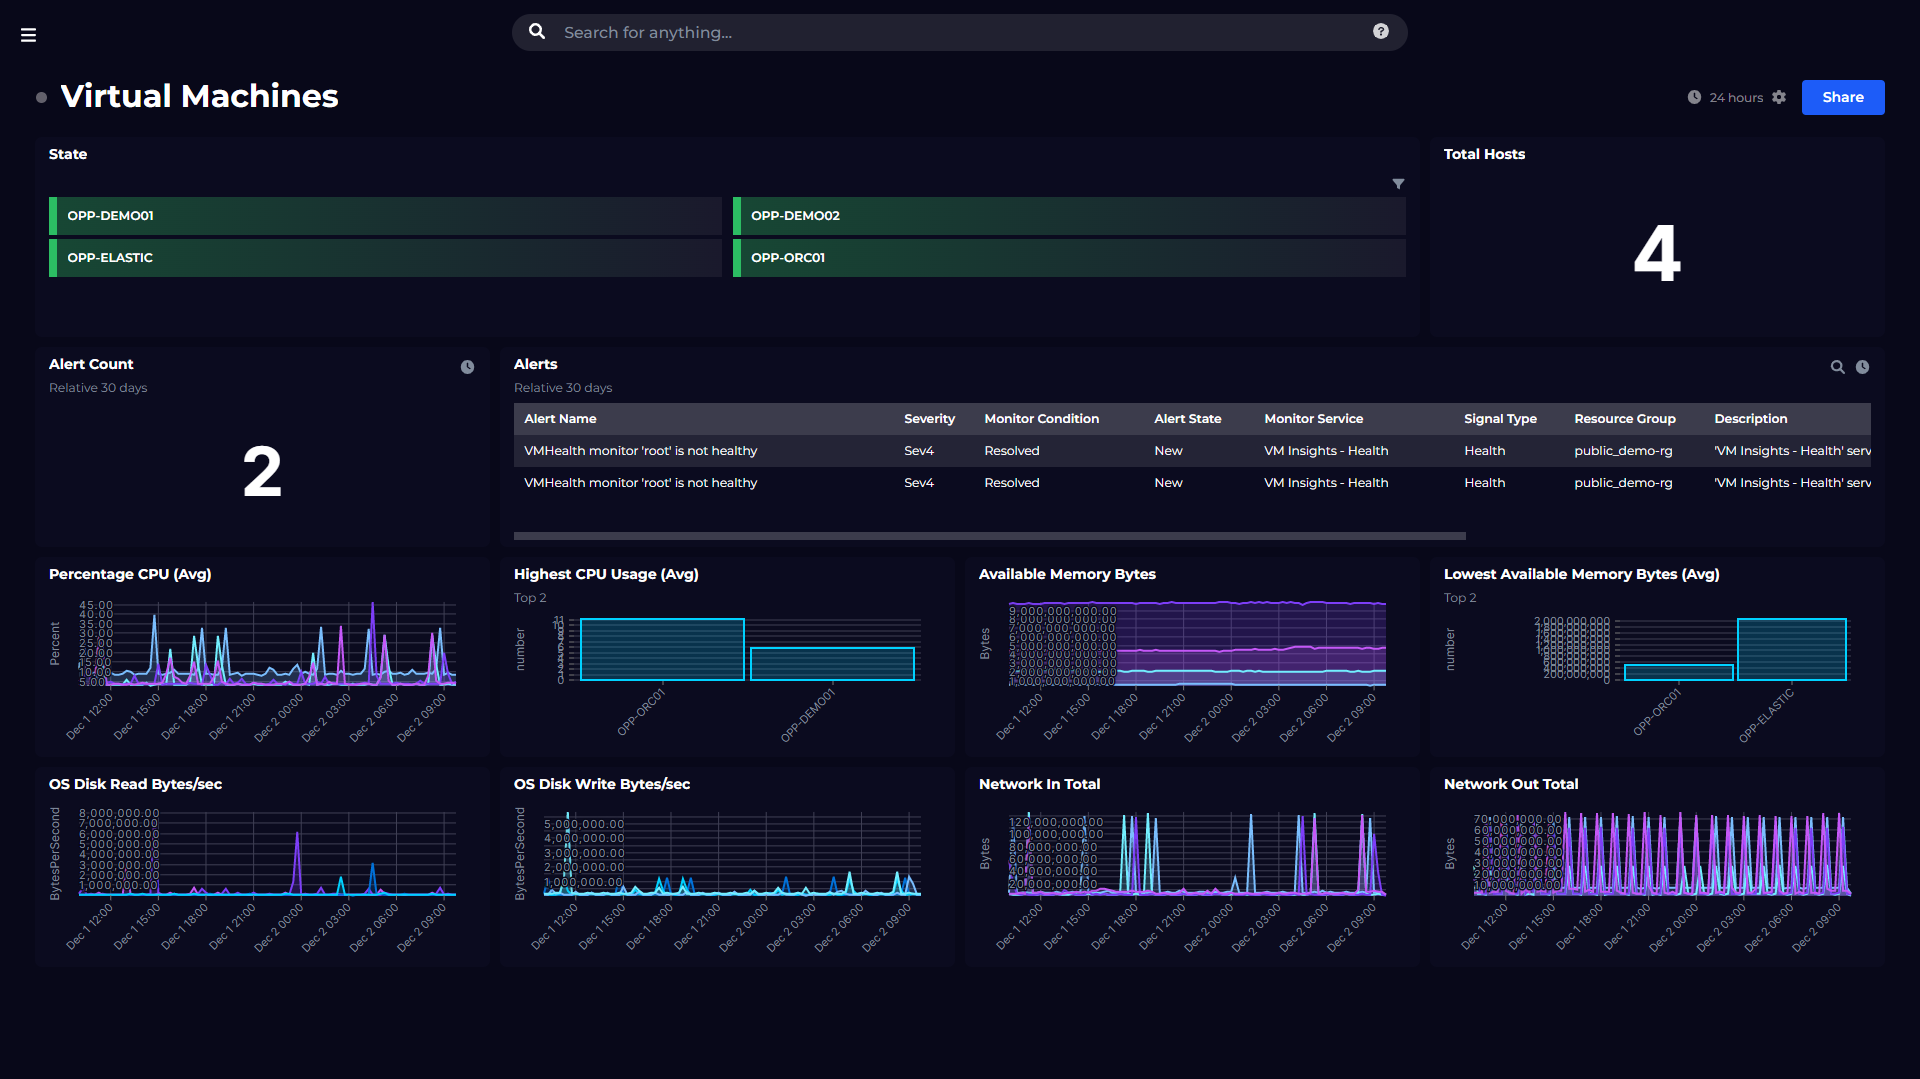
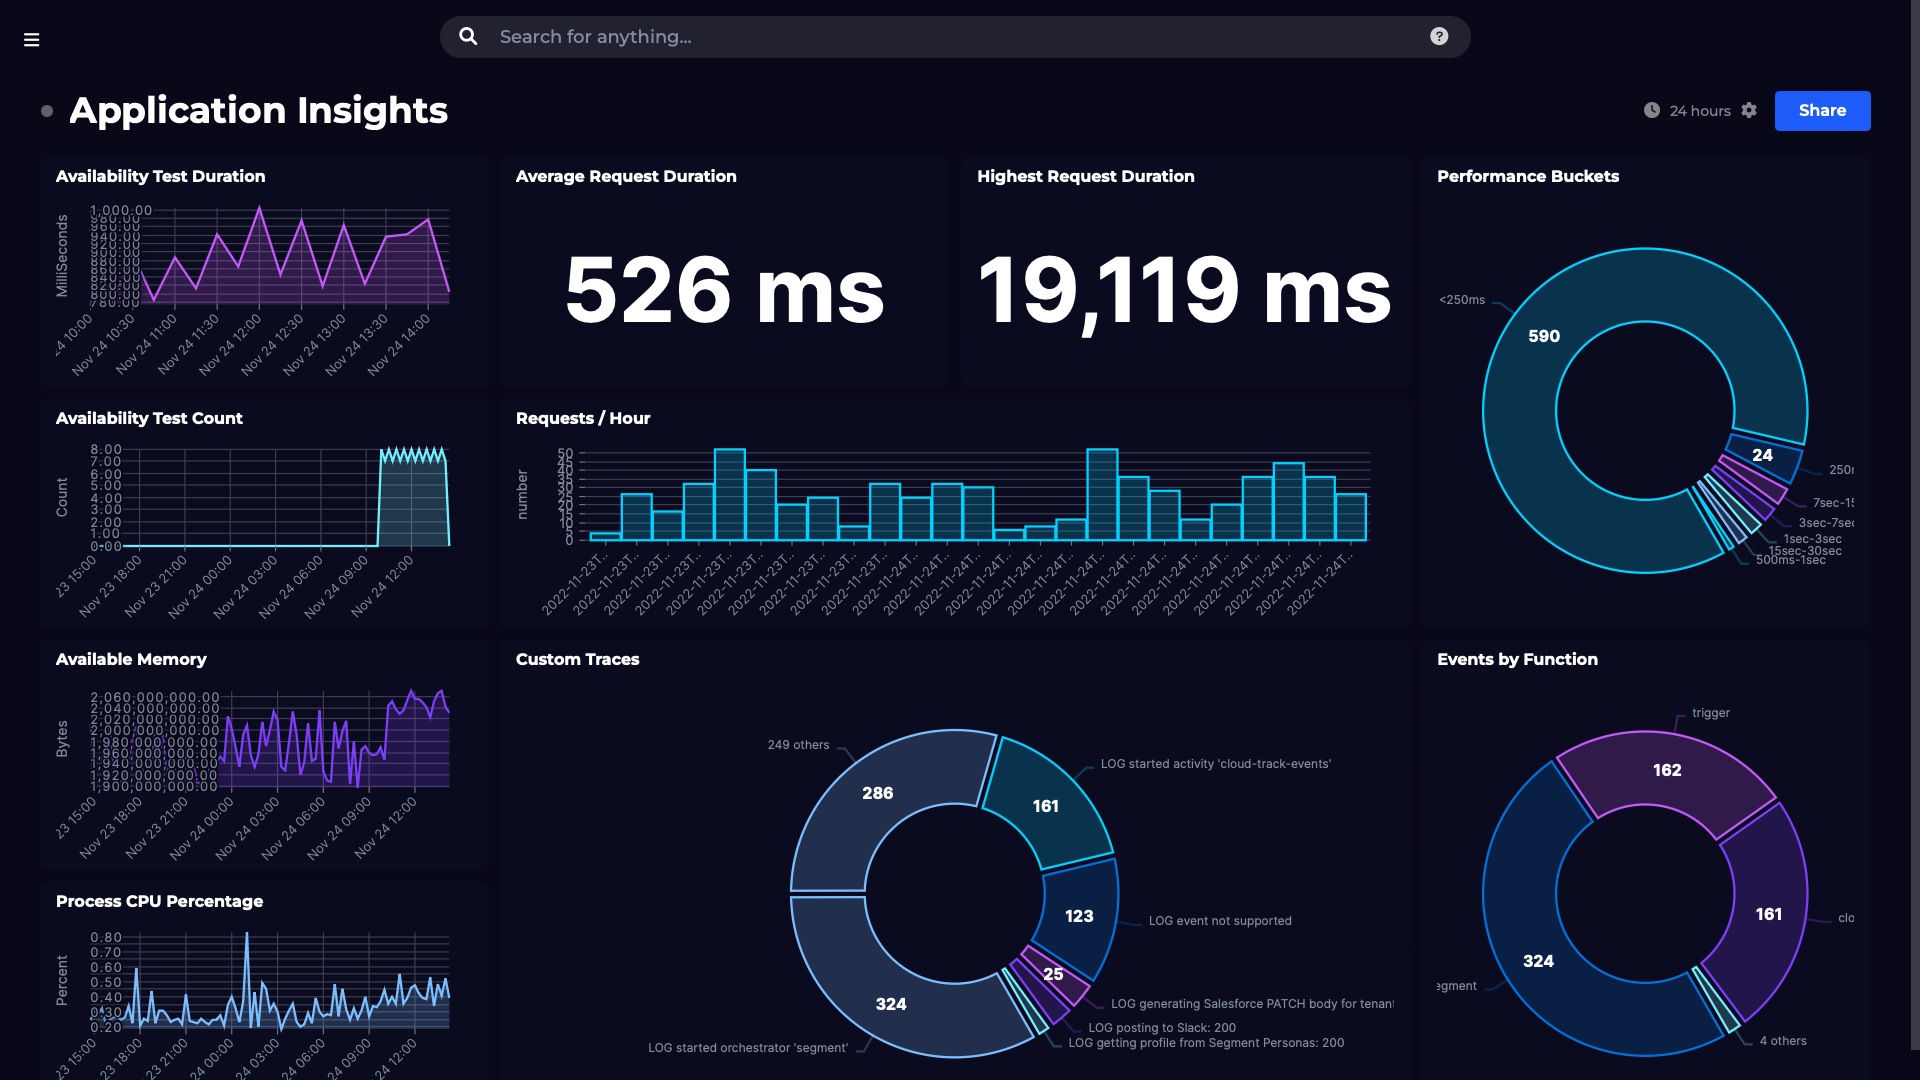
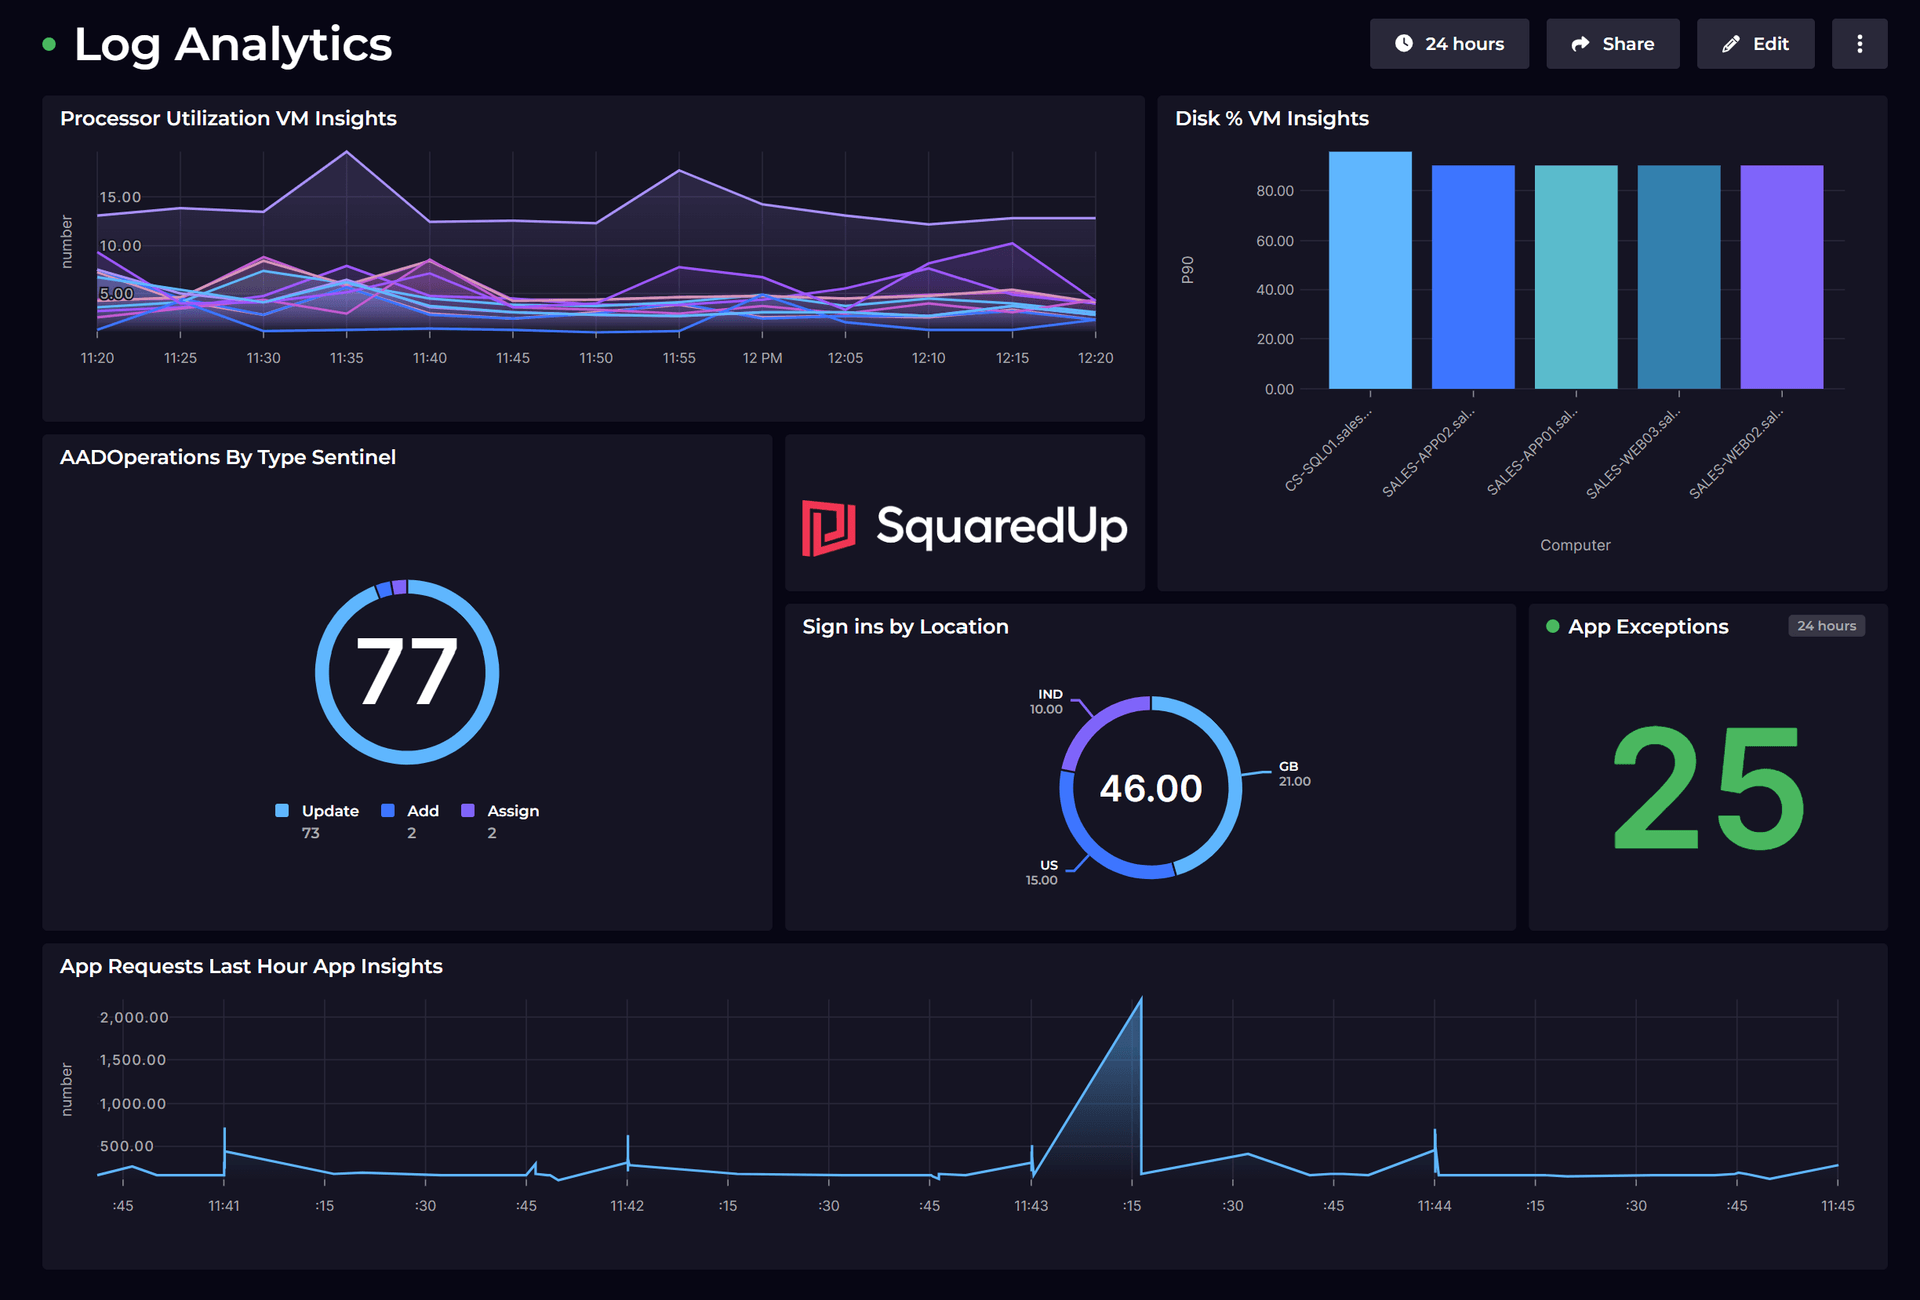
Monitor your Azure environment, including VM, Functions, Cost and more.
SquaredUp has 60+ pre-built plugins for instant access to data.
Dashboard Story
Dashboard Story
Dashboard Story