Sameer Mhaisekar
Developer Advocate, SquaredUp

Developer Advocate, SquaredUp
In the Azure Monitor Learning Path, we talked about metrics and collecting data in a Log Analytics workspace to be operated on with KQL. As a part of it, we also talked about Monitoring Solutions and how they help you collect data into the workspace that is more focused for specific purposes. In that series, our main focus was on the Log Analytics Agent and I briefly talked about Diagnostics extension.
In this article, we'll talk in more detail about the different Azure Monitor agents and how they work.
If the first word that pops in your mind when you think of Azure Monitor agents is “Log Analytics Agent (or MMA)”, you’re not alone. You’re also not wrong. The LA agent is the one you’d need and use the most, but there are also some other agents that Azure Monitor uses to collect and display monitoring data.
The capabilities of some of these agents largely overlap (especially the first two), but they are unique in some features that they provide. Guest OS level telemetry is collected by more than one agent, for example. So don’t get confused by that! Hopefully this article will make it easier for you to choose which one to use.
The Log Analytics Agent is used for collecting guest-level OS metrics, as well as logs. Most Monitoring Solutions also rely on this agent.
This agent is essentially the same as the SCOM Agent, so you can multi-home your SCOM agents to send their monitoring data to their SCOM Management Group as well as a Log Analytics workspace very easily.
Remember: This agent always sends data only to Azure Monitor Logs (Log Analytics workspace). What this means is that this data is available to query in Azure Monitor, but it does not store data as metrics in the Azure metrics database.

For more details, Microsoft covers the difference between Logs and Metrics here.
When to use the Log Analytics Agent:
Alright, pay more attention here because this one’s slightly more complicated. ?
First off, while the Log Analytics Agent can be installed on any machine, WAD can only be used with Azure VMs. In terms of the data collected, it collects almost the same data as the Log Analytics Agent – guest-level performance, event logs, etc.
You can enable the diagnostic extension for a virtual machine to send platform metrics to other destinations such as Azure metrics,storage account and event hubs.
You can also send some limited data to Azure Monitor Logs (by connecting Storage account to the workspace), but I wouldn’t really recommend that. If you want to send data to the workspace, better stick to the Log Analytics Agent instead which sends it straight there. Your main tools to view the diagnostics data would be these.
The thing I like about enabling diagnostic settings is the fact that it adds some guest OS metrics to the Metrics database, which can be viewed quickly using the Metric Explorer.

Note that enabling Diagnostics has added another Metric Namespace (Guest classic), under which you now have some guest OS metrics to chart.
I’d re-iterate, this data is only in the metrics database and not available to query in Logs.
Use the Diagnostics extension if:
The Dependency Agent discovers data about processes running on the VM and external process dependencies. However, it relies on the Log Analytics Agent to send that data over to the workspace.
The main use of this agent is for the Service Map solution.

Alright – I realize this is a lot to soak in. I’d also wholeheartedly agree with you if you think this is a bit confusing. So I feel obliged to give you a TL;DR on this one ?
Luckily, Microsoft has generously done this for us. From Overview of Azure Monitor Agents:

Once you’ve figured this out, there’s another diagram on a higher level that I find particularly helpful. From Monitoring Azure virtual machines with Azure Monitor:

Hopefully, this diagram makes a lot more sense to you now!
That’s all about the agents, stay tuned for our next article where we discuss exactly what this “Azure Monitor for VM” is and what it's about.
Developer Advocate, SquaredUp

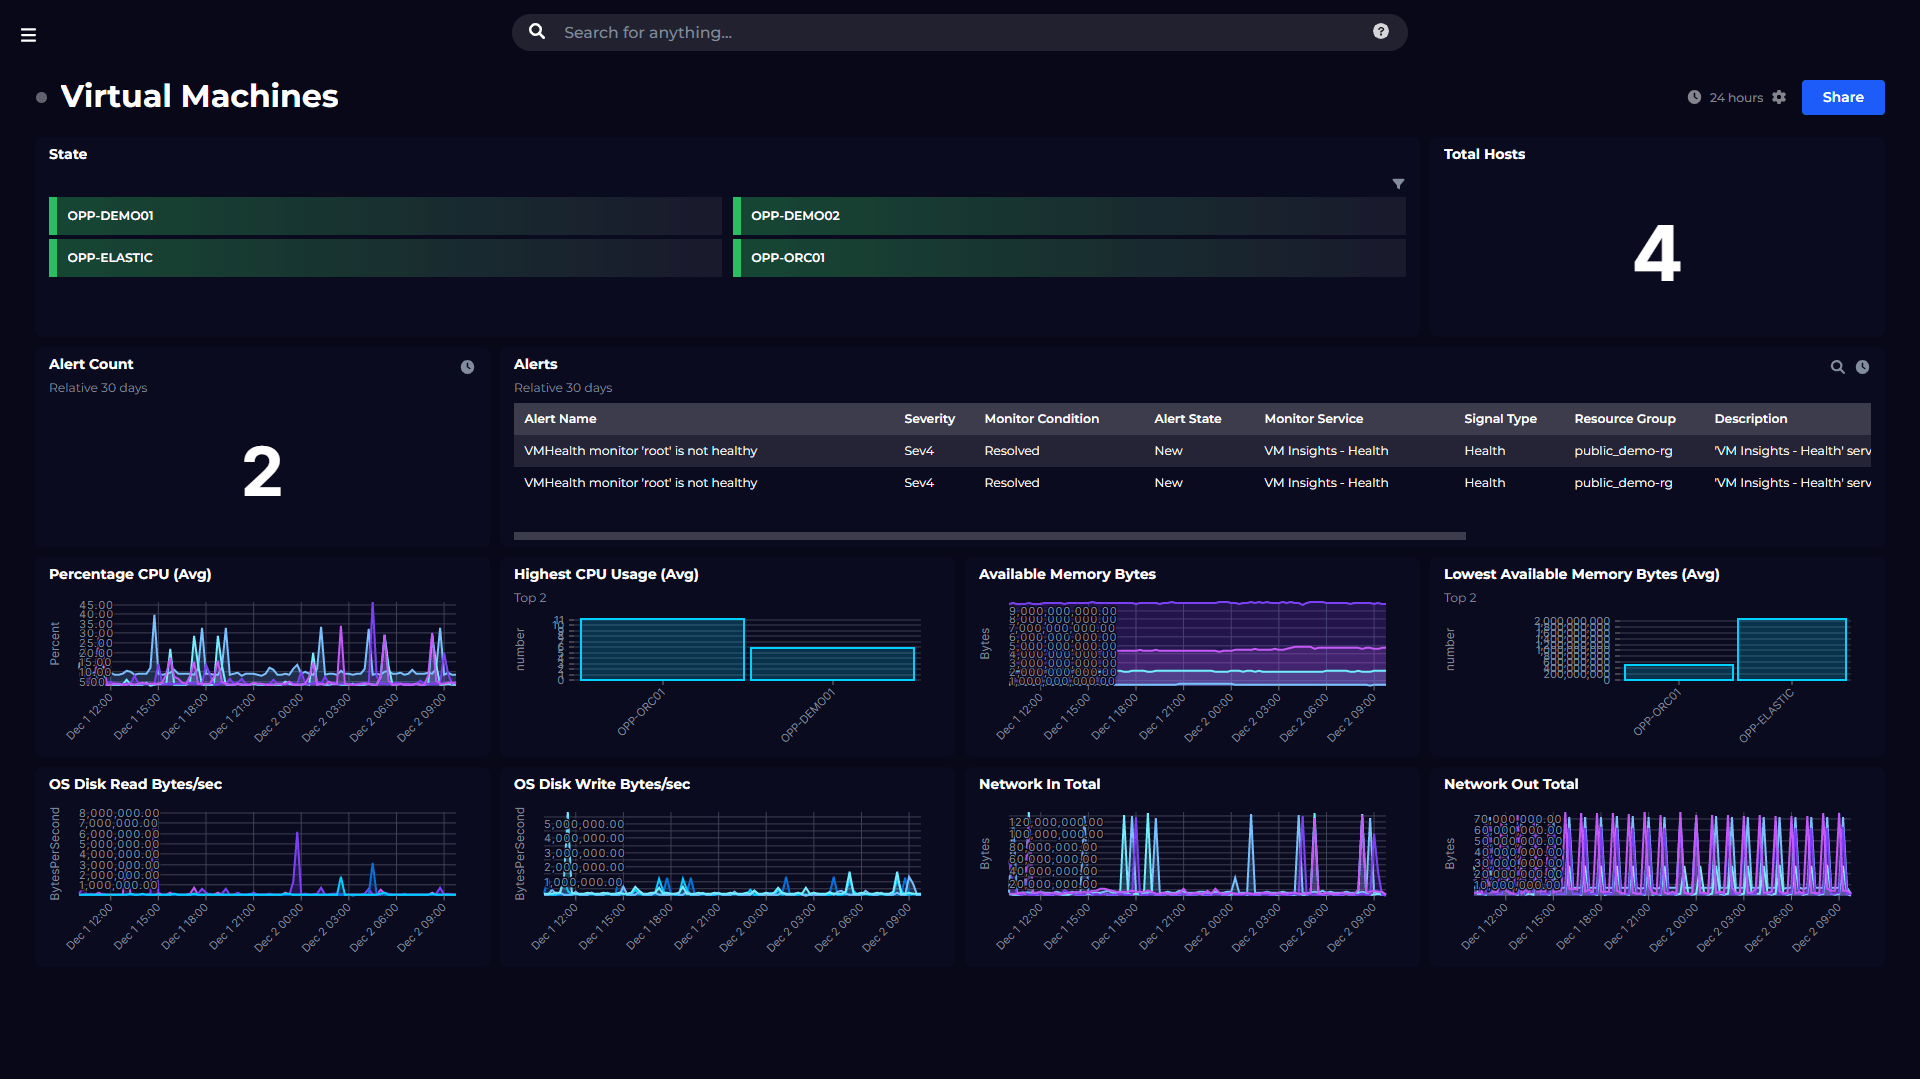
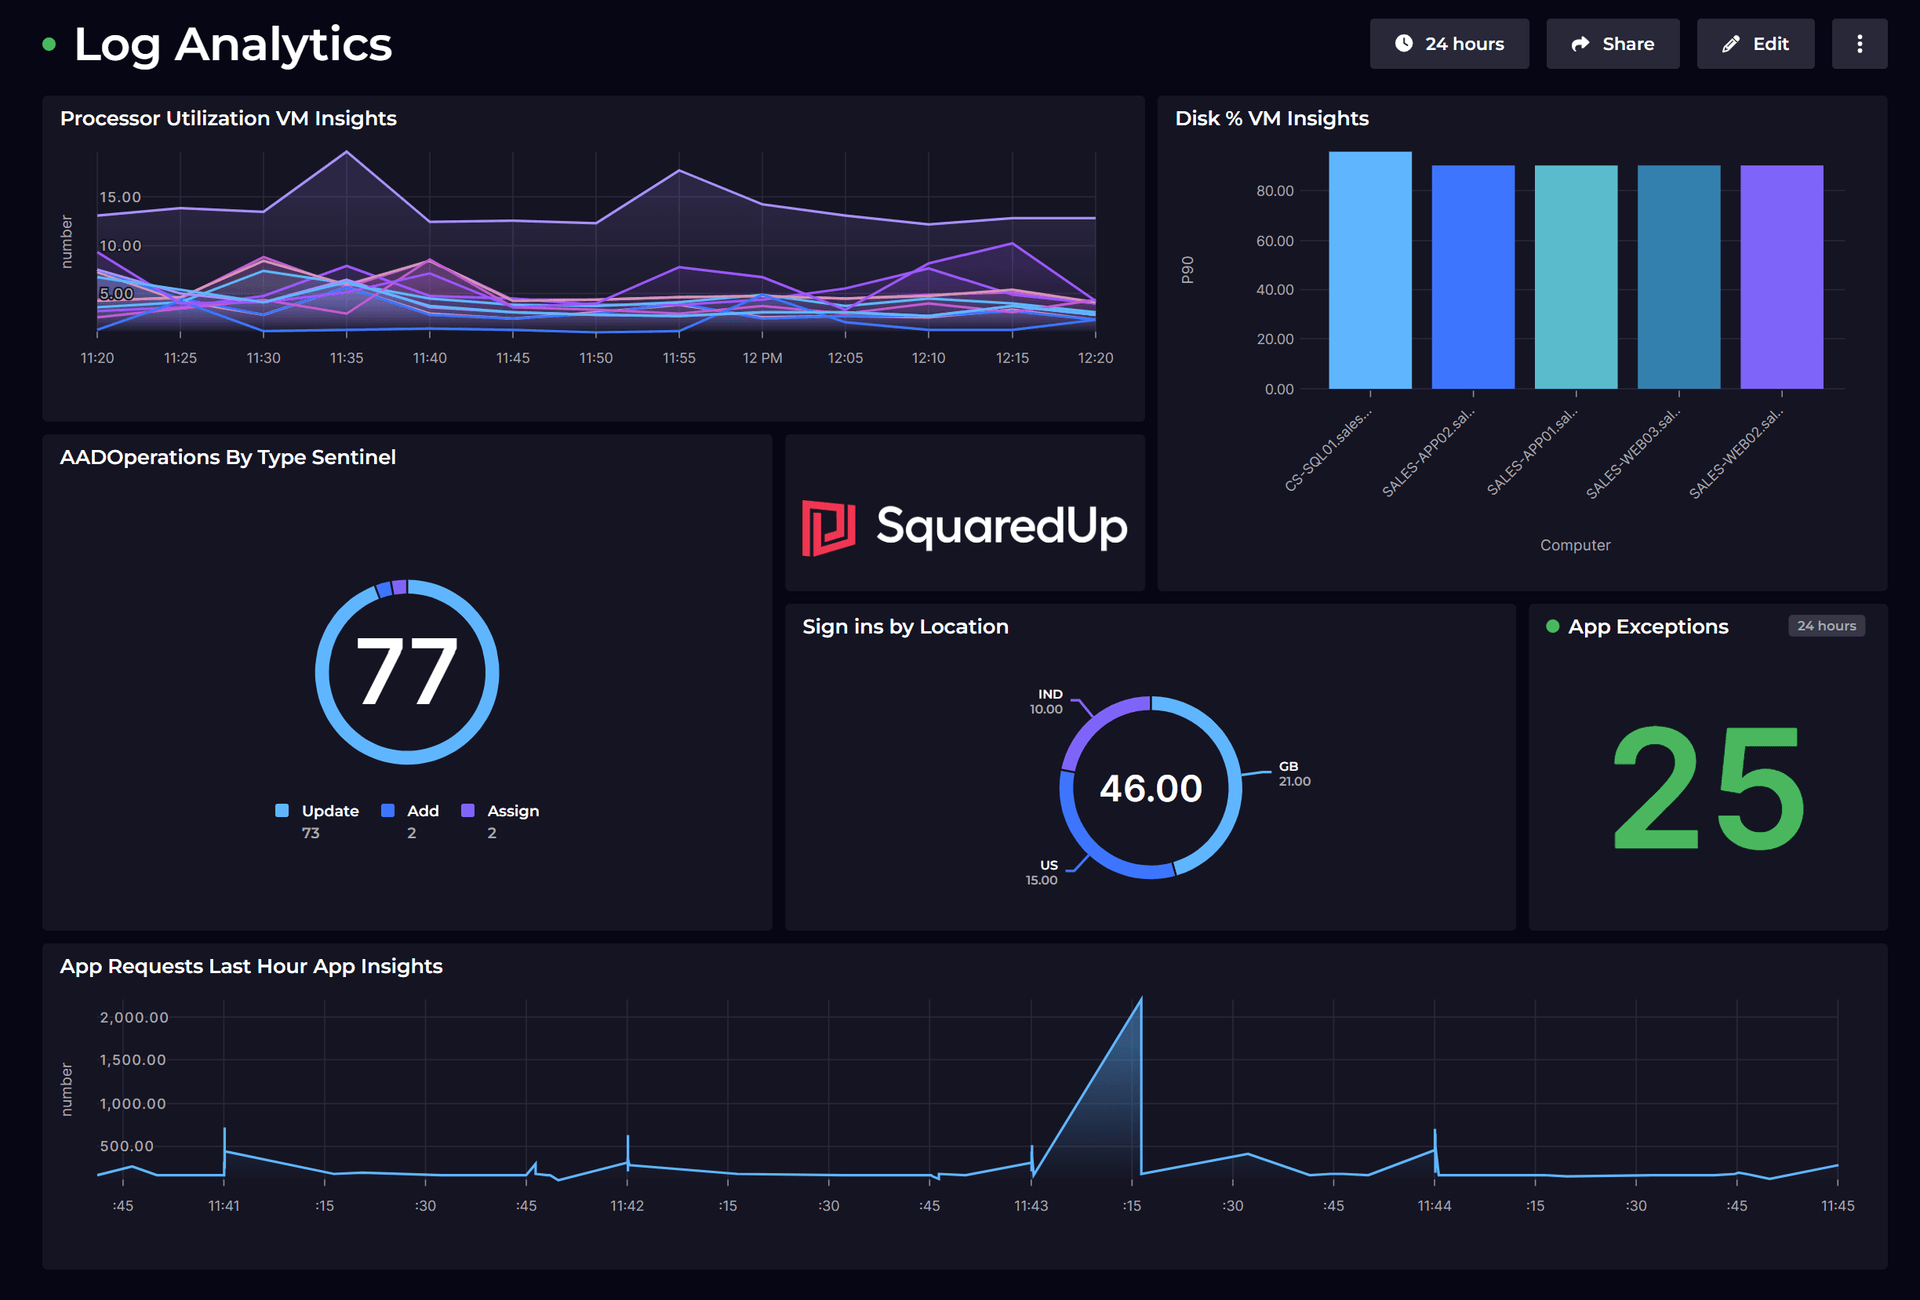
Monitor your Azure environment, including VM, Functions, Cost and more.

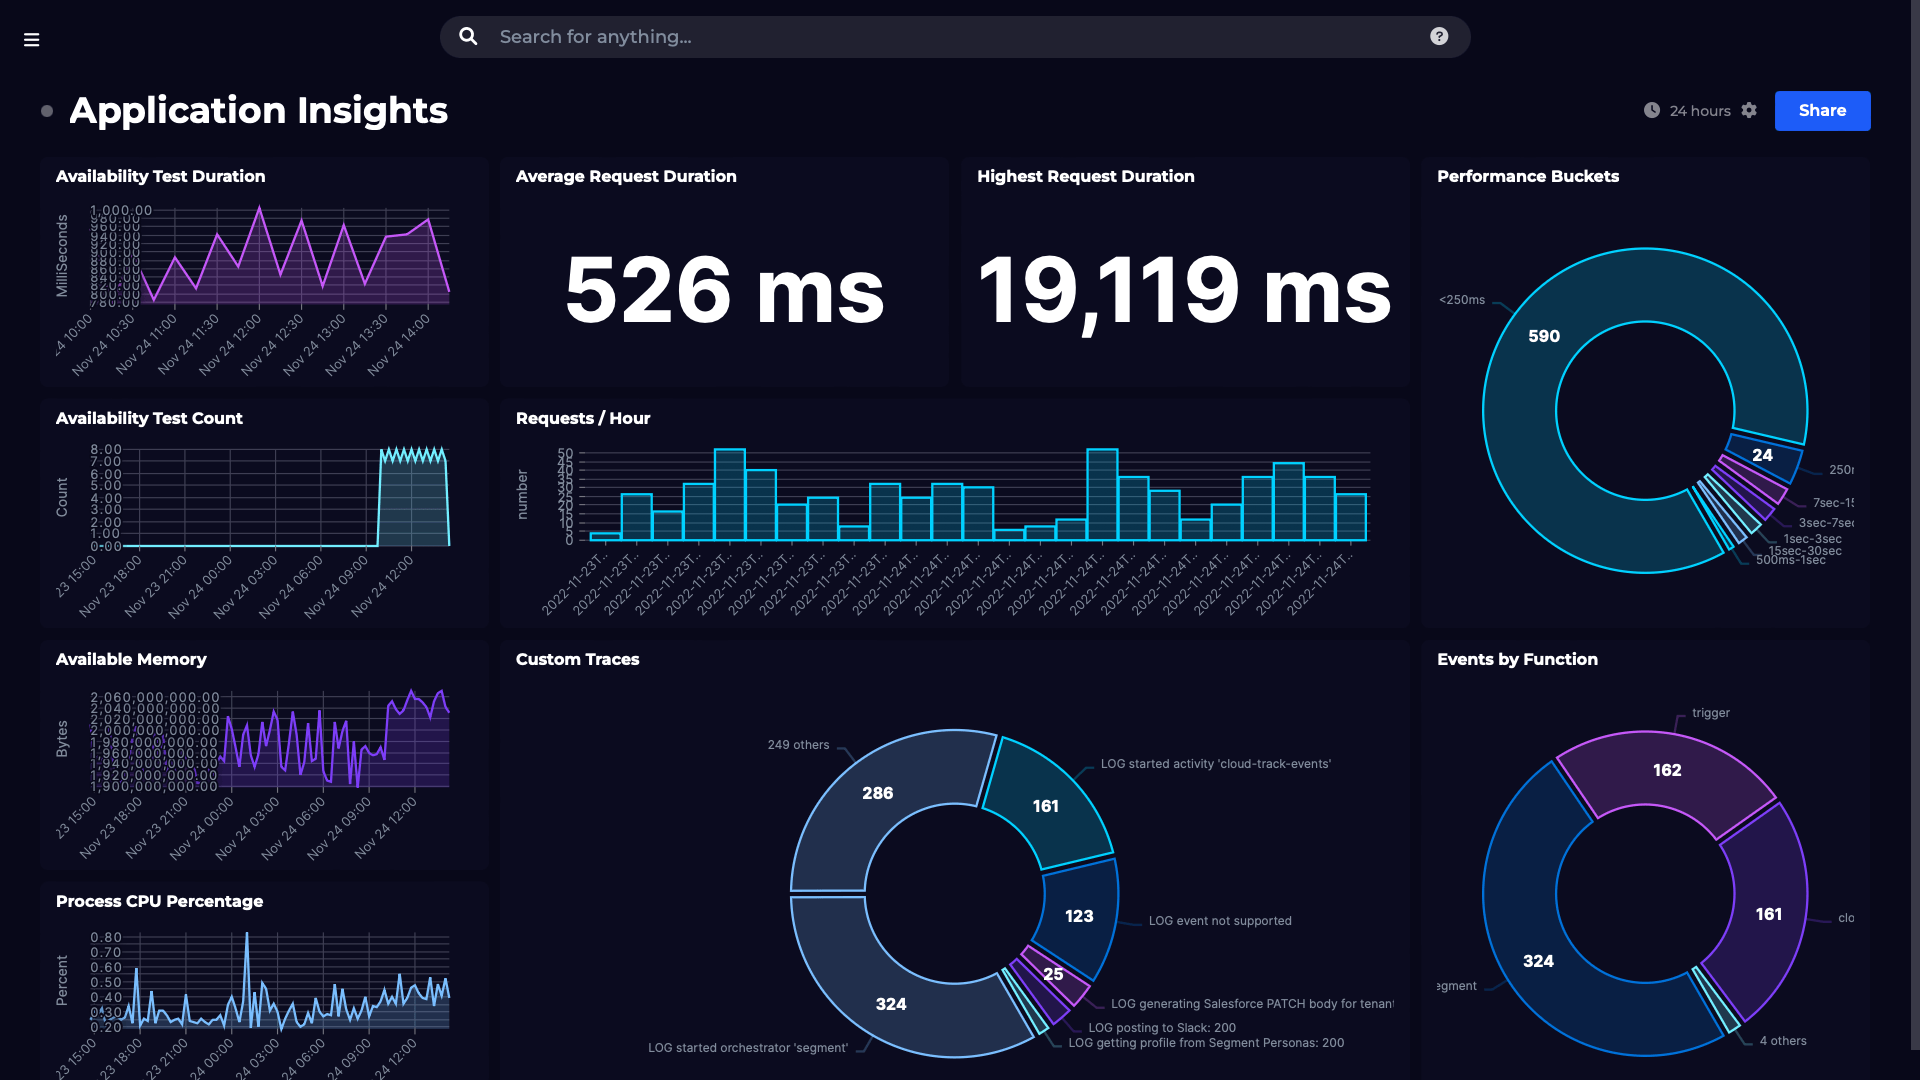
Monitor your Azure Application Insights environment using custom Kusto queries.
Dashboard Story
Dashboard Story
Dashboard Story

Dashboard Story

Here's what our free tier includes: