Adam Kinniburgh
VP Innovation, SquaredUp
VP Innovation, SquaredUp
If you've found this blog via our pricing page, or have been considering upgrading, and you're trying to work out what to buy, this short write-up should help explain how the two consumption elements of SquaredUp work.
Objects are the things our plugins "index" from your data sources... your lambdas from AWS, pipelines from Azure DevOps, agents from Zendesk. They're the familiar entities you'll see in a search, when exploring the Map, or building a tile. The more plugins you connect, and the larger your environment, the more objects you'll consume.
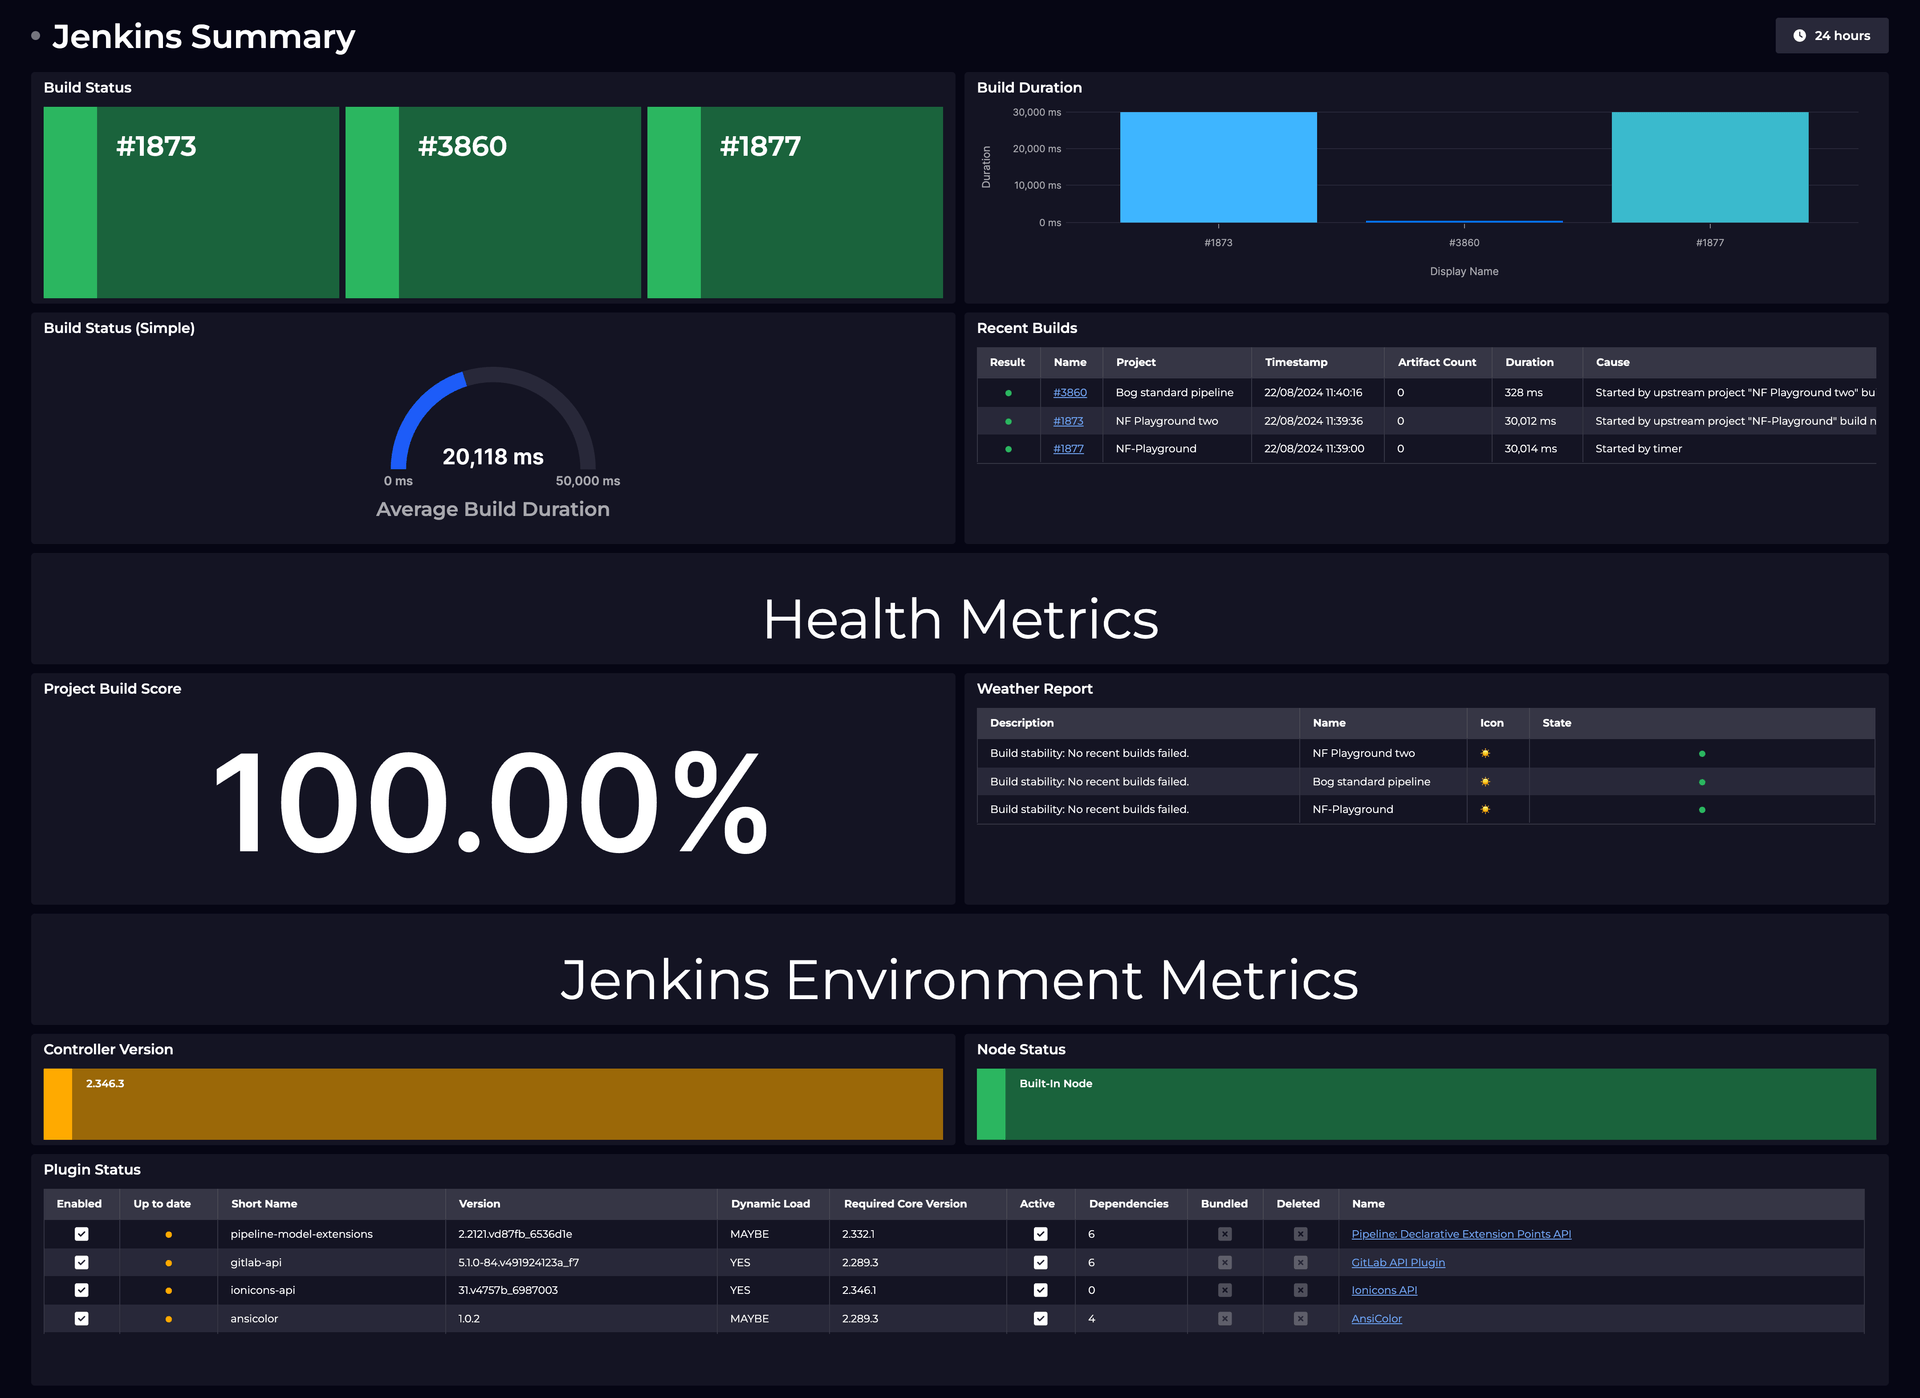
Queries are the requests made by our web app, API, and background services to our backend services to get data. As an example, requests are made to load the tiles on a dashboard. A shared dashboard with 1 tile on it refreshing every minute, would use 60 queries per hour, 1,440 queries per day, 43,200 queries per month. Similarly, a monitor being updated, or an API request being served, each equate to a query.
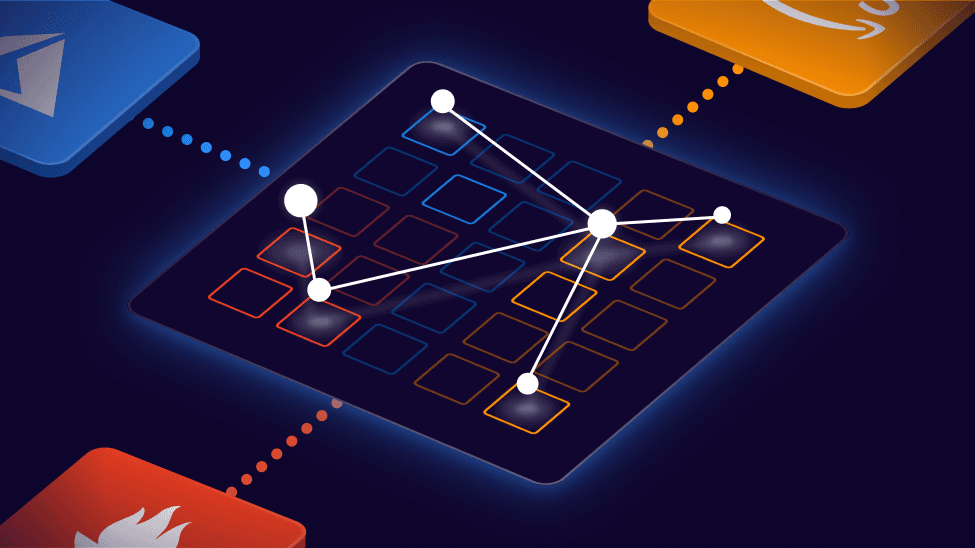
SquaredUp is built on top of a knowledge graph, which in effect, is a database designed to store objects and their relationships. With some magic on top, our graph correlates those objects across tools, shining light on connections you might have been unaware of, or at the very least, enabling you to bring otherwise siloed data together.
You're already very familiar with the power of knowledge graphs, assuming you've ever used Google. Type Picasso into the search box and you'll see a "people also searched for" section populated not with random people from France, but with similarly regarded cubist painters. Google uses the properties of an object to build a web of meaningful relationships to objects that share similarities.
Our graph does this too.
Let's say you're running an Azure Function that's monitored by Dynatrace. Both our Azure and Dynatrace plugins will create objects for that function. Our graph figures that out and joins them together, so when you search for and then drill into that object, you'll see a mix of data from both Azure and Dynatrace all in one view. If you're getting advanced, you could use our graph to find all your Azure Functions that are, or aren't, monitored by Dynatrace. Like I said... magic.
The first time you're likely to interact with your objects is in our Tile Editor. When you're creating a tile, you pick a data stream and then the object(s) you're interested in. The list of objects you see comes from the graph, and is always filtered to match the data stream you chose.
When you connect a new plugin, the first thing it does is "index" your objects. We find out what your tool knows about, and then create records in our graph representing those objects and their relationships. Indexing happens every 12 hours after that, to ensure our graph is reflective of any changes in the source data.
In short, "it depends".
The plugin you're connecting to and the size of your environment are the primary factors here. Let's work through a quick example...
You're a large enterprise running hundreds of apps in Azure. When connecting to Azure, we'll create objects for each subscription and resource group, and all the resources they contain.
Let's say you have 50 teams of 10 people. Each team has their own subscription, each of which contains a couple of resource groups per person, containing 10 resources each.
50 subscriptions + 1,000 resource groups + 10,000 resources = 11,050 objects.
Now let's say most of that is controlled via pipelines in Azure DevOps. Again, each team has their own project, containing varying numbers of pipelines, environments, test plans...
50 projects + 150 pipelines + 250 environments + 500 test plans = 950 objects
So I really wasn't kidding when I said "it depends".
If you check out our Plugin Gallery, each page contains information about the types of objects that will be indexed. You should be able to make a reasonable guess based on that, but nothing beats just giving it a shot.
Unlike Objects, which have a fixed allowance, Queries are consumed on a monthly basis and then reset. Think of Objects like your phone book, and Queries like your call minutes.
We measure Queries as requests made to our app's backend from our web app, API, or background services. Not all Queries come out of your allowance though. When you're logged into SquaredUp, the Queries you incur through normal use are unlimited, covered by your user license. We only measure "non-user activity", including monitors, API requests, and shared dashboards.
SquaredUp doesn't store any of your data, it's always requested from the data source when needed. This means we don't need to bill you for gigabytes of potentially useless data storage like most tools would, instead, we efficiently call for data when you need it.
In most cases, you can make an assumption that loading 1 tile or checking 1 monitor equates to 1 query.
As a simple example, for a dashboard with monitoring enabled on 1 tile, with a refresh interval of 1 minute, the monitoring background service will consume 1 query every minute, 60 queries per hour, or roughly 43,200 queries per month.
Cutting you off is in nobody's interest. Instead we allow overages, and in addition, our friendly Customer Success team keeps a proactive eye on all of our customer usage. If it looks like you're flying a bit close to the sun, we'll always try to help you out. Typically, it's as simple as quickly reviewing your noisiest monitors and reducing their frequency, but in some cases, it might need to be a subscription change.
In any case, we're here to help you get the most out of SquaredUp.
I don't think I've said "it depends" this much in my life, so let's try to get to something useful.
Our largest Enterprise customers tend to need around 150,000 objects, and consume around 5,000,000 queries per month. Their use case is typically a mix of daily users viewing shared dashboards, and heavy-duty monitoring. Lots going on 24/7.
Our more typical Enterprise customers tend to need around 50,000 objects, and consume around 1,000,000 queries per month. Their use case is usually very similar, but with smaller environments and fewer critical one-minute monitors.
This is the absolute best way to get this right!
Get in touch with us, either through our Support Team or via your sales rep, and we can help you do this for real via a generous Enterprise trial. Connect all your plugins, build a load of dashboards, go crazy with monitoring, and just see what it looks like.
I hope this helps demystify Objects and Queries.
VP Innovation, SquaredUp

Dashboard Story
Dashboard Story

Dashboard Story

Here's what our free tier includes: