Get started in seconds
Getting started with SquaredUp is free and easy. Our free tier includes:
- 2 users
- 3 data sources
- 10 monitors
- Unlimited dashboards
Getting started with SquaredUp is free and easy. Our free tier includes:
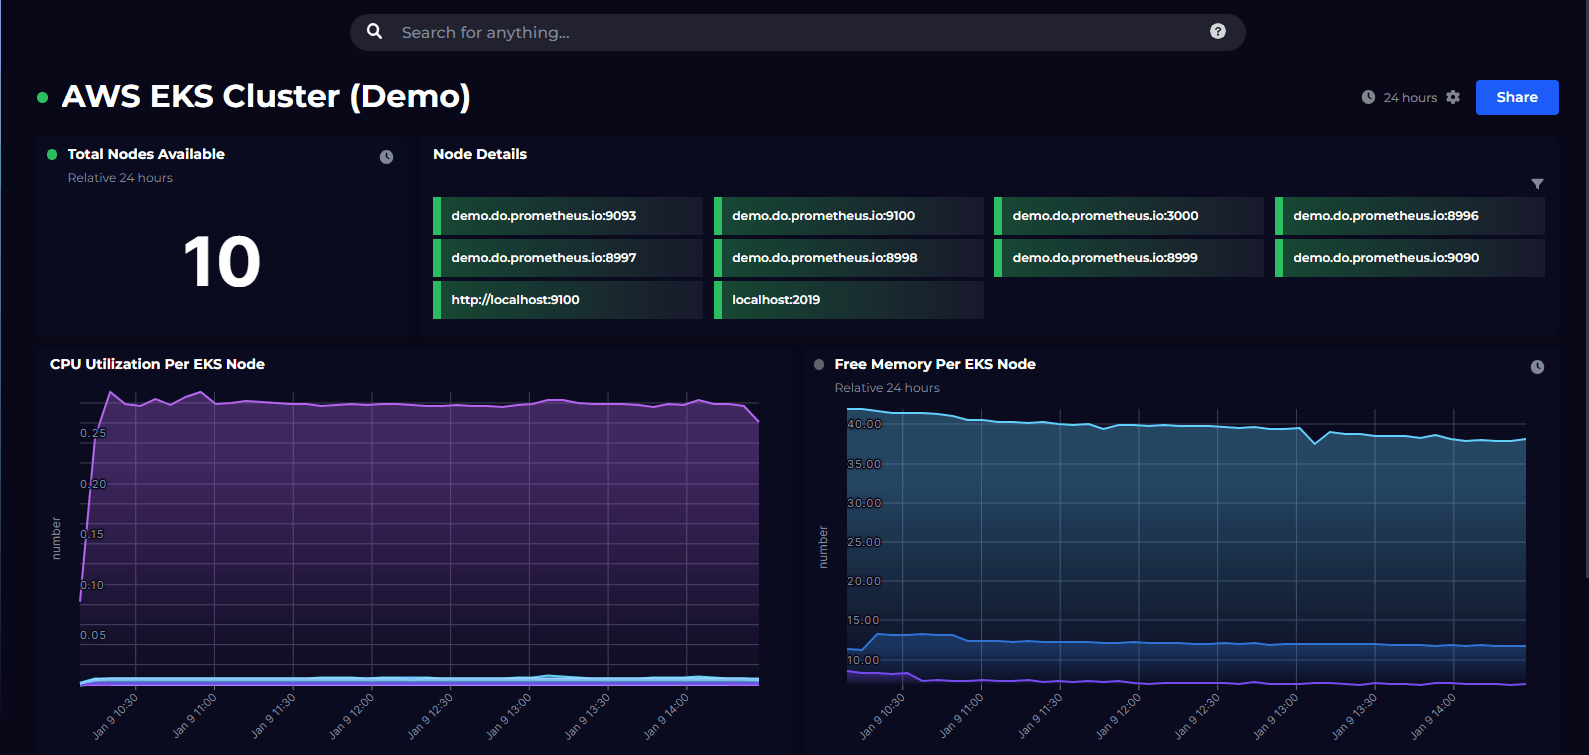
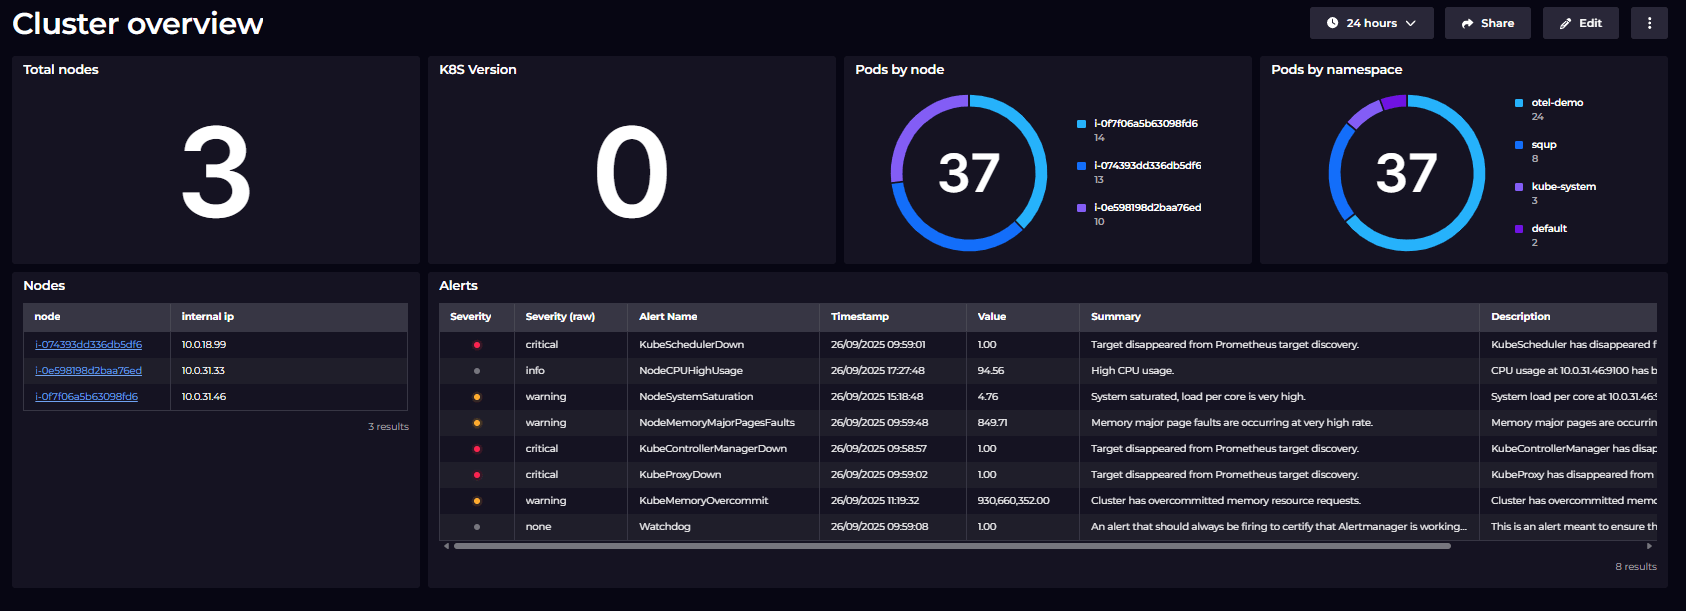
SquaredUp is the smart dashboard that makes it easy to visualize, monitor and share Prometheus data in minutes.
Get started free


Thanks to my dashboards in SquaredUp, we can have discussions based on facts, not fiction.

A step-by-step guide to visualizing your Prometheus data with SquaredUp dashboards.


By SquaredUp
Monitor any metrics from your Elasticsearch environment using custom QueryDSL, Lucene queries and API calls.


Plug directly into AWS CloudWatch for instant dashboards, reports and analytics.