Stephen Townshend
Developer Advocate (SRE)
Developer Advocate (SRE)
In the previous article I covered how to set up auto-instrumented tracing for a Node.js app using OpenTelemetry (OTEL). We then sent the spans directly to the open source tracing tool Jaeger. I recommend you give that a read first before walking through this guide because we're going to re-use the instrumentation we set up last time.
Today we're going to take things a step further by introducing the OpenTelemetry Collector. The collector is a universal way to receive telemetry and send it wherever you'd like it to go. Because it lets you rapidly switch where your telemetry is being sent, the collector is a key part of what makes OpenTelemetry tool agnostic.
Last time we sent our spans directly from the Node.js exporter to Jaeger. Today we're going to put the OpenTelemetry collector in the middle:

We'll be running both the OTEL collector and Jaeger inside Docker to manage them easily and so that they can talk to each other. There's lots of other ways you can run the collector, but for testing things on a laptop I find Docker the cleanest.
Adding the collector into the mix provides a number of benefits including the ability to:
So, let's get started!
Before you continue, make sure Docker Desktop is running!
The OTEL collector and Jaeger need to talk to each other, so I'm going to run them both as docker containers within the same virtual network.
Let's create a network called "otel-jaeger-network":
docker network create otel-jaeger-networkIn the last tutorial we published a whole bunch of ports when we ran Jaeger. This time we'll be sending spans to Jaeger from inside Docker, so the only port we need to publish externally is 16686 (so that we can access the web UI) from our laptop:
docker run -d --name jaeger \
  --env COLLECTOR_ZIPKIN_HOST_PORT=:9411 \
  --env COLLECTOR_OTLP_ENABLED=true \
  --publish 16686:16686 \
  --network otel-jaeger-network \
  --network-alias jaeger \
  jaegertracing/all-in-one:latest
You may notice two new arguments we didn't pass last time:
The OTEL collector uses a YAML config file. For this tutorial there's two concepts we need to understand:
Before we can run the collector we need to define a configuration file that has our receiver and exporter defined. Here's the configuration file I used:
receivers:
  otlp:
    protocols:
      http:
      grpc:

exporters:
  logging:
    verbosity: detailed
  otlphttp/jaeger:
    endpoint: "http://jaeger:4318"
    tls:
      insecure: true

service:
  pipelines:
    traces:
      receivers: [ otlp ]
      processors:
      exporters: [ logging, otlphttp/jaeger ]
The main things to point out from the configuration are:
Save this file wherever you want. I saved mine in the folder:
/otel/otel-collector-config.yamlRun the following command to start the OTEL collector with our custom configuration:
docker run --name otelcollector \
  --volume "$(pwd)/otel/otel-collector-config.yaml":/otel-config.yaml \
  --env COLLECTOR_OTLP_ENABLED=true \
  --publish 4318:4318 \
  --network otel-jaeger-network \
  --network-alias otelcollector \
  otel/opentelemetry-collector --config otel-config.yaml
Note that we specify the same Docker network as the one we are running Jaeger in. This is important!
Also note that we published port 4318 so that our Node.js exporter can reach it from outside of Docker.
Once it's running you should see logs appearing in your terminal:

By default you'll see metrics coming from the collector itself.
Set the OTEL_SERVICE_NAME environment variable which tells the SDK what our app/service is called:
export OTEL_SERVICE_NAME="datapool_manager"Now, and here's the beauty of OpenTelemetry, we don't need to change anything at all in our app to pick up these changes. Just run the app (in my case the datapool manager) using:
npm startBecause the Node.js exporter is sending spans to http://localhost:4318/v1/traces (the default) and we're publishing the OTEL collector here, everything should just work.
Next, go ahead and send some requests to your app. In my case I hit the Datapool Manager status page (http://localhost:9192/DPM/STATUS) a few times.
After a few seconds you should see your spans show up in the OTEL collector log:

If there were any issues with your set-up you should see errors show up here.
Provided that the OTEL collector is exporting our spans correctly, we should see them show up in Jaeger. Open Jaeger by going to:
http://localhost:16686/searchYou should see your service in the drop down, exactly how it would be if we were sending our telemetry directly to Jaeger:

Now that we have the OTEL collector in place this opens up future opportunities:
We're still a long way from having a production ready set-up but this is progress. I'll be extending on this in the next article.
Developer Advocate (SRE)

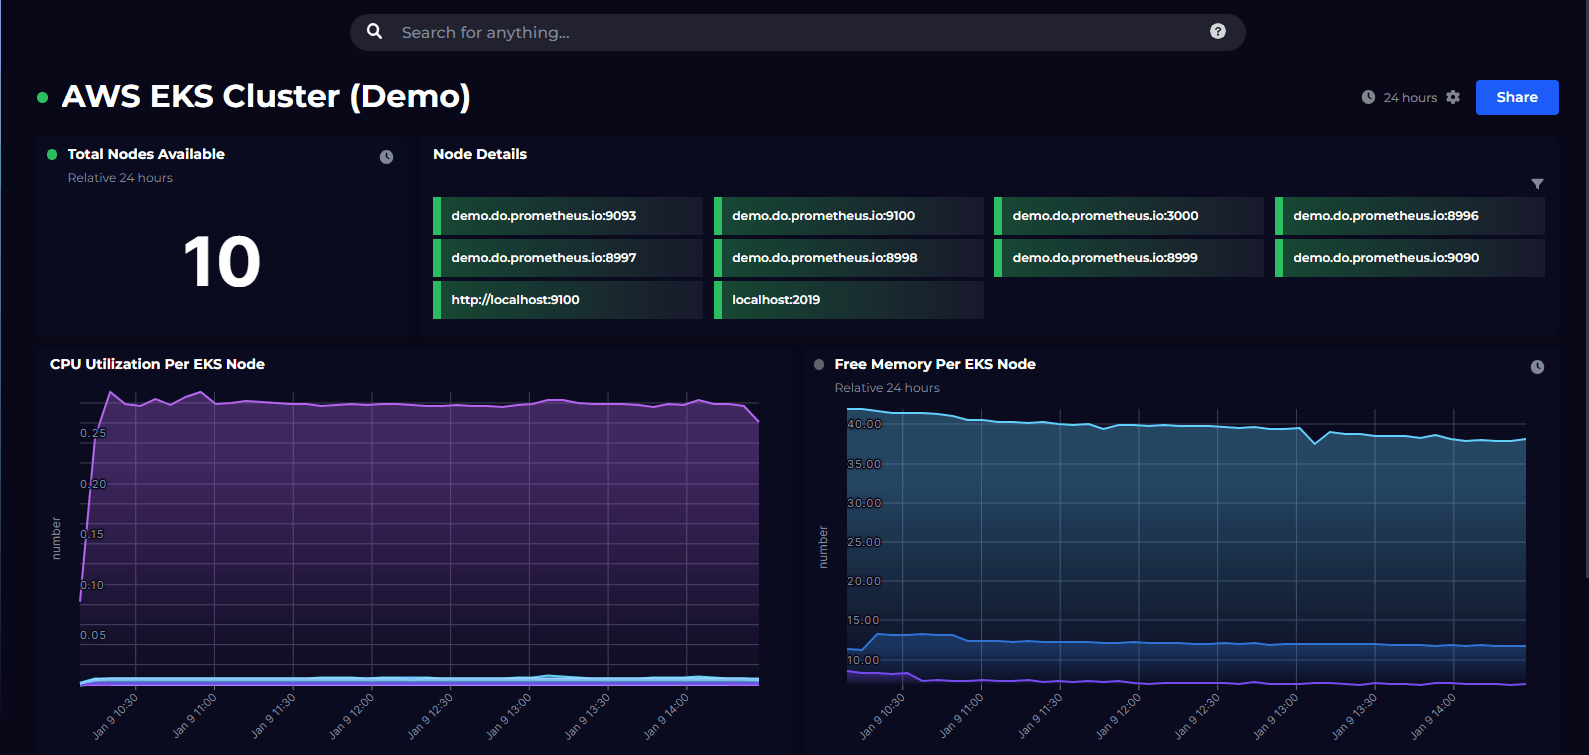
Monitor metrics from Prometheus using custom PromQL queries.

Monitor any metrics from your Elasticsearch environment using custom QueryDSL, Lucene queries and API calls.

Here's what our free tier includes: