Stephen Townshend
Developer Advocate (SRE)
SquaredUp is the smart dashboard for visualizing, analyzing and monitoring 60+ data sources. Learn more

Prometheus is an open source and free to use metrics collection and storage solution. It's used extensively in the industry for monitoring many different technologies.
In this article I will show you how to get Prometheus up and running as a binary, a container running in Docker, and inside Kubernetes.
I am going to describe how to install and run Prometheus on a Mac (because that's what I'm using). The process for running it on Windows is not that different than Mac, so hopefully you'll be able to follow along.
For this step I will use the UI. If you would like instructions on how to install Prometheus from a terminal, you can check out this article which shows you how.
Visit the Prometheus downloads page (https://prometheus.io/download/) and pick the binary which matches your OS (pick Darwin for MacOS). You will end up downloading a compressed tarball (.tar.gz archive). Your file will have a name following the format...
prometheus-X.XX.X.darwin-amd64.tar.gz(Where X.XX.X is the version number).
Move the archive to wherever you would like to run it from and double click it. Finder will automatically unzip it in the current folder.

Before we go any further, open up a terminal session or your IDE inside this folder.
Regardless of how we run Prometheus there is one constant, the Prometheus configuration file. This YAML file tells Prometheus what metrics to scrape (collect), how often to scrape, where to send the data, etc.
You don'tneed to modify the default configuration file that comes with Prometheus to run it. You can leave the configuration to the default and Prometheus will monitor itself.
NOTE: In order to monitor your own services or systems you will need to add scrape configs that point to wherever your metrics endpoints are exposed. For this tutorial, I'm not going to do that, but feel free to add your own metrics endpoints.
Open up prometheus.yml in whatever IDE or code editor you like. I'm using Visual Studio Code. Here's the default configuration I see which came with my fresh installation:
# my global config
global:
  scrape_interval: 15s # Set the scrape interval to every 15 seconds. Default is every 1 minute.
  evaluation_interval: 15s # Evaluate rules every 15 seconds. The default is every 1 minute.
  # scrape_timeout is set to the global default (10s).

# Alertmanager configuration
alerting:
  alertmanagers:
    - static_configs:
        - targets:
          # - alertmanager:9093

# Load rules once and periodically evaluate them according to the global 'evaluation_interval'.
rule_files:
  # - "first_rules.yml"
  # - "second_rules.yml"

# A scrape configuration containing exactly one endpoint to scrape:
# Here it's Prometheus itself.
scrape_configs:
  # The job name is added as a label `job=<job_name>` to any timeseries scraped from this config.
  - job_name: "prometheus"

    # metrics_path defaults to '/metrics'
    # scheme defaults to 'http'.

    static_configs:
      - targets: ["localhost:9090"]
For simplicity, I'm not going to add a new scrape config. What I am going to do (purely for the purposes of simplifying this guide) is remove all the unnecessary config that I don't need. Here's what my config file looks like now:
global:
  scrape_interval: 30s
  evaluation_interval: 25s

scrape_configs:
  - job_name: "prometheus"
    static_configs:
      - targets: ["localhost:9090"]
Save this file.
If you haven't already, open a terminal window and navigate to the Prometheus installation folder. To run Prometheus simply use the command:
./prometheus(This will automatically pull in the configuration inside prometheus.yml when you run it)
When I tried to do this, something went wrong. Prometheus is not a verified Apple product so it threw up this error:

Normally when you download an app and run it from Finder it gives you the option to trust the app, but here I'm running Prometheus for the first time from the terminal. To work around this:
With that sorted, go ahead and run Prometheus using the terminal command above. Unless you changed the configuration, Prometheus will be running on port 9090. Verify that it's running by visiting...
http://localhost:9090...in a browser. You should see the Prometheus UI. Try typing "go" into the query field and you should see a bunch of out-of-the-box metrics relating to the Go language (which Prometheus is built on):

At this point you're running Prometheus locally on your Mac, but managing binaries can be a pain. Keeping the software up to date is a manual process and requires more effort than is desirable. How else can we run Prometheus?
Before you continue, make sure Prometheus is no longer running! Otherwise you will run into port conflicts when you try running Prometheus via Docker or Kubernetes.
Running Prometheus as a Docker container is a great way to run it on your local machine for development and testing purposes. Keeping Prometheus up to date is as easy as telling Docker to download the latest container image each time you run it.
Before you begin you will need Docker Desktop installed on your local machine. This allows you to create, run, and publish Docker container images. You can download it here: https://www.docker.com/products/docker-desktop/
From your terminal you can pull the latest version of the Prometheus Docker container image using:
docker pull prom/prometheus:latestWhat this command does is pull the latest version of the Prometheus container image from Docker Hub and store it in your local Docker image repository. It's as simple as re-running this command before running Prometheus in order to update to the latest version.
Next, you need a Prometheus configuration file. You can use the simplified example from before to start with. Make sure this is in a file called prometheus.yml and navigate your terminal session to the folder where this file resides:
global:
  scrape_interval: 30s
  evaluation_interval: 25s

scrape_configs:
  - job_name: "prometheus"
    static_configs:
- targets: ["localhost:9090"]Containers are ephemeral, including the data they store on their local file system. This means that if you run Prometheus in a container, all of your monitoring data vanishes when that container is shut down.
To work around this we can get Docker to create a persistent storage volume. We can then ask our Prometheus container to use that persistent volume, so that we keep all our historic metrics even if the container is shut down. To create the volume:
docker volume create prometheus-volumeWe've now created a volume called "prometheus-volume" that we will use when we run Prometheus.
If you are using a Mac (or Linux) then use this command to start Prometheus:
docker run --rm --detach \
    --name my-prometheus \
    --publish 9090:9090 \
    --volume prometheus-volume:/prometheus \
    --volume "$(pwd)"/prometheus.yml:/etc/prometheus/prometheus.yml \
    prom/prometheus
On Windows (PowerShell) the command is slightly different (curly brackets for ${pwd}):
docker run --rm --detach \
    --name my-prometheus \
    --publish 9090:9090 \
    --volume prometheus-volume:/prometheus \
    --volume "${pwd}"\prometheus.yml:/etc/prometheus/prometheus.yml \
    prom/prometheus
Here's what the command does:
To test that Prometheus is running open up a web browser and navigate to http://localhost:9090 and you should again see the Prometheus UI:

Before you continue, let's shut down the container so we free up port 9090 again. We can use the container name we gave it earlier to do this:
docker kill my-prometheusFor this section I'm going to make an assumption that:
In saying that, if you haven't used it before, Docker Desktop provides a really easy to use local Kubernetes cluster. I've found it much simpler and more reliable than some other tools like Minikube.
To start a Kubernetes cluster in Docker Desktop go into settings, then Kubernetes, and check the "Enable Kubernetes" box followed by "Apply & restart":

It will take several minutes for your cluster to start up.
In Kubernetes we generally deploy our resources into a namespace which is a way to logically separate out different resources (perhaps owned by different teams). Let's create a namespace for our Prometheus instance to run:
kubectl create namespace prometheus-namespaceYou can check if your namespace was created (and see all your other namespaces) with the command kubectl get namespaces:

Just like our Docker container, if we don't set up a persistent storage for our Prometheus data we will lose all our monitoring history whenever our container shuts down.
We're going to create a persistent volume claim (PVC) which is a request for persistent storage that containers can use. This is not to be confused with a persistent volume (PV) which is the underlying mapping of PVC's to host storage (something that Kubernetes administrators or your cloud provider handle).
Let's keep our storage and app configuration separate. My reasoning for this is that we may want to deploy and delete our app frequently, but we don't want to lose all our historic monitoring data in the PVC.
Create a new file in the kubernetes folder names prometheus-k8s-storage.yaml with the following content:
apiVersion: v1
kind: PersistentVolumeClaim
metadata:
  name: prometheus-data-pvc
  namespace: prometheus-namespace
spec:
  accessModes:
    - ReadWriteOnce
  volumeMode: Filesystem
  resources:
    requests:
      storage: 2Gi
What the above configuration says is to create a PVC (persistent volume claim) in the prometheus-namespace namespace with 2GB of storage and read/write access.
Use the following command to deploy it:
kubectl apply -f ./kubernetes/prometheus-k8s-storage.yamlYou can check that the PVC has been created with:
kubectl get pvc -n prometheus-namespaceMake sure your PVC has a status of "Bound".
I haven't worked with PVCs much before and was interested to see what's happening in the background. My Docker Desktop Kubernetes cluster has automatically provisioned a persistent volume (PV) behind the scenes. I can see the automatically created persistent volume with the command:
kubectl get pv
To deploy Prometheus we will need to create three resources:
Create a new file in your kubernetes folder called prometheus-k8s.yaml with the following content:
apiVersion: v1
data:
  prometheus.yml: |
    global:
      scrape_interval: 30s
      scrape_timeout: 25s

    scrape_configs:
      - job_name: "proemtheus"
        static_configs:
          - targets: ["localhost:9090"]

kind: ConfigMap
metadata:
  namespace: prometheus-namespace
  name: prometheus-configmap
---
apiVersion: v1
kind: Service
metadata:
  name: prometheus-service
  annotations:
    service.beta.kubernetes.io/aws-load-balancer-backend-protocol: "http"
  namespace: prometheus-namespace
  labels:
    app: prometheus
spec:
  type: LoadBalancer
  selector:
    app: prometheus
  ports:
    - protocol: TCP
      port: 9090
      targetPort: 9090
---
apiVersion: apps/v1
kind: Deployment
metadata:
  labels:
    app: prometheus
  name: prometheus-deploy
  namespace: prometheus-namespace
spec:
  replicas: 1
  selector:
    matchLabels:
      app: prometheus
  template:
    metadata:
      labels:
        app: prometheus
    spec:
      affinity:
        nodeAffinity:
          requiredDuringSchedulingIgnoredDuringExecution:
            nodeSelectorTerms:
            - matchExpressions:
              - key: kubernetes.io/arch
                operator: In
                values:
                - amd64
                - arm64
      containers:
        - name: prometheus-container
          image: prom/prometheus:latest
          ports:
            - containerPort: 9090
          volumeMounts:
            - name: prometheus-config-file
              mountPath: /etc/prometheus
            - name: prometheus-data-storage
              mountPath: /prometheus
      volumes:
        - name: prometheus-config-file
          configMap:
            name: prometheus-configmap
        - name: prometheus-data-storage
          persistentVolumeClaim:
            claimName: prometheus-data-pvc
You could, if you wanted, split these out into three different files. I've put them together to make it simpler to deploy.
Here's some key points about what this is doing:
Everything is deployed to the prometheus-namespace namespace.
Check that your pod has deployed correctly with:
kubectl get pods -n prometheus-namespaceMake sure your pod has a status of "Running".
Because of the service I defined I was able to immediately access Prometheus via my web browser at http://localhost:9090:

If you are running in the cloud you will either need to expose Prometheus via a public DNS name, or use the port forwarding feature of kubectl.
So that's how to run Prometheus as a binary, in Docker, or in Kubernetes.
Most of the complexity of Docker and Kubernetes comes from needing to set up persistent storage. If it wasn't for that, it would be very straightforward to run Prometheus in either technology.
In the future I'm hoping to explore how to use Prometheus in conjunction with serverless apps (specifically AWS Lambda), and how to handle collecting metrics from dynamic numbers of containers or nodes without needing to manually configure them all.
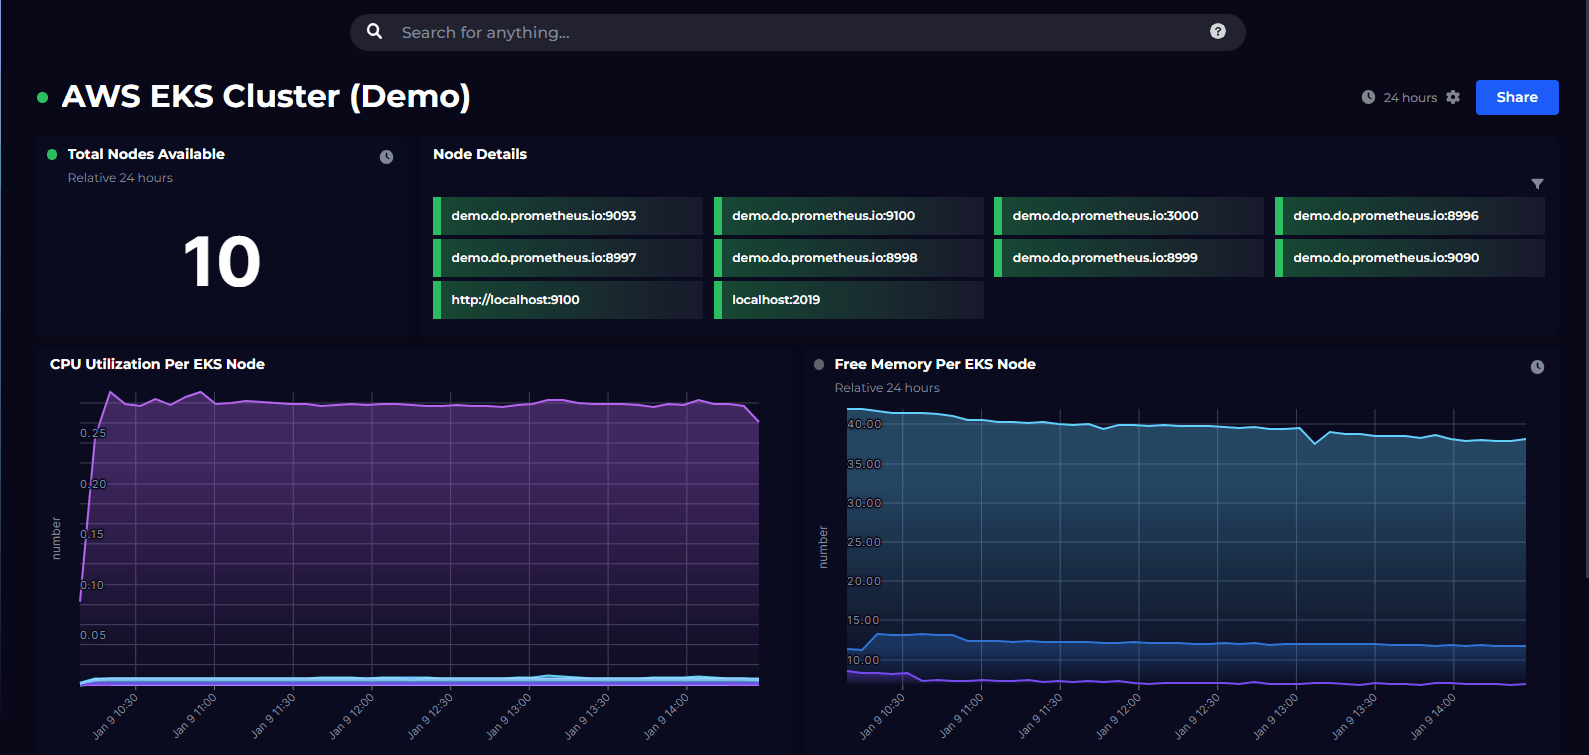
And when you get to visualizing your Prometheus data, don't forget to come back and check out SquaredUp dashboards.
Developer Advocate (SRE)

Monitor metrics from Prometheus using custom PromQL queries.
Dashboard Story

Here's what our free tier includes: