Antrone Simmons
Customer Solutions Engineer, SquaredUp

Getting started with SquaredUp is free and easy. Our free tier includes:
This EKS dashboard displays key metric data from an AWS EKS (Elastic Kubernetes Service) cluster using the Prometheus service so you can visualize resource utilization and health status.
Customer Solutions Engineer, SquaredUp

Engineers need to understand the status of microservices run on EKS, like health status of clusters and nodes, to avoid issues impacting business critical microservices. Plus, you need to be able to keep an eye on EKS resources, including whether the Kubernetes cluster has auto-scaled (where enabled).
Usually, to view these metrics, it requires looking at each EKS cluster and node group individually in the AWS Console, or via another complex third-party dashboarding tool. The data is siloed and difficult to consolidate.
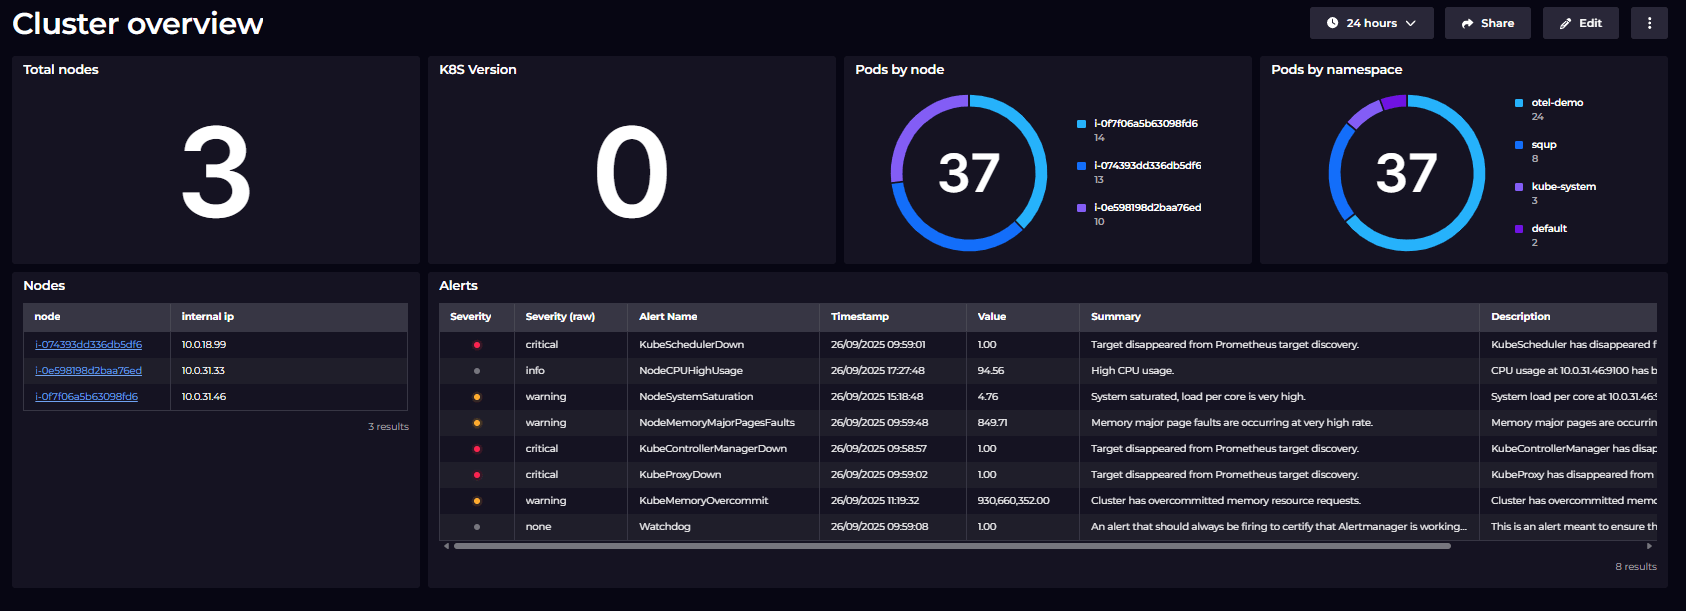
With an EKS dashboard built in SquaredUp you can see the status of all EKS clusters and node groups at once due to the wide scope. Additionally, it allows for teams that might not have AWS Console access to view these metrics in an easily viewable format.
It’s also possible to place important EKS metrics on the same dashboard with microservice level metrics - surfaced with something like Prometheus - which allows engineers to view all the important metrics about a microservice without hopping between dashboards.
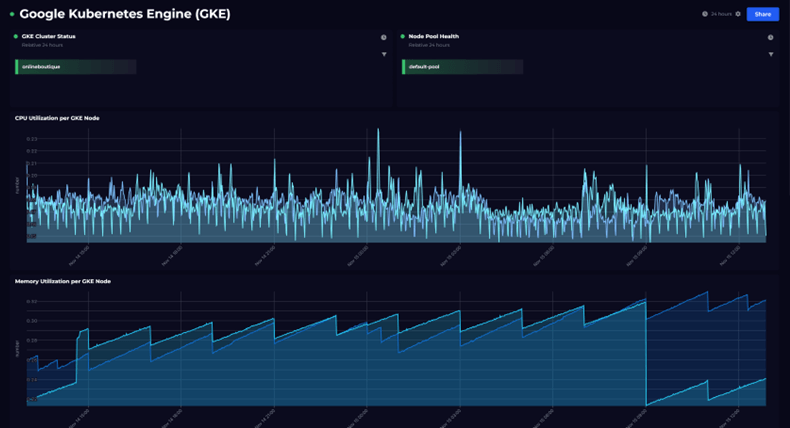
This screenshot shows the top of the EKS dashboard created in SquaredUp. In the top right tile, we have the overall health status of any EKS clusters or node pools in the demo environment. The top two tiles would flag if the resources became unhealthy or unavailable. If any more nodes were created they would automatically be added to all metrics in this dashboard.
The next two tiles below this are ‘CPU Utilization per EKS Node’ and ‘Free Memory per EKS node’. Both metrics are fetched using standard PromQL queries, example:
sum by (pod) (rate(container_cpu_usage_seconds_total[5m]))

(node_memory_MemFree_bytes / node_memory_MemTotal_bytes) * 100
Scrolling down the dashboard, we then have some further metrics regarding storage and network.
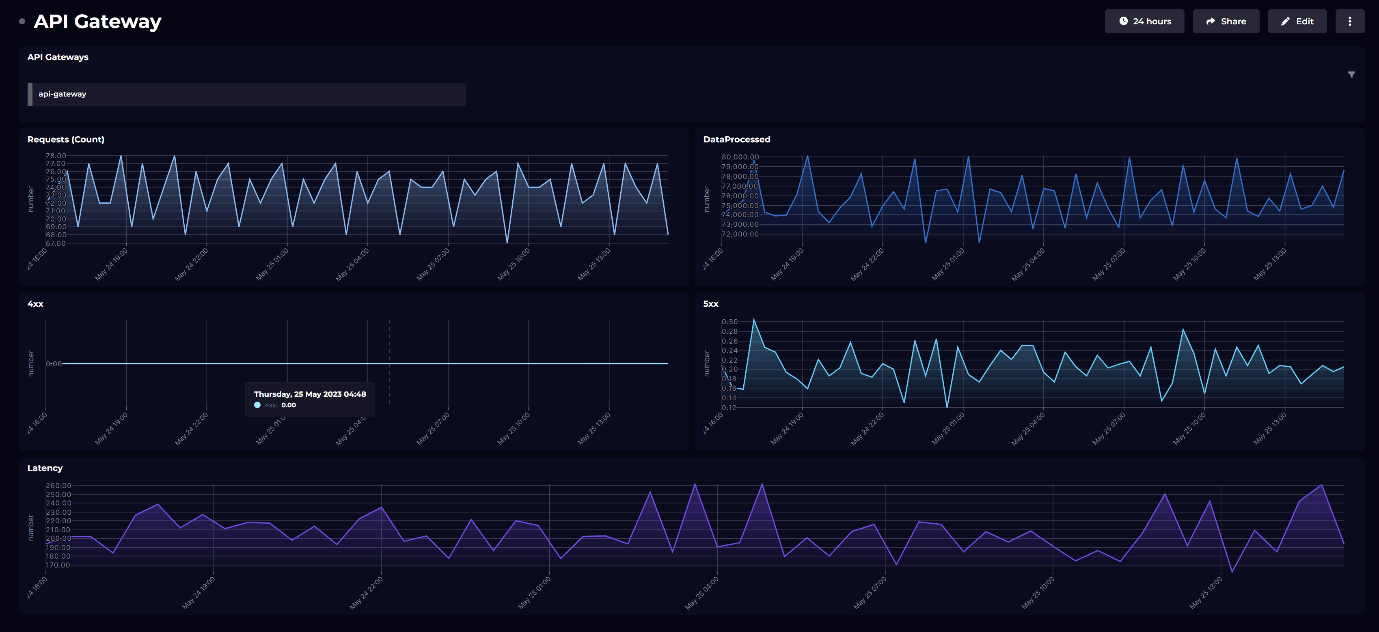
Ephemeral EKS storage is important to understand as it can scale automatically if enabled. Therefore, I have surfaced the currently used storage, and total allocatable. These two can then be compared to understand how much available storage is remaining.
Additionally, total network utilization is useful to understand. If the hosted microservices are publicly available, this metric could be much higher at peak time and could explain performance impact.
This Prometheus Elastic Kubernetes Service (EKS) dashboard is not available out of the box, but you can easily build something similar yourself using the Prometheus plugin.
Simply create a free account to get started, or check out this video to see how easy it is to use our Dashboard Designer:
To see what other dashboards you can create, including a Google Kubernetes Engine dashboard, check out our Dashboard Gallery.