Dan Watts
DevRel Engineer, SquaredUp

Getting started with SquaredUp is free and easy. Our free tier includes:
These out-of-the-box AWS dashboards in SquaredUp give engineers an instant overview of their AWS environments and can be edited to add metrics from other sources for deeper understanding of the environment.
DevRel Engineer, SquaredUp

AWS infrastructure services are enabling critical applications for your customers, or for mission critical services in general. So, it’s vitally important to understand the health and performance of any AWS services in operation.
Issues with AWS services could result in downtime for customers and difficulties recovering the environment. Therefore, it’s extremely important to have good visibility and understanding of the environment so any issues can be resolved proactively.
However, despite AWS CloudWatch being a popular and powerful native solution for AWS visibility, it has limitations. It’s difficult to view metrics from multiple regions and services at once. SquaredUp dashboards allow for the configuration and viewing these metrics with ease.
These six out-of-the-box SquaredUp AWS dashboards allow engineers to have a better understanding of their AWS environments immediately, with the possibility of adding metrics from other sources to support the environment view.
Engineering teams get visibility of key health and performance metrics relating to some of the most popular AWS services. This allows engineers to proactively see any issues with their AWS environments, and even setup monitoring within SquaredUp to alert if any of these surfaced metrics are not to expectations.
This enhanced visibility also allows easier diagnosis of any business services using AWS infrastructure if the issue is not immediately clear, as it will be easier to understand which AWS services may be behaving in unexpected ways using these metrics.
The first OOB dashboard in SquaredUp for AWS shows metrics from AWS API Gateway – a managed service that enables developers and engineers to create and maintain APIs for their applications.
This dashboard shows metrics related to number of requests, total data processed, latency, successful API requests, and unsuccessful API requests. These metrics can highlight the performance of API Gateway, and highlight issues related to latency or failed requests.
AWS ELB (Elastic Load Balancer) is a service that automatically distributes incoming application traffic across multiple targets, such as applications or availability zones.
This dashboard shows metrics such as the number of active connections, total processed traffic, unsuccessful requests, and successful requests.
As an example, a high number of Active Connections could indicate a busy period of application activity. Additionally, a high number of failed requests could indicate a backend infrastructure issue.
AWS Lambda is a serverless compute services that runs application code without the need for traditional surrounding server infrastructure.
This dashboard shows metrics such as Lambda logs, duration, errors, and invocations. These metrics are helpful for understanding the amount of traffic being served by Lambda and could also highlight issues if total number of errors is high.
AWS Route 53 is a highly available DNS web service with automatic scaling, which connects users to internet applications.
This dashboard gives engineers an understanding of their configured zones, DNS records, and total queries to these zones. It’s helpful as it could highlight busy periods for the application being routed to.
AWS S3 is a popular object storage service. This dashboard highlights any created storage buckets in your AWS environment. In addition, metrics are provided on the number of objects and the total storage size. This is useful as there could be cost implications for a high amount of storage used.
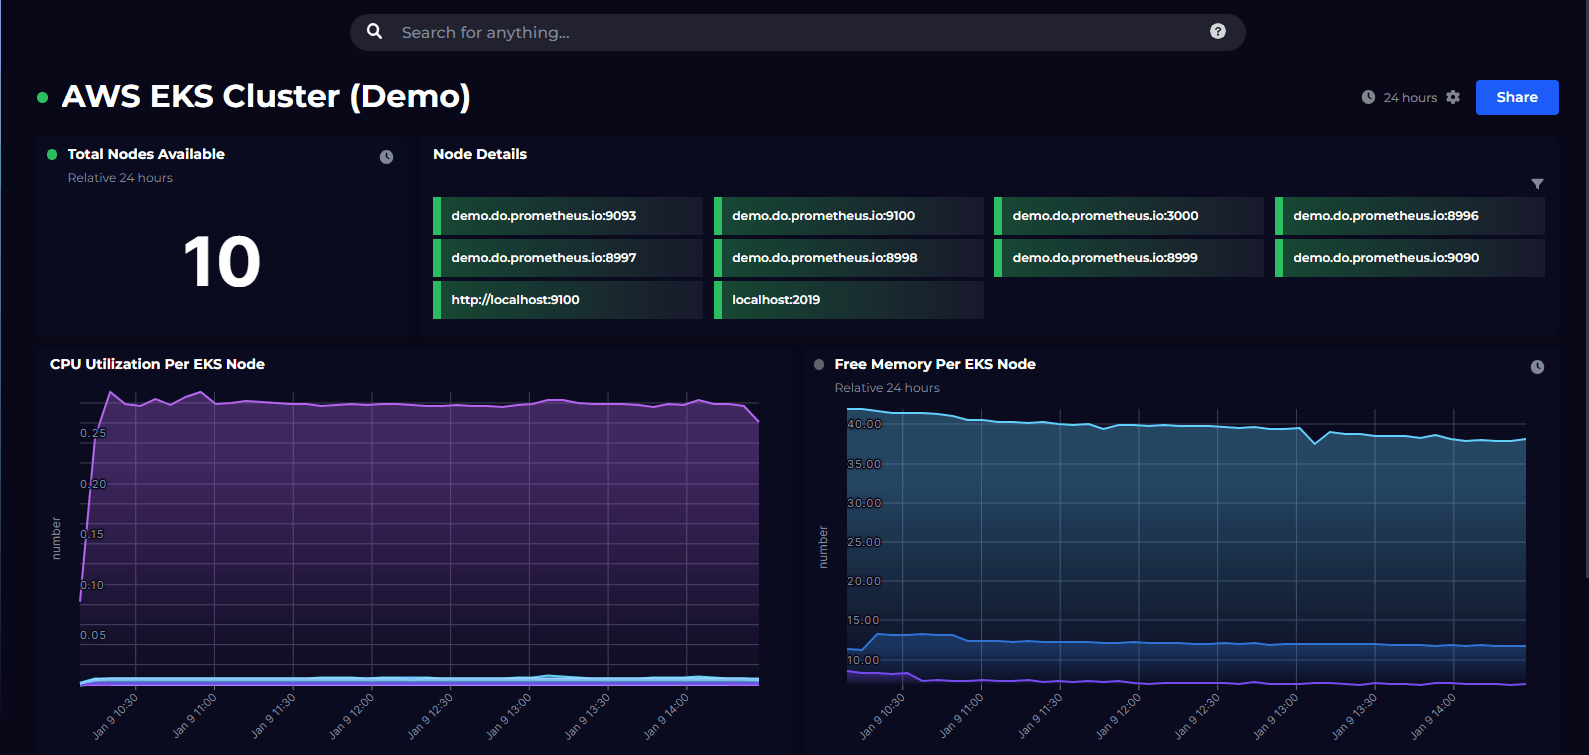
AWS EC2 offers secure and scalable cloud-based compute resource. This allows engineers to create and maintain scalable virtual machines in the cloud. This out of the box SquaredUp dashboard shows the overall health status of your EC2 instances, as well as several key metrics from your instances. For example, CPU utilisation is important to understand as it could indicate if your instances need less or more resources to perform optimally.
All these dashboards have been built using our out of the box dashboards for AWS, so you can expect to be up and running in minutes.
To see what other dashboards you can create, check out our Dashboard Gallery.


Plug directly into AWS CloudWatch for instant dashboards, reports and analytics.