Adam Kinniburgh
VP Innovation, SquaredUp

Getting started with SquaredUp is free and easy. Our free tier includes:
This dashboard tracks my home energy system, which is monitored using Solar Assistant running on a Raspberry Pi in my garage. It shows how much solar power is being generated, how much energy is stored in our batteries, how much energy we’re using, plus other metrics.
VP Innovation, SquaredUp

When you run your house “off-grid”, it’s important to know that the lights will stay on. Keeping track of how much energy we’re using, generating, and storing is key to this. In the same way that electric car drivers get “range anxiety”, I get a similar thing on cloudy days. So, having quick access to the stats is helpful so I can plan when it’s best to run the dishwasher.
Solar Assistant has its own interface that shows some of the same information, but it doesn’t allow me to forecast.
Forecasting solar power is very cool but it requires access to that extra data from OpenWeatherMap and some analytical capabilities. Solar Assistant isn’t configurable in that way.
I also like to look for trends and patterns so being able to customize what the data looks like is key. Solar Assistant uses an embedded version of Grafana for its charts, which is pretty neat, but it’s completely locked down.
I also want to be alerted for things like “the battery is under 20%” or “it’s not going to be sunny tomorrow”, and there’s no monitoring or alerting capability in Solar Assistant.
To get all the data I want in one place, I built a SquaredUp dashboard.
This home solar power dashboard tracks my home energy system, which is monitored using Solar Assistant running on a Raspberry Pi in my garage. The data is pulled from my house via MQTT into AWS Timestream using a serverless function app. That’s then queried by SquaredUp using the AWS plugin.
The dashboard shows how much solar power is being generated, how much energy is stored in our batteries, how much energy we’re using, and various other metrics like system temperature, voltage, and current.
One particularly cool feature of the dashboard is that it uses SQL Analytics to combine my solar power data with the UV Index forecast from the OpenWeatherMap plugin to predict how much solar energy should be available over the next 2 days.

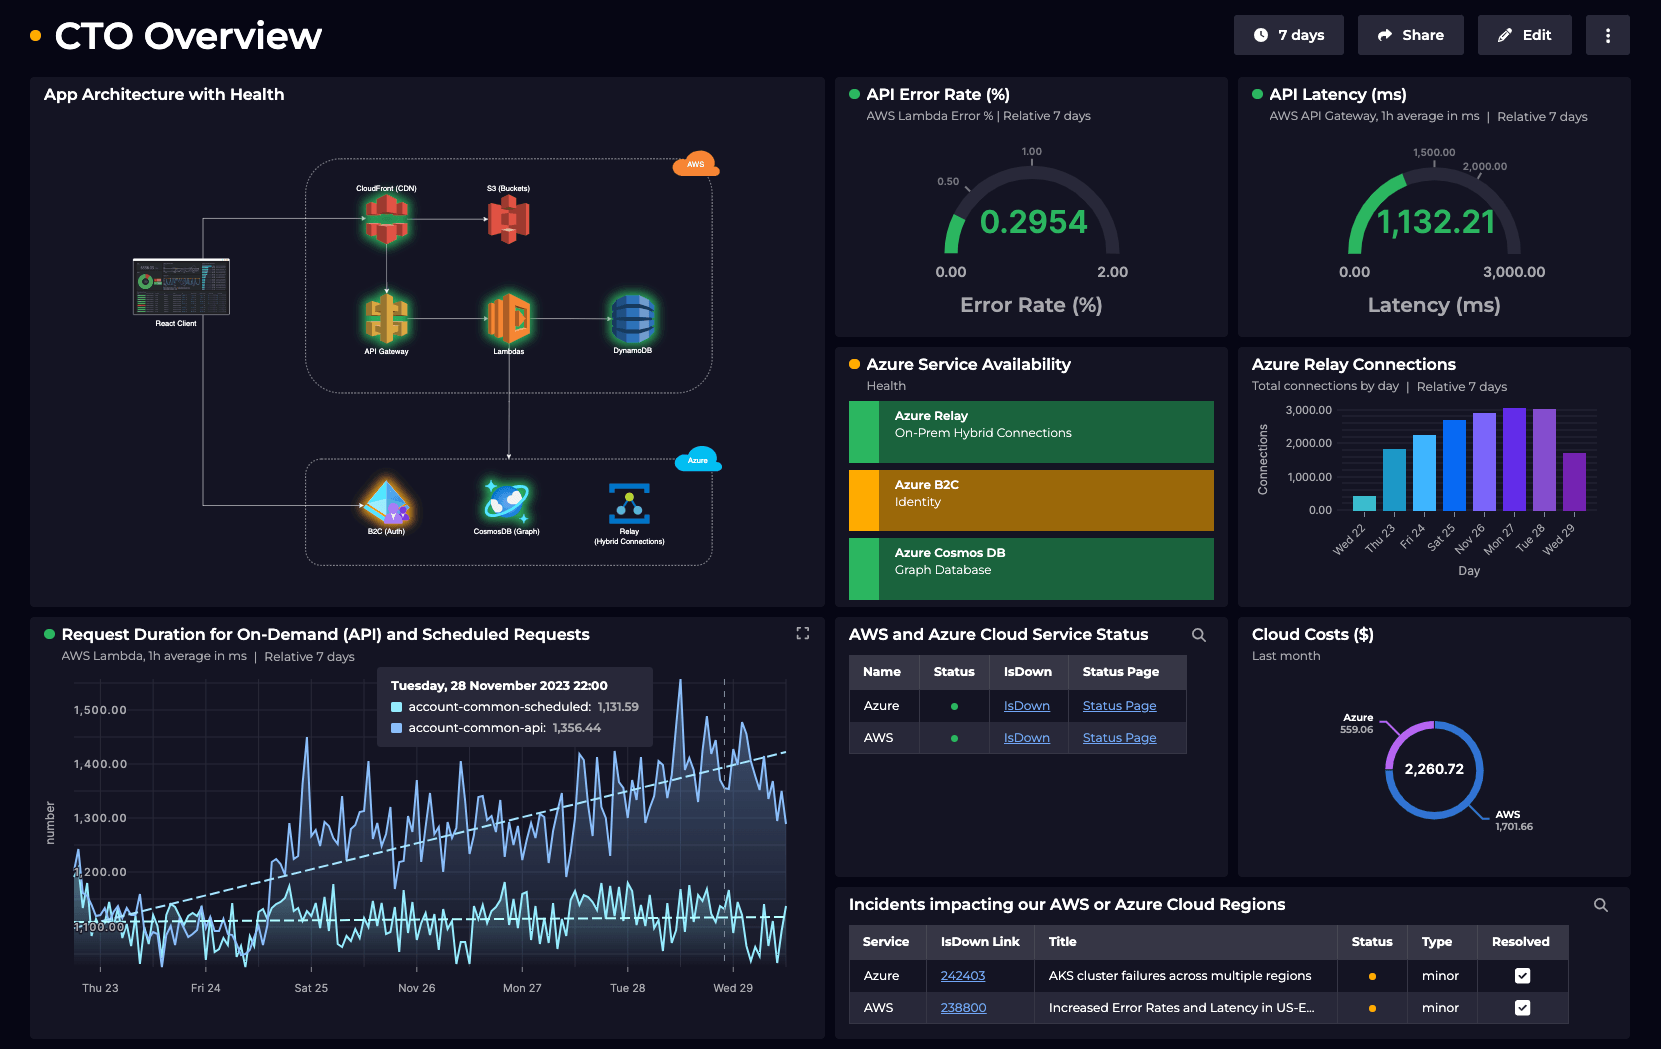
The top row of tiles shows the current values of the metrics most important to me. I used the gauge visualization to represent each value against their maximum/minimum ranges. Plus, with monitoring enabled, I get my alerts and some nice colouring. All the data comes from AWS Timestream using the AWS plugin.

The block tiles on the next row show the current settings for the system’s input and output mode. They’re green when the system is running in solar + battery mode. If the batteries went flat and it wasn’t sunny enough to run the house, we’d start using power from the grid, which is bad, so the blocks would go red. AWS Timestream again.


The line graph tiles on that row and down the right side are showing the same key metrics as the top row, but with 24 hours of historical data, to make it simple to see trends. The “Voltage” tile is a new addition, where one line shows the voltage my system is outputting, and the other tracks the input voltage from the grid. Although it’s not directly useful, I find it interesting to see how variable mains power can be. This was all built using AWS Timestream again.

The larger line graph tile in the bottom-left is the most interesting one. This is where I’m combining 48 hours of historical solar data with 48 hours of future UV Index forecast data from OpenWeatherMap. It took a bit of research to figure out the relationship between the UV Index and the potential amount of solar power (measured in watts), but it’s working quite reliably now. SQL Analytics lets me choose the datasets I need and handle the formula to turn UV into watts. This visualization is shaping up to be very useful (and looks cool too).
My power system data is only made available via MQTT, which is effectively a very noisy stream of data being sent nowhere, unless you have something listening to that stream and doing something with it. Most IoT systems work like this and, on their own, aren’t particularly friendly for dashboarding. I needed to put the data somewhere and AWS Timestream has turned out to be a great choice. Worth looking into if you’re facing a similar challenge with IoT or MQTT.
To expand on this dashboard in the future, I’d add in a tile for our gas usage. Our heating and hot water still comes from our gas boiler, so we do still have some reliance on an energy company. Our supplier is Octopus Energy, and we have a plugin for that, so I’ll likely add a tile tracking our gas usage and monthly costs. Living in the UK, I doubt we’ll make it through the winter on solar power alone. So, if I haven’t invested in wind power by then, I’ll also want to track any electricity we import to charge our batteries overnight.
This Home Solar Power Monitoring dashboard name is not available out of the box, but you can easily build something similar yourself using the AWS plugin.
Simply create a free account to get started, or check out this video to see how easy it is to use our Dashboard Designer:
To see what other dashboards you can create, check out our Dashboard Gallery.


Plug directly into AWS CloudWatch for instant dashboards, reports and analytics.