Dan Watts
DevRel Engineer, SquaredUp

Getting started with SquaredUp is free and easy. Our free tier includes:
This SquaredUp dashboard shows key metrics from any GKE (Google Kubernetes Engine) clusters and node groups, including utilization of resources and health status.
DevRel Engineer, SquaredUp

To view your key Google Kubernetes Engine (GKE) metrics, it would usually require looking at each GKE cluster and node group individually in the Google Cloud Console (GCP) or via another complex third-party dashboarding tool.
In addition, although Cloud DevOps/infrastructure engineers maintain the health of GKE clusters, if GKE runs into issues, it usually has a wider impact. Software engineering teams and, most importantly, end users of the microservices hosted on impacted GKE infrastructure, will feel the effects of issues. So, more teams than just Cloud DevOps/infrastructure engineers need visibility, but the metrics are not easily accessible.
This Google Kubernetes Engine dashboard surfaces useful metrics of Kubernetes clusters and node pools hosted on GKE. This will allow engineers to quickly understand which parts of the Kubernetes clusters are healthy or not, reducing response and resolution times in case of any issues.
With this SquaredUp dashboard, you can also see the status of all Google Kubernetes Engine clusters and node pools at once due to the wide scope. Additionally, it would allow for teams that might not have Google Cloud Console access to view these metrics in an easily viewable format.
As key microservices are usually run on GKE, it is important to understand the status of this infrastructure. Showing the health status of clusters and nodes helps you spot any issues with the infrastructure that could impact business critical microservices. Understanding utilization levels of clusters and nodes is also important as it could help prevent future issues regarding GKE resources. Engineers also want to understand when the Kubernetes cluster has scaled to meet demand (if autoscaling is enabled).
The dashboard we’ve built surfaces these metrics of GKE clusters and node groups. Having the utilization metrics makes it easy to understand if any GKE infrastructure is near their resource limits and if the cluster has scaled automatically. This makes it simple for engineers to understand if they need to react proactively regarding GKE maintenance before any issues occur.
It is also possible to place important GKE metrics on the same dashboard with microservice and application level metrics surfaced with tools like Prometheus, which could allow engineers to view all metrics they need to see regarding a microservice without the need to hop between dashboards.
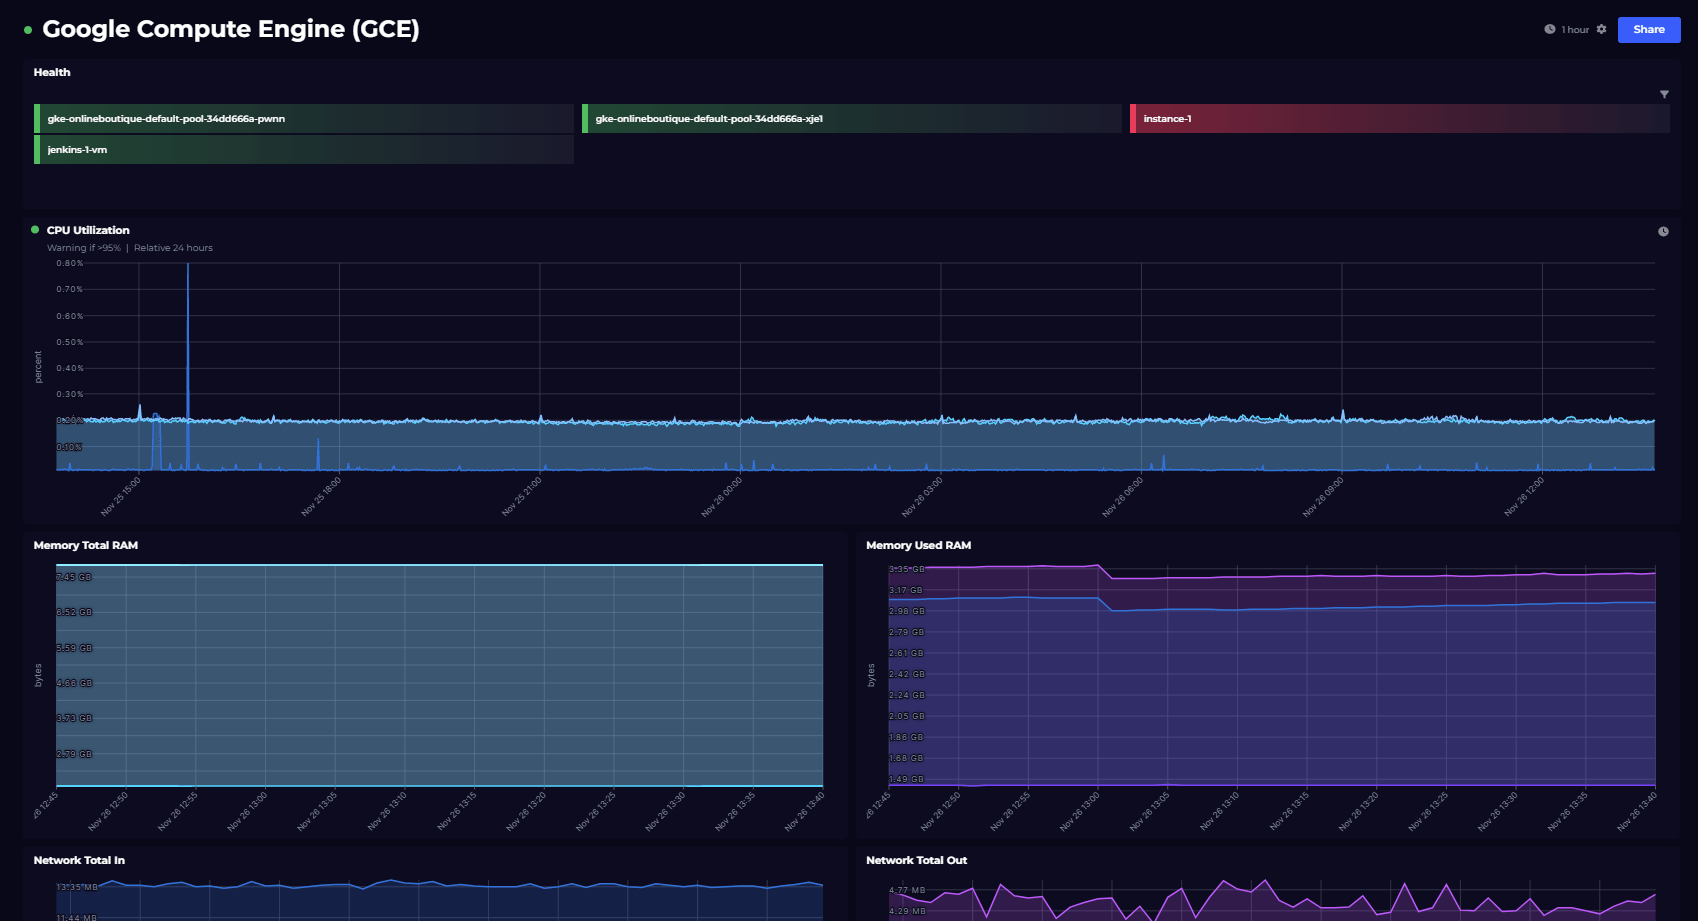
This screenshot shows the top of the Google Kubernetes Engine dashboard created in SquaredUp. In the top two tiles, we have the overall health status of any GKE clusters or node pools in the demo environment. These two tiles would flag if the resources became unhealthy or unavailable. Right now, there is only one cluster and node pool, but if any more were created they would automatically be added to all metrics in this dashboard.
The next two tiles below this are ‘CPU Utilization per GKE Node’ and ‘Memory Utilization per GKE node’. Both metrics are fetched using standard MQL queries, example:
fetch k8s_node
| metric 'kubernetes.io/node/memory/allocatable_utilization'
| group_by 1m,
[value_allocatable_utilization_mean: mean(value.allocatable_utilization)]
| every 1m
| group_by [resource.node_name],
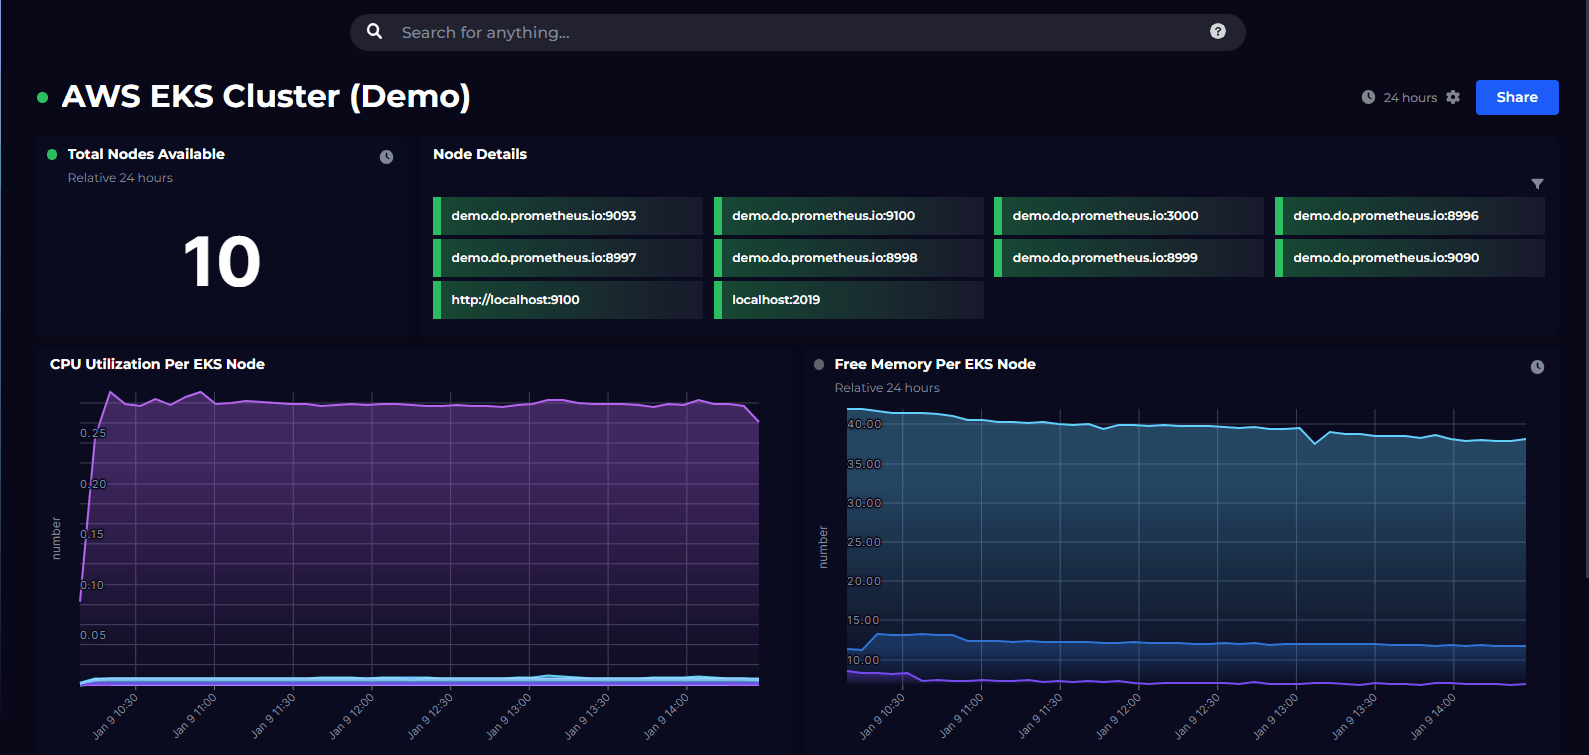
[value_allocatable_utilization_mean_aggregate: aggregate(value_allocatable_utilization_mean)]Scrolling down the dashboard, we then have some further metrics regarding storage, network, logs, and cost.
Ephemeral GKE storage is important to understand as it can scale automatically if enabled. Therefore, I have surfaced the currently used storage, and total allocatable. These two can then be compared to understand how much available storage is remaining.
Additionally, total network utilization is useful to understand. If the hosted microservices are publicly available, this metric could be much higher at peak time and could explain performance impact.
This dashboard is available out of the box, so you can be up and running in minutes.
To see what other dashboards you can create, including a Google Compute Engine dashboard, check out our Dashboard Gallery.