Dan Watts
DevRel Engineer, SquaredUp

Getting started with SquaredUp is free and easy. Our free tier includes:
This Google Compute Engine dashboard shows key metrics about any GCE instances, managed instance groups, and related resources such as GCE disks. These metrics include utilization of resources and health status.
DevRel Engineer, SquaredUp

GCE (Google Compute Engine) is your core service for running virtual machines of your server operating systems. However, when a GCE instance runs into issues, it impacts users most – they're unable to access services or parts of services. Therefore, it’s important to understand the health status and availability for this virtual machine infrastructure.
However, to monitor all those metrics requires looking at each GCE instance on a per project or per VM basis in the Google Cloud Console. It’s labor intensive to understand the health status of the whole environment. Additionally, it is not possible to view GCE cost and instance resource metrics together in the Google Cloud Monitoring service, so your data is fragmented.
With SquaredUp, you can build a Google Compute Engine dashboard that surfaces useful metrics for GCE instances with a wide scope. This allows engineers to quickly understand if instances are healthy or not, even if they are part of multiple projects and environments. This reduces response and resolution times in case of any issues, as you can quickly see metrics from all environments on a single dashboard.
You can surface utilization metrics such as CPU, memory, disk, and network so you can proactively respond when GCE instances are near their resource limits or under high load. Alerts can also be configured on these metrics to notify engineers of high load or health issues.
Additionally, teams that don’t have Google Cloud Console access can still view these metrics in an easily digestible format.
You can also place GCE metrics on the same dashboard with VM, OS, and application-level metrics surfaced with another tool - such as New Relic or Dynatrace. No more hopping between dashboards.
Plus, cost is easily viewable on the same dashboard as infrastructure metrics, which is not possible in the native Google Cloud Console monitoring service.
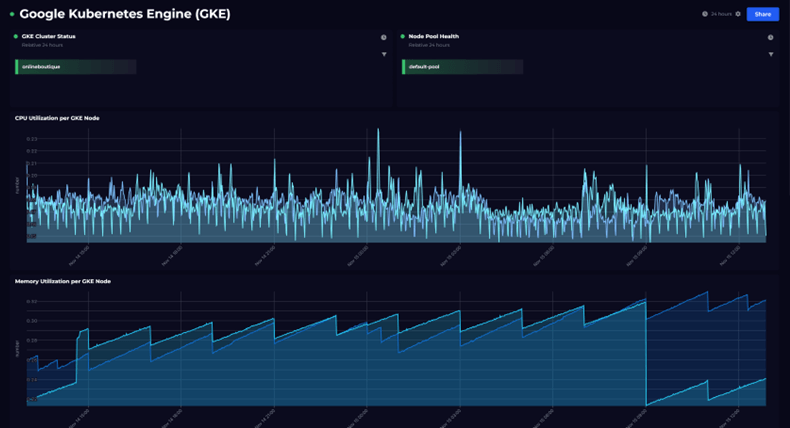
The above screenshot shows the health status of GCE instances that are within scope. Healthy VM instances are shown in green, and stopped or unhealthy instances are shown in red. You can easily configure monitoring and alerts on this metric and any metric within this dashboard.
Near the top of the dashboard, we have metrics for both CPU utilization and memory utilization. There are no custom MQL queries needed to surface this data, it is readily available via the Google Cloud Platform SquaredUp plugin. Multiple GCE instances from multiple environments can be shown in a single visualization.
CPU and memory are important metrics when it comes to VM instances, as high utilization can directly cause performance degradation for application users.
Additionally, GCE instance network ingress and egress metrics are easy to surface without the need for custom queries. High network usage can indicate peak load times and can impact performance and availability.
When maintaining a GCP environment with GCE VM instances, it is important to consider disk health. It is possible to attach multiple disks to a single GCE instance. The next screenshot shows the health status of all disks in an environment. This view can be filtered to only selected VMs or disks if needed. Monitoring and alerting can be configured on this disk health status board.
Additional disk utilization metrics can be surfaced for all VMs in an environment, or even multiple environments on a dashboard if desired. High disk operations could highlight peak usage and could also explain why degraded VM performance could be occurring, so it is a useful metric to surface and monitor.
Cost information for specific Google Cloud Platform services can be surfaced on the same dashboard as GCE resource utilization and health status. This can be useful for product owners to have a complete view regarding both billing and technical status of their environments.
This dashboard is available out of the box, so you can be up and running in minutes.
To see what other dashboards you can create, including a Google Kubernetes Engine dashboard, check out our Dashboard Gallery.