Get started in seconds
Getting started with SquaredUp is free and easy. Our free tier includes:
- 2 users
- 3 data sources
- 10 monitors
- Unlimited dashboards
Getting started with SquaredUp is free and easy. Our free tier includes:
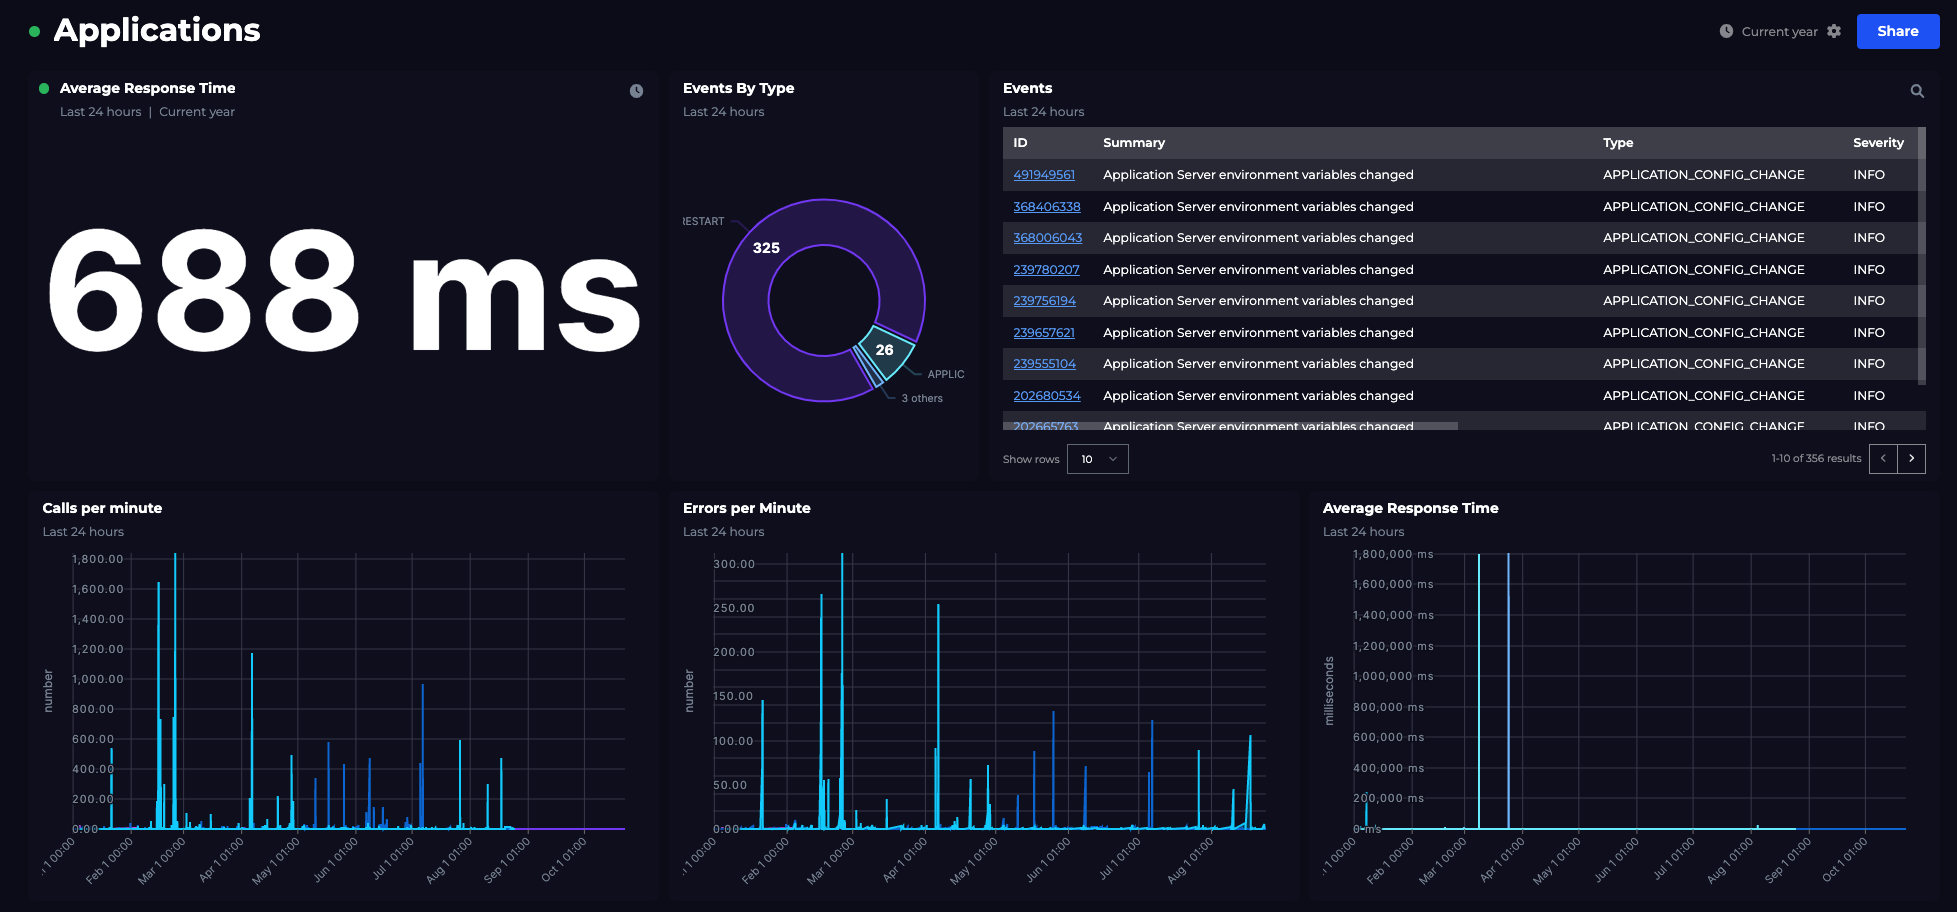
SquaredUp is the smart dashboard that makes it easy to visualize, monitor and share AppDynamics data in minutes.
Get started free


Thanks to my dashboards in SquaredUp, we can have discussions based on facts, not fiction.


Looking to visualize your AppDynamics metrics alongside data locked in another tool? Try our observability portal now.


Plug directly into AWS CloudWatch for instant dashboards, reports and analytics.

Monitor your Azure Application Insights environment using custom Kusto queries.