John Hayes
Observability Advocate, SquaredUp
Moving beyond the basics of setup, we explore the advanced configurations and KQL queries needed to gain deep visibility into Claude Code’s performance, skill usage, and token costs.
In our previous article we looked at the basics of:
In this article, we are going to take a deeper dive into some of the complexities of configuration as well as some of the nuances of analysing Claude telemetry. Before we dive into the code, let us just remind ourselves that our telemetry pipeline looks like this:

That is, we are emitting Claude Code telemetry to an OpenTelemetry Collector. The telemetry is then exported to an Application Insights endpoint and stored in Log Analytics tables. We are running KQL queries using the SquaredUp Azure data source. All of the queries in this article assume that you are using Claude Code 2.1.126 or later.
OpenTelemetry Collector header authentication
In a production environment, you will want to implement multiple layers of security around your OpenTelemetry Collector. In the Azure context, you will probably want to configure it to run as a Private Endpoint. As a further layer of protection, you will also want to define authentication for your OpenTelemetry Collector. This will involve defining an auth token that clients will need to pass to the collector.
config:
extensions:
bearertokenauth:
scheme: "Bearer"
token: ${env:OTEL_INGEST_TOKEN}
health_check:
endpoint: 0.0.0.0:13133
receivers:
otlp:
protocols:
http:
endpoint: 0.0.0.0:4318
auth: authenticator: bearertokenauth
Settings for telemetry intervals
The intervals are expressed in milliseconds and the defaults are 60 seconds and five seconds for logs and metrics respectively:
"OTEL_METRIC_EXPORT_INTERVAL": "60000",
"OTEL_LOGS_EXPORT_INTERVAL": "5000"
For a PoC or if you want to speed up debugging you might want to reduce these intervals. Obviously though, if you reduce the interval this means more events are created in Application Insights, which can lead to an increase in your Azure costs.
The OTEL_RESOURCE_ATTRIBUTES setting is optional, but is extremely valuable in setting attributes that you can later use as dimensions for analysis. These should be used sparingly — you don’t want to stuff values in here on a ‘just-in-case’ basis and obviously you must not include any PII. The names of attributes are not random — they are defined by this OpenTelemetry semantic convention.
The format for attributes is a comma-separated list of key/value pairs:
OTEL_RESOURCE_ATTRIBUTES=service.name=claude-code, service.version=2.1.111, team=platform,department=engineering,[email protected]
Following these conventions means that your telemetry can be analysed automatically in any OpenTelemetry-compliant backend.
OpenTelemetry export for Claude Cowork is configured centrally by administrators in the Anthropic admin portal. Administrators set the OTLP endpoint and authentication headers in the admin console, and Cowork instances automatically pick up the configuration.
Cowork streams events covering:
Prompts are captured by default — you don’t need to explicitly set OTEL_LOG_USER_PROMPTS=1. Because Cowork runs in a sandbox, the OTel gateway endpoint must be allow-listed for outbound network access from the sandbox environment. Without this, telemetry export will fail silently.
Token usage
As we discussed in our first article, a major concern for most managers will be token usage. We also created a visualisation which broke down consumption by token type. In general, we will want to maximise cache reads and reduce expensive cacheCreation events. This is a time-based query which can help to check whether the cache is being invalidated too frequently:
AppMetrics
| where TimeGenerated > ago(24h)
| where Name == "claude_code.token.usage"
| extend TokenType = tostring(Properties["type"])
| where TokenType in ("cacheRead", "cacheCreation")
| summarize Tokens = sum(Sum) by bin(TimeGenerated, 5m), TokenType
This will create a line graph like the one below:

Distributed tracing in Application Insights is actually quite fragmented and is split across a number of different tables:
The OperationId (effectively the trace ID) and ParentId (the parent span ID) are used to correlate traces across these tables. Typically, we will use traces to investigate errors or performance issues. We might start off with a high-level query like the following:
AppDependencies
| where TimeGenerated > ago(1h)
| where Success == false or DurationMs > 5000
| project TimeGenerated, OperationId, Name, DurationMs, Success
| order by TimeGenerated desc
| take 20
This will provide us with the OperationIds of transactions we might want to investigate. Armed with this ID we can now use the following KQL to reconstruct a full distributed trace for a single operation:
let opId = "abc1234"; // the OperationId you're investigating
union withsource=ItemType AppRequests, AppDependencies, AppTraces, AppExceptions
| where OperationId == opId
| project TimeGenerated, ItemType, Name, Id, ParentId, DurationMs, Message
| order by TimeGenerated asc
The output from this query will be the span tree (from AppRequests/AppDependencies) interleaved with the log records (AppTraces) and exceptions that occurred within those. The result will look something like the table below:

PRO TIP Keep an eye on the duration of the “claude_code.tool.blocked_on_user” event. This actually fires even when auto-approval has been enabled. In that case the values are very short. If the values are weighing in at several seconds for the majority of your calls then you may be losing velocity with too many manual approvals.
To identify spans that are throwing errors we can use this query:
AppDependencies
| where TimeGenerated > ago(24h)
| where Success == false
| summarize Failures = count(), DistinctResults = make_set(ResultCode, 10), ExampleMessage = any(Message) by Name, Target
| order by Failures desc
The Target field plays a significant role here. A single operation can hit multiple targets (different model endpoints), and a failure pattern often correlates with one specific target rather than the operation as a whole.
In our first article, we touched on the importance of skills and why engineering managers might want to track their usage. In this article we will dig a bit deeper into some of the subtleties involved in analysing skills usage.
To track skills we can use the claude_code.skill_activated event. This event fires the moment a skill becomes active in a session. The event carries an invocation_trigger attribute. This is really useful as it distinguishes between:
The following query will list top skills by activation, broken down by whether the user invoked them explicitly or Claude reached for them:
AppTraces
| where TimeGenerated > ago(7d)
| where Properties["event.name"] == "skill_activated"
| extend SkillName = tostring(Properties["skill.name"]), Trigger = tostring(Properties["invocation_trigger"])
| summarize Activations = count() by SkillName, Trigger
| evaluate pivot(Trigger, sum(Activations))
| order by SkillName asc
We can see the result in the line graph below:

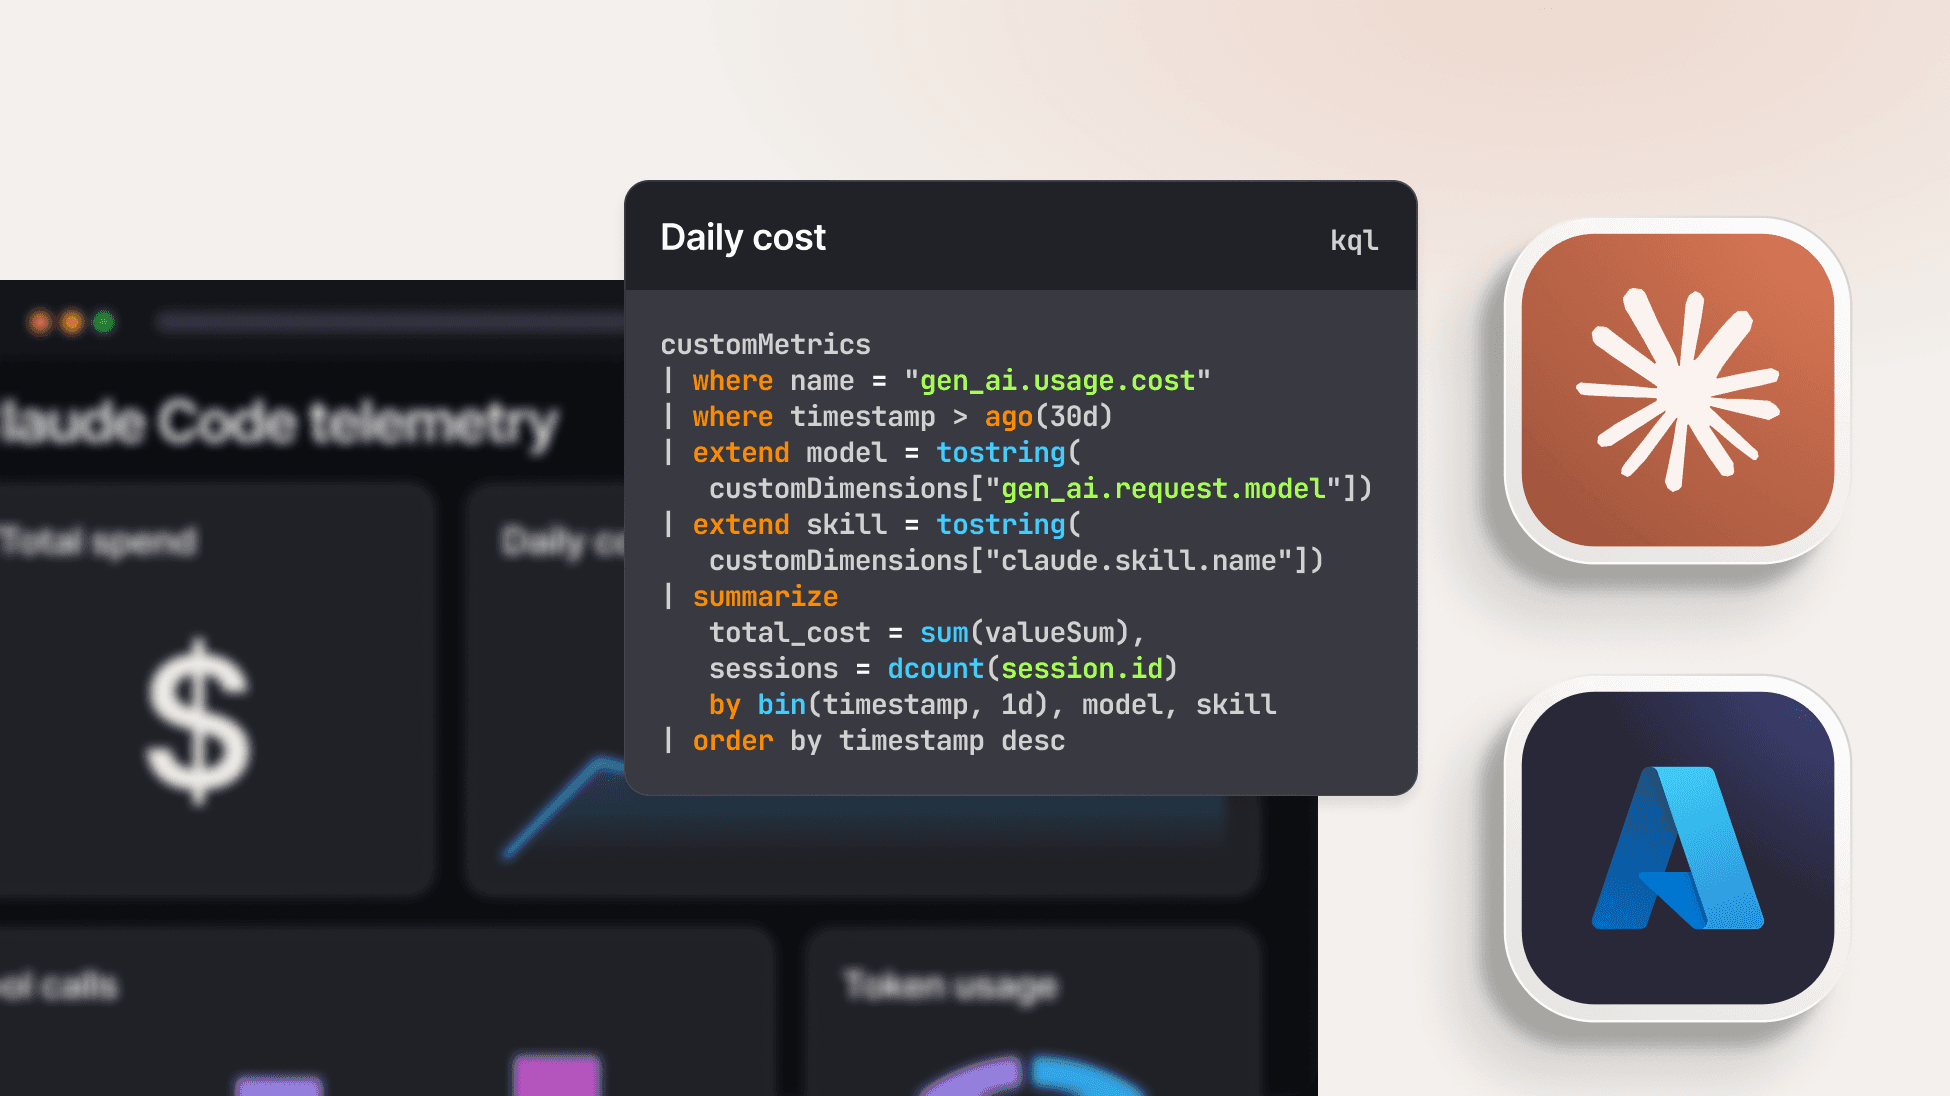
Whilst skills can be extremely valuable tools, you will probably want to track their cost. This is especially relevant for skills installed from third-party libraries. Often, these can be expertly written but can trigger complex and potentially expensive chains of compute activities. This query will provide a breakdown of token costs by skill:
AppMetrics
| where TimeGenerated > ago(7d)
| where Name == "claude_code.token.usage"
| extend SkillName = tostring(Properties["skill.name"]), TokenType = tostring(Properties["type"]), Model = tostring(Properties["model"])
| where isnotempty(SkillName) // exclude requests with no active skill
| summarize Tokens = sum(Sum) by SkillName, TokenType
| evaluate pivot(TokenType, sum(Tokens)) | order by output desc nulls last
Again, in the chart below, we have excluded cache reads as they are inexpensive and will tend to skew the proportions of the visualisation:

As well as monitoring skill and tool usage, you will also be interested in in tracking the usage of third party APIs. This is particularly important for security and governance monitoring.
When Claude fetches a URL via its built-in WebFetch tool, the URL is a tool input argument. In order to capture this data you must enable the log tool details setting:
OTEL_LOG_TOOL_DETAILS=1
The tool_result event supports a tool_input attribute which contains useful data such as file paths, URLs, search patterns, and other arguments. We can use the query below to view details of API calls:
AppTraces
| where TimeGenerated > ago(7d)
| where Properties["event.name"] == "tool_result"
| extend ToolName = tostring(Properties["tool_name"]), ToolInput = tostring(Properties["tool_input"])
| where ToolName == "WebFetch"
| extend Url = extract(@"https?://[^\s""']+", 0, ToolInput) | where isnotempty(Url)
| project TimeGenerated, Url, User = tostring(Properties["user.name"])
| order by TimeGenerated desc
You may need to adjust the regular expression used in this query if your SDK generates URLs in a different format.
API errors
It is also important to make sure that we track errors in accessing third party APIs. These may often be handled silently by Claude and can indicate a problem such as an authentication error, a firewall issue or a usage limit being reached. Interestingly, these kinds of issues are not stored in the Exceptions table – they are actually stored in AppTraces with an event name of “claude_code.api_error”. This query will give us a listing of API errors and will include error messages and status codes.
AppTraces
| where Properties["event.name"] == "claude_code.api_error"
| project TimeGenerated, Model = Properties["model"], ErrorMessage = Message, StatusCode = Properties["status_code"]
| order by TimeGenerated desc
Monitoring of AI, whether it is for coding assistants, agents or LLMs, has emerged as one of the most important new concerns in the observability field. As we have seen in this article, monitoring the use of coding assists is itself a multi-faceted task. Whilst cost and token consumption are concerns that are top of mind, it is also essential so that teams have detailed and accurate analytics on concerns such as usage patterns, external access, performance and errors.
Although this discussion has used an Application Insights/Log Analytics architecture, the same principles can be applied to many other stacks. As well as Azure, SquaredUp also has support for the AWS and Azure clouds as well as data sources for a large number of observability backends such as Dynatrace, Datadog, Prometheus, Elastic and many more. This means that you can use the same techniques we have explored here no matter where your telemetry is stored. If you don’t have an account, you can get started with our Free Forever tier - your first smart dashboard is just minutes away.
Observability Advocate, SquaredUp

Getting started with SquaredUp is free and easy. Our free tier includes: