
Noorul Huda N
DevRel Engineer
Sign up for a free account and get visibility in minutes
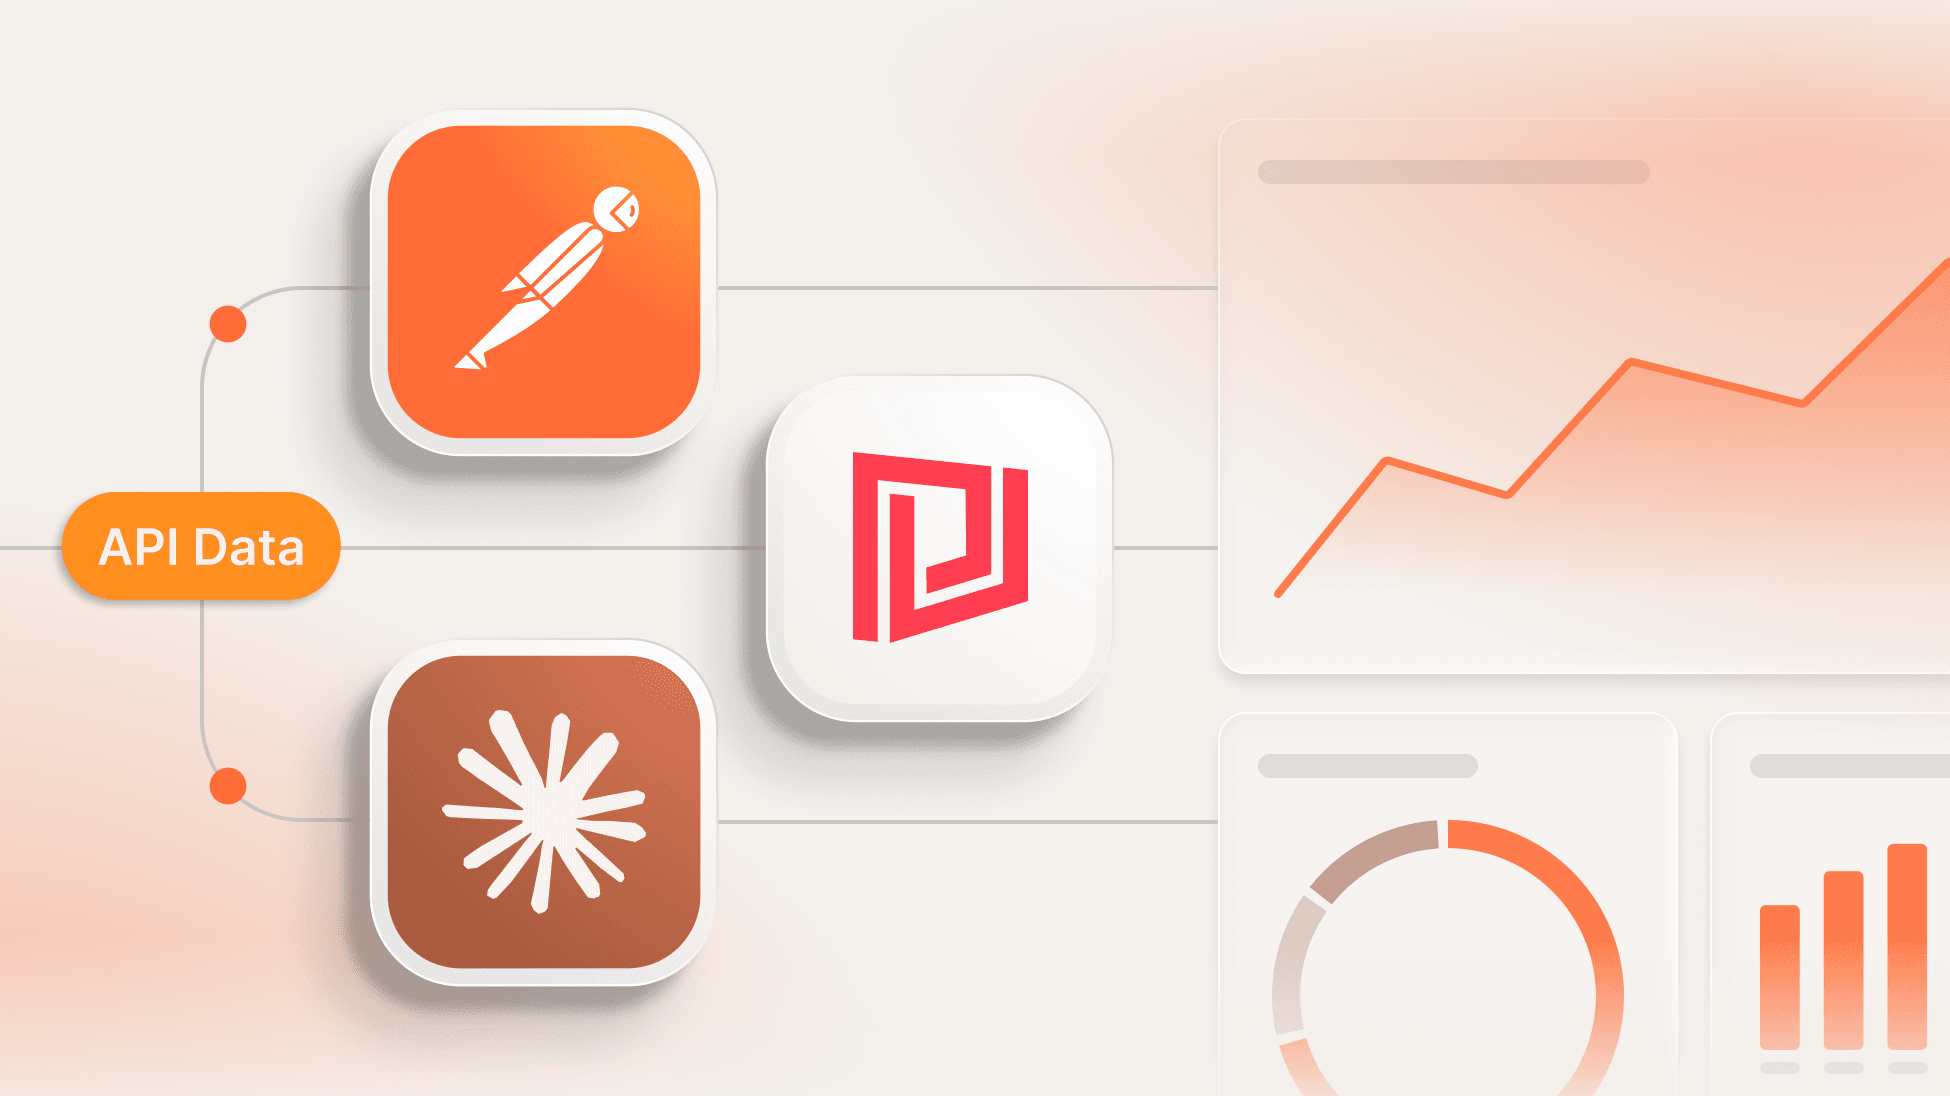
Raw API responses contain valuable information, but visualizing that data makes it much easier to understand, explore, and share. In this guide, we compare the best ways to visualize API responses — from Postman and AI to live dashboards in SquaredUp
APIs power almost everything we use today, from cloud platforms and monitoring tools to ticketing systems and internal applications. But no matter how useful an API is, the response usually arrives as raw JSON.
That's perfectly fine for machines, but much less convenient for people. Whether you're debugging an endpoint, exploring a new service, or building dashboards for your team, you'll probably want a better way to visualize that data.
Fortunately, there are several ways to visualize API responses. Depending on what you're trying to achieve, you might use a tool like Postman, ask an AI assistant to build a quick interface, or connect the API to a dashboarding platform such as SquaredUp.
In this article, we'll compare all three approaches, where each one shines, and the scenarios where each one works best.
Developers usually reach for Postman first when working with a new API. It lets you send requests, inspect responses, test authentication, and understand exactly what an endpoint returns before you write any code.
If all you need is to answer questions like these, Postman is hard to beat:
Instead of reading raw JSON, you can use Postman Visualizer to transform responses into HTML tables, charts, cards, and other custom layouts using JavaScript templates.
This makes it much easier to inspect large responses and quickly understand the structure of your data.
Postman is designed for exploring and testing APIs — not for creating dashboards that people rely on every day.
As your requirements grow, you may want to:
At that point, you'll probably start looking beyond API testing tools.
Over the past year, AI coding assistants have completely changed how many developers work with APIs.
Whether you're vibe coding with Claude or Cursor, using GitHub Copilot, or connecting an AI assistant to your APIs through an MCP server, it's now possible to generate dashboards in minutes instead of building them from scratch.
Instead of writing HTML, CSS, and JavaScript yourself, you simply describe what you want.
For example, you might prompt:
Create a responsive dashboard from this API. Show KPI cards for total requests, success rate, and average response time, along with charts for status code distribution and request trends.
Within seconds, AI can generate an application complete with charts, tables, filters, and a modern user interface.
If you're using Claude with MCP (Model Context Protocol), the experience becomes even more powerful. Claude can inspect your project, generate code directly into your workspace, and quickly build interactive dashboards using libraries such as React, Chart.js, or Tailwind CSS.
This makes AI an excellent choice for:
The biggest advantage is speed. The first version of a dashboard that might once have taken hours can often be generated in just a few minutes.
You have complete control over the interface because you're generating the application itself.
That flexibility also means ownership. Once the code has been generated, you're responsible for hosting it, maintaining it, updating it as APIs evolve, fixing bugs, and deploying new versions.
For many internal tools that's perfectly acceptable. But if your goal is to create dashboards that multiple teams depend on, maintaining another application may not be the best long-term approach.
If your goal isn't just to visualize an API response, but to continuously monitor it, share it, and combine it with data from across your environment, SquaredUp is purpose-built for that job.
Using SquaredUp's Web API data source, you can connect to REST APIs and turn their responses into live dashboards without building and maintaining your own application.
Because the dashboard refreshes automatically, you're always looking at the latest data rather than a single snapshot.
More importantly, the API doesn't have to live in isolation.
You can build dashboards that bring together data from multiple sources — including cloud platforms, monitoring tools, ticketing systems, databases, and other APIs — helping you understand what's happening across your environment from a single place.
For example, imagine you're monitoring backup jobs through an API.
Instead of only showing whether a backup succeeded or failed, you could display that information alongside storage capacity, infrastructure health, related incidents, and other operational data. That additional context makes it much easier to understand why something happened rather than simply knowing that it happened.
As your dashboards evolve, SquaredUp also provides capabilities such as:
Rather than building another application, you're creating dashboards that become part of your monitoring and reporting workflows.
Each approach has different strengths depending on whether you're exploring an API, building a custom visualization, or creating dashboards for ongoing use.
If you need to... | Recommended approach | Why |
|---|---|---|
| Test and debug an API | Postman | Send requests, troubleshoot authentication, validate headers, parameters, and responses before building anything else. |
| Experiment with API requests | Postman | Quickly modify requests, inspect responses, and iterate during API development. |
| Prototype a custom UI fast | AI coding assistants | Generate charts, tables, and layouts in minutes from a pasted API response. |
| Build a one-off internal tool | AI coding assistants | Create a custom application tailored to your needs, with full control over the UI and logic. |
| Keep data refreshing automatically, with minimal setup | SquaredUp | AI can build this too, but you're writing and maintaining the polling logic. SquaredUp gives you scheduled refresh out of the box. |
| Combine data from many systems without much engineering effort | SquaredUp | AI can integrate multiple sources through custom code. SquaredUp does it with 100+ pre-built datasources and a data-mesh architecture that avoids moving the data at all. |
| Monitor something long-term, with low ongoing maintenance | SquaredUp | Achievable in a custom build, but SquaredUp has rollup and correlation features designed specifically for this, out of the box. |
| Share dashboards broadly, with minimal setup | SquaredUp | One-click sharing to email, Slack, or other destinations with no extra setup required. Dashboards can also be scheduled to send automatically. |
There's no single best way to visualize an API response — it depends on what stage you're at and what you're trying to achieve.
If you're exploring a new API or troubleshooting a request, Postman remains the fastest way to see what's happening under the hood. If you need a custom, one-off interface and don't mind owning the code, AI coding assistants can take you from raw JSON to a working dashboard in minutes.
But visualizing a response is only half the problem. The harder question is usually what does this data mean, and how does it relate to everything else we're monitoring? That's where a platform like SquaredUp earns its place. Rather than just displaying API data, it puts that data in context. It correlates the same entity across other tools, keeps it live without custom polling code, and pulls in related data without a separate integration project for every source.
So the honest breakdown is this: use Postman to understand an API, use AI to prototype something custom and disposable, and use SquaredUp when the goal is a dashboard your team can depend on — one that stays current, connects to the rest of your environment, and gives you context instead of just data.
Postman can visualize API responses using its Visualizer feature, but it's primarily designed for API testing and exploration rather than building live dashboards for ongoing monitoring.
Yes. AI coding assistants can generate dashboards from an API or sample response in minutes. The trade-off is that you'll typically need to host, maintain, and update the generated application yourself.
The best approach depends on your goal. Postman is ideal for testing and exploring APIs, AI coding assistants are great for rapidly building custom interfaces, and dashboard platforms such as SquaredUp are designed for live, shareable dashboards.
DevRel Engineer