Noorul Huda N
DevRel Engineer

Getting started with SquaredUp is free and easy. Our free tier includes:
When your Service Desk works in ServiceNow & your DevOps team works in Jira, incidents that span both teams can fall into the gap. Here’s the dashboard that unites them.
DevRel Engineer
I’ve seen this challenge come up a lot of times: the Service Desk works in ServiceNow, while DevOps teams manage their work in Jira. When an incident needs both teams, things can quickly become unclear — updates live in different places, and there's no single view of what's happening.
It’s a common problem for organizations using more tools. Many try to fix it with extra meetings, manual handoffs, or shared spreadsheets, but those solutions rarely last.
A better approach is shared visibility. By bringing live data from ServiceNow and Jira into one dashboard, everyone can see the full incident journey in real time — from first report to final resolution.
Before you build anything, it's crucial to nail down the core questions your dashboard needs to answer. Here are some of the primary ones:
•How healthy are our incident and change processes right now?
•Which incidents have been escalated from the Service Desk to DevOps (Jira), and what's their current status?
•Are the issues escalated to DevOps being addressed and resolved effectively?
•Where's the workload sitting? Is the Service Desk swamped, or is DevOps carrying the heavier load?
•Are all escalations making it into Jira, or are some being missed?
These questions drive incident reviews and CAB meetings. A unified dashboard makes those conversations faster and data-driven.
SquaredUp provides a single view by connecting directly to ServiceNow and Jira, allowing teams to see live data from both tools in one place without building complex custom integrations.
Here’s how the dashboard is built.

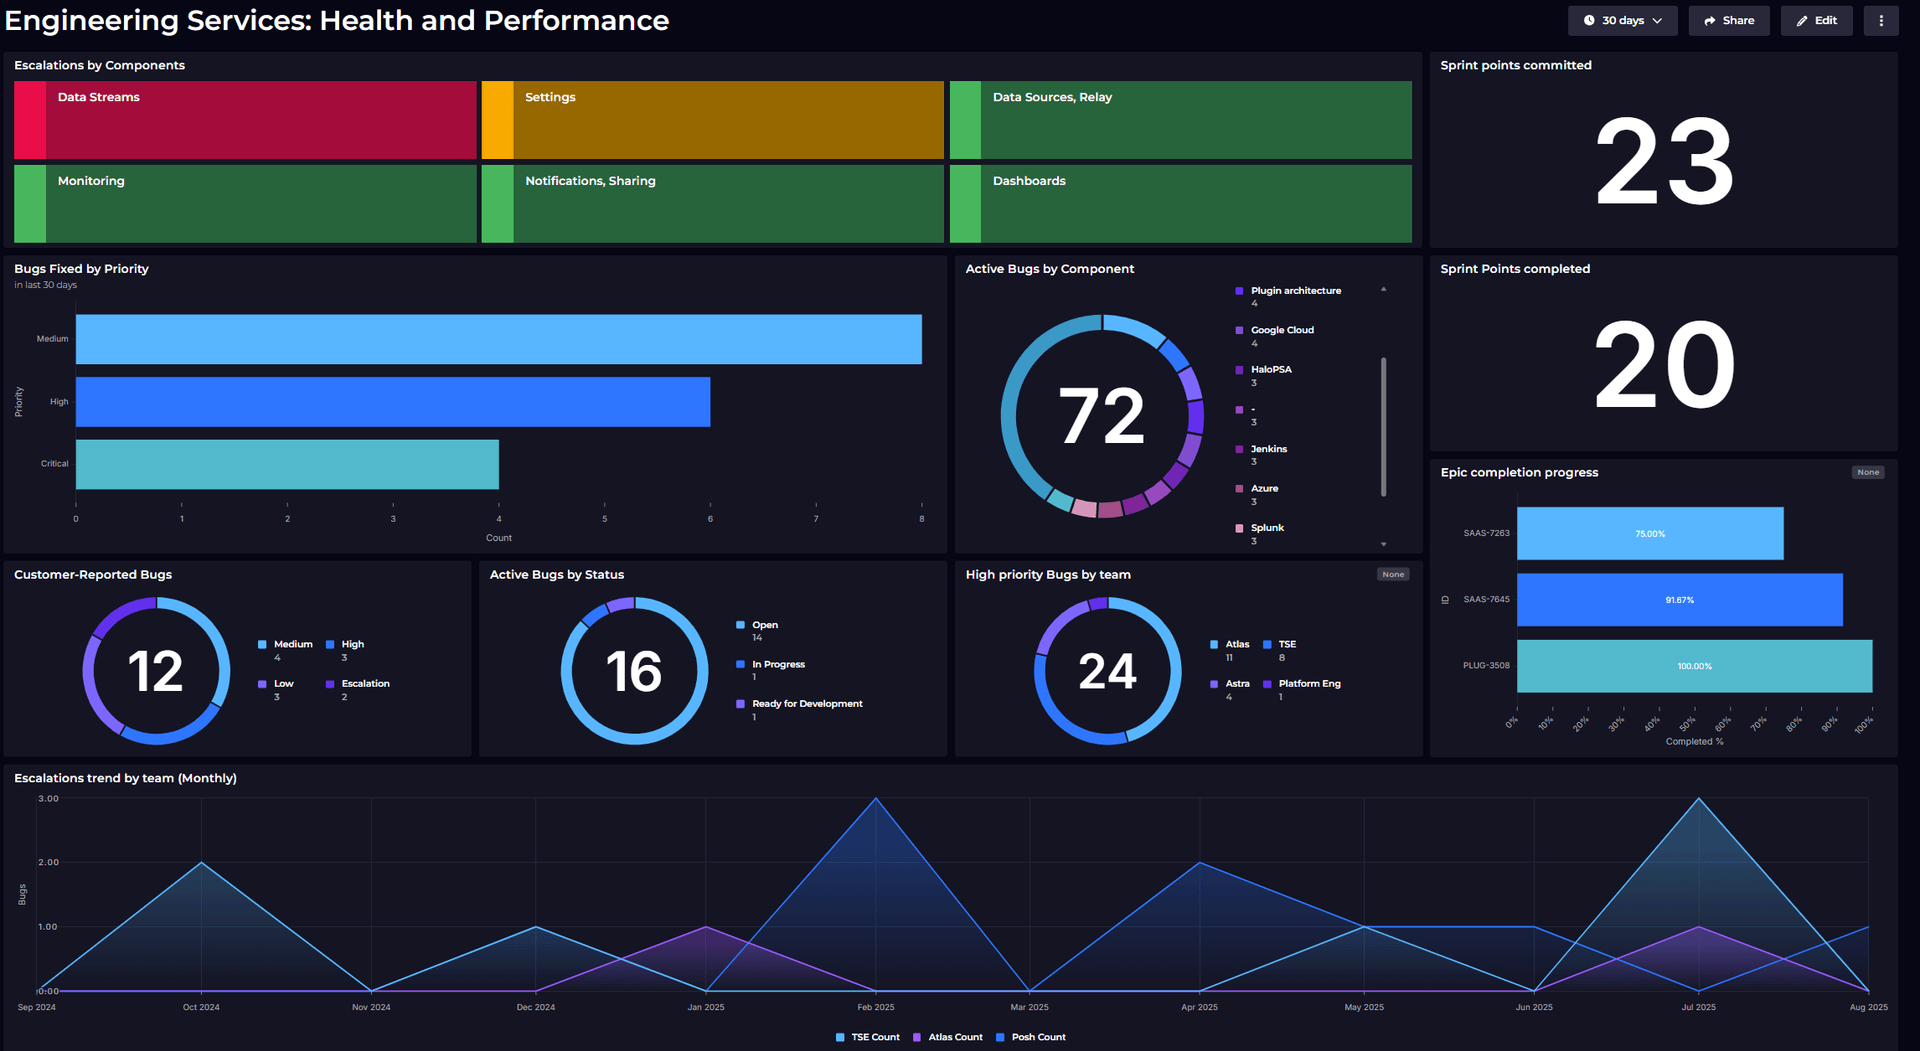
The first row gives a live view of service health. I used RollUp tiles so I could bring KPI values from different dashboards into one place and display their status.

Users can also drill down into each metric for more detail.

Change Success Rate
Percentage of changes completed successfully. A drop here is an early warning that your change process needs attention.
P1 and P2 MTTR
Shows how long it takes to resolve Priority 1 and Priority 2 incidents on average. I kept them separate because they have different targets and impact.
SLA Compliance (Incidents and Changes)
Percentage of incidents and changes resolved within agreed SLA targets, across both Service Desk and DevOps.
Incidents Caused by Change
Percentage of incidents linked to recent changes. This one measure of change risk that's easy to overlook until it's too late.

The next row shows what’s happening over time
Incident workload by team
A bar chart showing open incidents by Service Desk and DevOps. This makes it easy to see where the workload is higher.
Incidents created vs. resolved
A trend line over the last few months. The gap between created and resolved incidents shows whether backlog is growing or shrinking.
Change failure linked to incidents
A table showing incidents caused by changes. This connects change activity directly to service disruption and helps improve change quality.

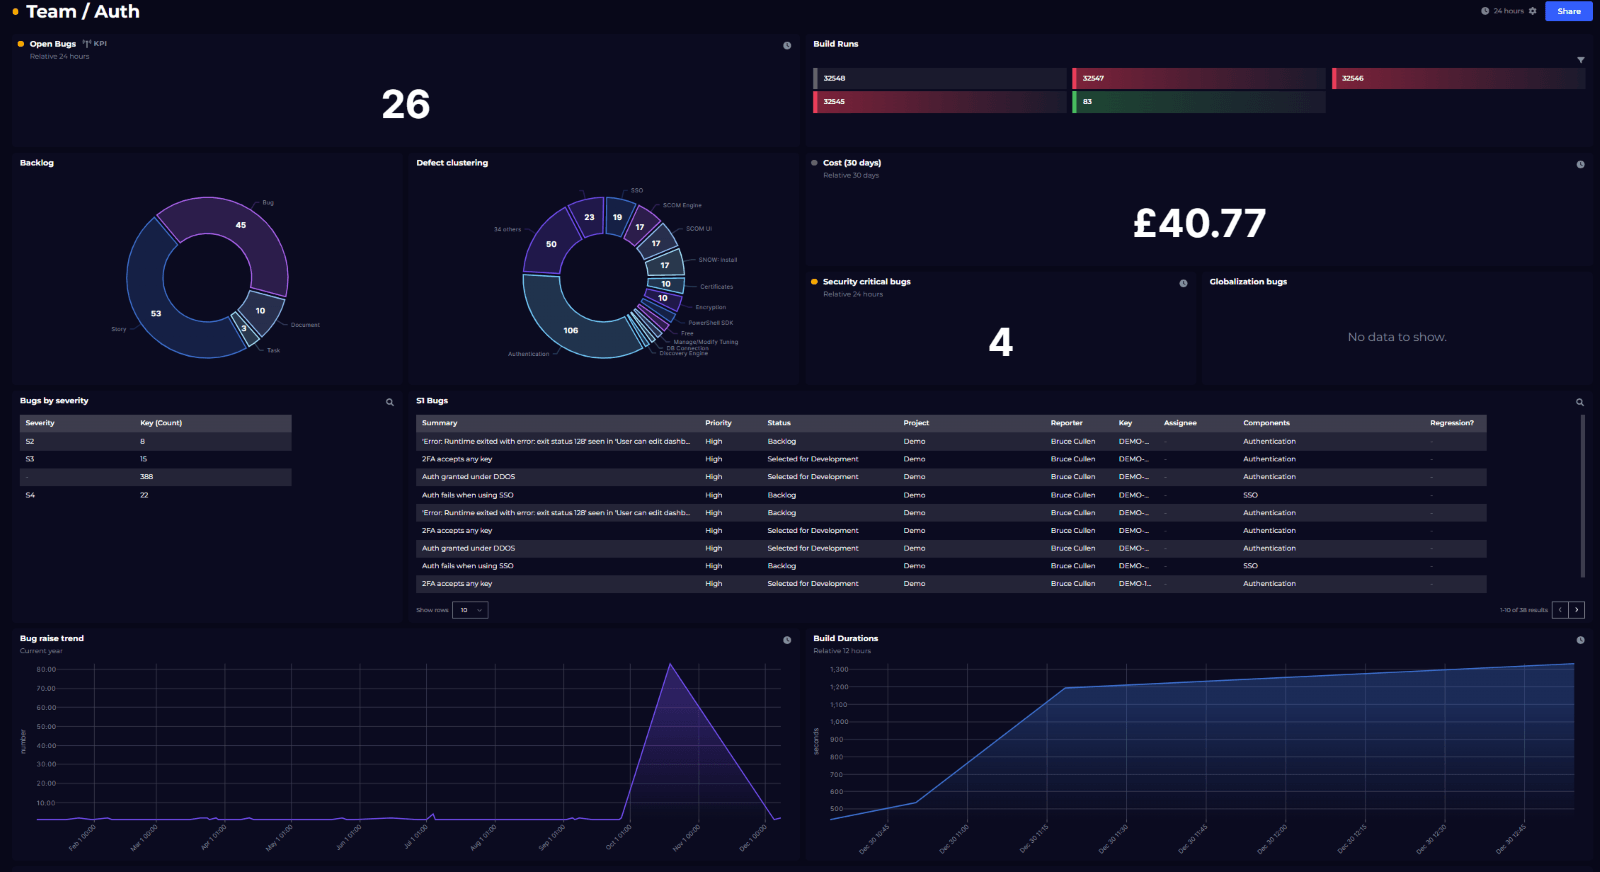
This row focuses on the handoff between ServiceNow and Jira.
Incidents escalated to Jira
A table shoing every Jira issue created from a ServiceNow escalation, with issue type, status, created date, and last updated.
Unsynced escalations
A scalar tile showing count of Incidents that should have a Jira ticket but don't. When a ServiceNow incident is escalated, a Jira issue key should be written back to a custom field on the incident record. If that field is empty, the sync failed — and the DevOps team has never seen the escalation.
Incident SLA status by team
A bar chart showing whether Service Desk and DevOps are meeting SLA targets on shared incidents, side by side.
The value of this dashboard is the ability to connect data that normally lives in separate tools. It helps you see:
These insights are difficult to see when you look at each tool separately. A unified dashboard gives teams the context they need to make faster and better decisions.
If your teams are split across tools, SquaredUp gives you the connection to bring it all into one view.