
Get started in seconds
Getting started with SquaredUp is free and easy. Our free tier includes:
- 2 users
- 3 data sources
- 10 monitors
- Unlimited dashboards
Getting started with SquaredUp is free and easy. Our free tier includes:
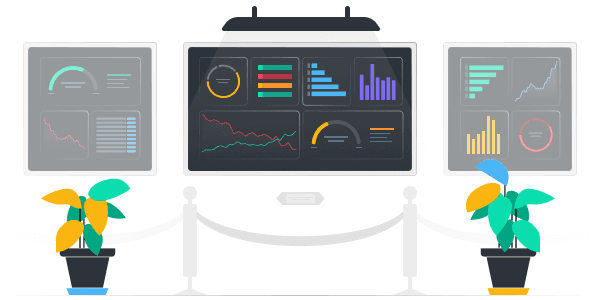
See our smart dashboards in action. Real-life use cases and example dashboards, brought to you by the SquaredUp community.

Since replacing MSPbots with SquaredUp for their HaloPSA dashboards, Focus IT has eliminated hours of manual ticket checking and gained real-time visibility that they can rely on.
Evidi knew they needed better visibility to slash cloud expenses and maximize efficiency for all customers. They found the solution with SquaredUp.

Arup needed org-wide visibility without sacrificing team data ownership. Most tools forced a trade-off. SquaredUp didn't.

Since adopting SquaredUp, DeKind Computer Consultants, a managed IT provider, has eliminated manual reporting and given clients real-time visibility into their own data — resulting in less admin overhead and dashboards that now win new business.

AxioTech was struggling to gain actionable insights from HaloPSA due to a lack of in-house SQL expertise. Today, their leadership enjoys instant executive dashboards, service teams track key performance indicators, and clients receive interactive, data-driven QBR updates.

How we helped a major US manufacturing company pull data from different tools into one highly customized DORA metrics dashboard.

This dashboard displays key KPIs for support tickets over the last 7 days. You can easily report service desk stats to the business without giving individuals Zendesk access.

A CTO Overview dashboard to give the CTO and engineering management team a high-level view of the availability and performance of our SquaredUp SaaS application.

These eight out-of-the-box Azure cost monitoring dashboards allow you to effortlessly aggregate and visualize Azure spend across multiple regions and accounts – and even across multiple clouds or hybrid architectures.

Our Director of Engineering Services at SquaredUp, Tim Wheeler, gives us a walkthrough of how we use SquaredUp dashboards internally to monitor our Azure DevOps pipelines.

Get full oversight of your DORA metrics with this step-by-step guide on how to build a DORA metrics dashboard in SquaredUp.

When your Service Desk works in ServiceNow & your DevOps team works in Jira, incidents that span both teams can fall into the gap. Here’s the dashboard that unites them.