John Hayes
Observability Advocate, SquaredUp

Harness petabyte-scale speed with ClickHouse and visualize it effortlessly using SquaredUp's new plugin
ClickHouse is redefining the boundaries of analytical database performance. Trusted by hyperscalers like Netflix, OpenAI, and Disney, it delivers sub-second query responses on billions of rows and scales seamlessly to petabyte workloads.
Interacting with a ClickHouse backend does not require using any complex protocols or learning a new query language. You can retrieve any data you need simply by running SQL queries.
In this article, we explore how you can use the SquaredUp ClickHouse data source to connect to your ClickHouse Cloud databases and get creating smart dashboards in minutes.
Connecting ClickHouse to SquaredUp
To begin, create a new dashboard in SquaredUp and select the ClickHouse data source. Creating the connection to the ClickHouse Cloud is really simple. Just enter the URL of your instance and then a username and password. The credentials refer to database accounts, not the personal credentials you use to connect to the cloud service

That’s it! Now we can start running queries.
Visualizing system metrics
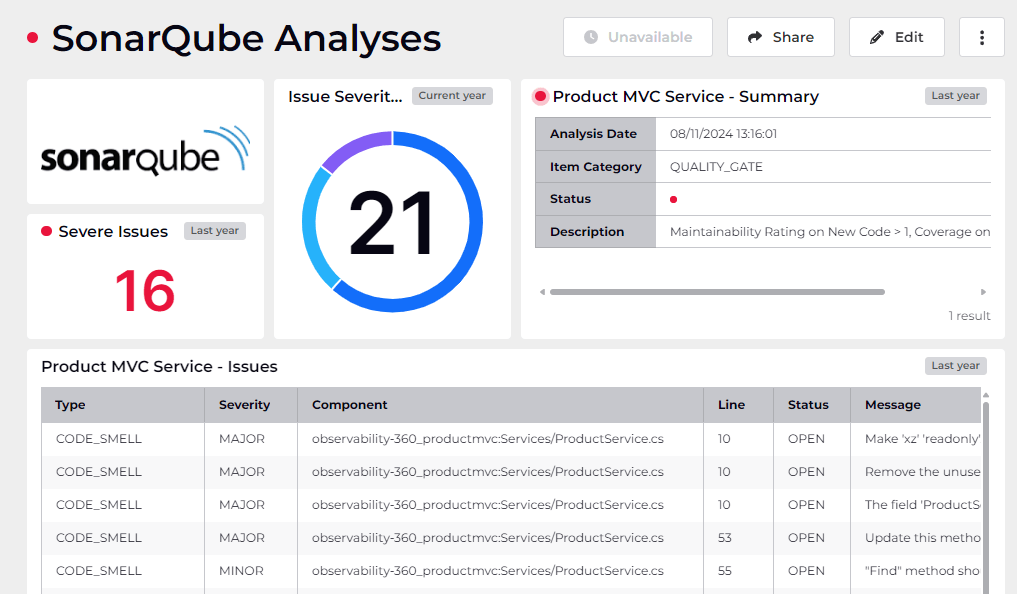
Next, we are going to walk through how you can create a dashboard like the one below to view metrics on the health and resource usage of our ClickHouse instance.

We just need to select the ClickHouse data source and then select the Query data stream:

And now we can just enter our SQL. To view average CPU usage per second, we will enter this query:
SELECT
toStartOfInterval(event_time, INTERVAL 60 SECOND) AS t,
avg(ProfileEvent_OSCPUVirtualTimeMicroseconds) / 1000000 AS avg_cpu_seconds
FROM system.metric_log
WHERE event_date >= toDate(now() - INTERVAL 1 HOUR)
AND event_time >= now() - INTERVAL 1 HOUR
GROUP BY t
ORDER BY t
WITH FILL STEP 60
LIMIT 60
FORMAT JSON
Once the data stream is configured, visualize the results using SquaredUp’s line chart visualization.

To display disk space usage, we used a gauge visualization.

Note that ClickHouse reports free disk space rather than used space. To present the data more intuitively, we applied a transformation in SquaredUp to compute Used Space as a custom field. As you can see, this is achieved with a simple expression using mustache-like syntax.

If you want to create a full system monitoring dashboard like the one above, you can find more SQL queries on this page on the ClickHouse website. Also, quite fittingly for a SQL-centered product, ClickHouse has very conveniently made a full set of queries available in the system.dashboards table. To view them just run this query:
SELECT * FROM system.dashboards
Querying and visualizing data
Let’s move from infrastructure metrics to business data. For this example, we used the UK House Price dataset referenced in the ClickHouse docs to build the dashboard below:

The document provides full details on how you can create a new ClickHouse database and insert the data. Inserting a dataset of 33 million rows took under a minute on our AKS node (4 vCPUs, 16 GiB RAM). Once the query has completed you will have a database called 'uk'.
The process for creating the tiles in this dashboard follows the same procedure that we used for creating the system dashboard. All we are doing is querying a different database. If you want to explore this dataset, you can find a number of sample queries on this page on the ClickHouse website.
The visualization below shows average house prices for multiple districts over a number of years.

In this visualization, we have grouped our data by both Year and District, with each District being represented by a separate line on the graph. To achieve this, we just need to configure the District field as a series in our mapping:

A similar principle applies to the Most expensive neighbourhoods visualization below.

In this query, our data is grouped first by Town and then by District. You can see this in the raw data for the query below:

Again, to break the bar chart down into sub-groupings, we configure the District field as a Series in our visualization mapping:

Conclusion
ClickHouse brings unmatched analytical performance and, when paired with SquaredUp, delivers a streamlined dashboarding experience for engineering and operational teams.
In this guide, we've shown how to deploy ClickHouse, connect it to SquaredUp using the Web API plugin, and build dynamic dashboards from system metrics to rich business data.
Watch this space for our upcoming dedicated ClickHouse plugin, which will simplify integration even further.
Observability Advocate, SquaredUp


Getting started with SquaredUp is free and easy. Our free tier includes: