Sameer Mhaisekar
DevRel Engineer, SquaredUp & Microsoft MVP

Both SquaredUp and Grafana Cloud have Azure plugins. But how do they compare?
If you’re looking for a dashboarding solution today, chances are you’ve looked at Grafana or SquaredUp — or both. Grafana is a popular open source dashboarding tool with on-prem and cloud variants, while SquaredUp is the SaaS, cloud-based unified dashboarding solution. Both offer a comprehensive list of data sources that they can plug into and build dashboards.
As such, they both also offer an integration with Azure - which is the focus of our discussion today.
Alright, let's start with Grafana first. In Grafana Cloud, you have two options to dashboard Azure. One is by using the Azure Monitor data source, while the second option is by enabling Azure Observability under Observability > Cloud Providers section. The difference between these two options is the first one connects directly to the Azure APIs to fetch data, while the other one actually ingests data into Grafana’s native data stores.
There are pros and cons to each of those approaches, including differences in costs and data management etc. (you guessed it - the latter is more expensive), but to keep the comparison apples to apples, we are going to compare the classic, Azure API pull-based Azure monitor data source, to SquaredUp’s Azure plugin as that is the route SquaredUp also takes to get data - without storing anything.
Question | Grafana (Azure Monitor DS) | SquaredUp (Azure plugin) |
|---|---|---|
| Metrics, logs and traces | ✅ Yes | ✅ Yes |
| KQL-based solutions (Sentinel, Resource Graph, etc.) | ✅ Yes | ✅ Yes |
| Azure cost data | ❌ No - separate, manual Web-API data source needed | ✅ Yes - built in data streams for quick access |
| Azure Monitor alerts | ❌ No - separate, manual Web-API data source needed | ✅ Yes - built in data streams for quick access |
| Health Model | ❌ No | ✅ Yes - built in via rollups |
| Ease of use | ⚠️ More complex and cluttered UI - especially for new users | ✅ Easy and simple UI - even for non-Azure or non-technical users |
| Ease of sharing | ⚠️ Private view-only users consume a license - sharing at scale means added cost | ✅ Private view-only users do not consume a license - essentially free sharing at scale |
| Wider Microsoft ecosystem | ⚠️ Some other data sources like ADO, CosmosDB, etc. exist but they are few. Also treated only as a source of telemetry. | ✅ Integrates and contextualizes more tightly with Microsoft ecosystem like ADO, M365, PowerShell, SCOM, etc. |
When you are adding Azure as a data connection, this is what you see:

There are a few to choose from, but at the end of the day they are only the datastores where your telemetry comes from. We will deploy the one that covers telemetry coming in from most services - the Azure Monitor data source.
So let’s deploy the Azure Monitor data source. It requires us to create an app registration in Azure and give it some permissions so that it can call Azure APIs. You can read about how to deploy it here.
Once successfully configured, we are now ready to create dashboards with it.
SquaredUp has similar experience when it comes to authenticating to the data source - creating an app registration and assigning it reader permissions - but you’ll notice that once connected, SquaredUp actually indexes resources with their properties.

This will come in handy to explore resource-to-resource and resource-to-app relationships later. Read more about deploying the Azure data source here.
Azure platform by default collects a bunch of metrics (non-logs based) automatically as you deploy them. These metrics are stored in Azure-managed metrics database. Some solutions also let you push custom metrics into this database that can be viewed via the metric explorer.
Both SquaredUp and Grafana let you explore these metrics via their respective platforms.

Select the resource, choose the metric you want to display and the data appears.
This is similar to what happens with SquaredUp. However, the resource selection panel is much cleaner here.

Many monitoring and analytics solutions in Azure - such as Azure Monitor, Sentinel, AppInsights, Resource graph, etc. to name a few - are powered by collecting the performance metrics or metadata in log analytics workspaces which can be queried using the KQL.
Both SquaredUp and Grafana give you the ability to scope to these LAWs and to run a KQL query to get insights and build dashboards on them. However, the main difference here is that with Grafana you are playing with the raw KQL for each query, while SquaredUp gives you a quick and easy, “no-code” way to query for common metrics for these resources by way of out-of-the-box data streams. Of course, you also can use your raw KQLs to get the data you want as well.

As you can see, each panel starts with writing a query. You can save these queries to use for later, but that doesn’t change the fact that you have to write one first.

You will notice that while there is a data stream that will let you input a raw KQL query, you already also have a lot of pre-written queries available at hand to get started quickly.
Since many solutions in Azure like Sentinel, App Insights, Resource Graph, data explorer, etc. are KQL-based, with the ability to run raw KQL targeted at the right workspaces both platforms enable you to query these logs.
Cost is one of the most critical aspects to monitor and maintain when you are running workloads in Azure. If left unchecked, the costs can spiral out of budget pretty quickly which is why it is equally important to keep an eye out on them alongside the resource/app metrics.
Grafana does not have this capability, you will need to create separate, manual queries to the cost API to get this data.

SquaredUp offers Cost related data streams out-of-the-box which are capable to provide you cost insights by subscription, service, location, tag, etc. to make sure you and your stakeholders have a transparent understanding of how much it costs to run a workload and identify overspending, or forecast to strategize optimization opportunities.
In Azure Monitor, you can set up alerts to notify you when a value of a performance counter crosses a value or if the availability/status of a resource changes. While you can also set up platform-managed alerts in both SquaredUp and Grafana, the alerts set up in Azure Monitor are useful if you want more custom logic via a KQL query.
SquaredUp allows you also fetch these alerts in the same dashboard as the rest of your metrics so you can have a complete picture of the health and performance of your app. Grafana does not have this capability.

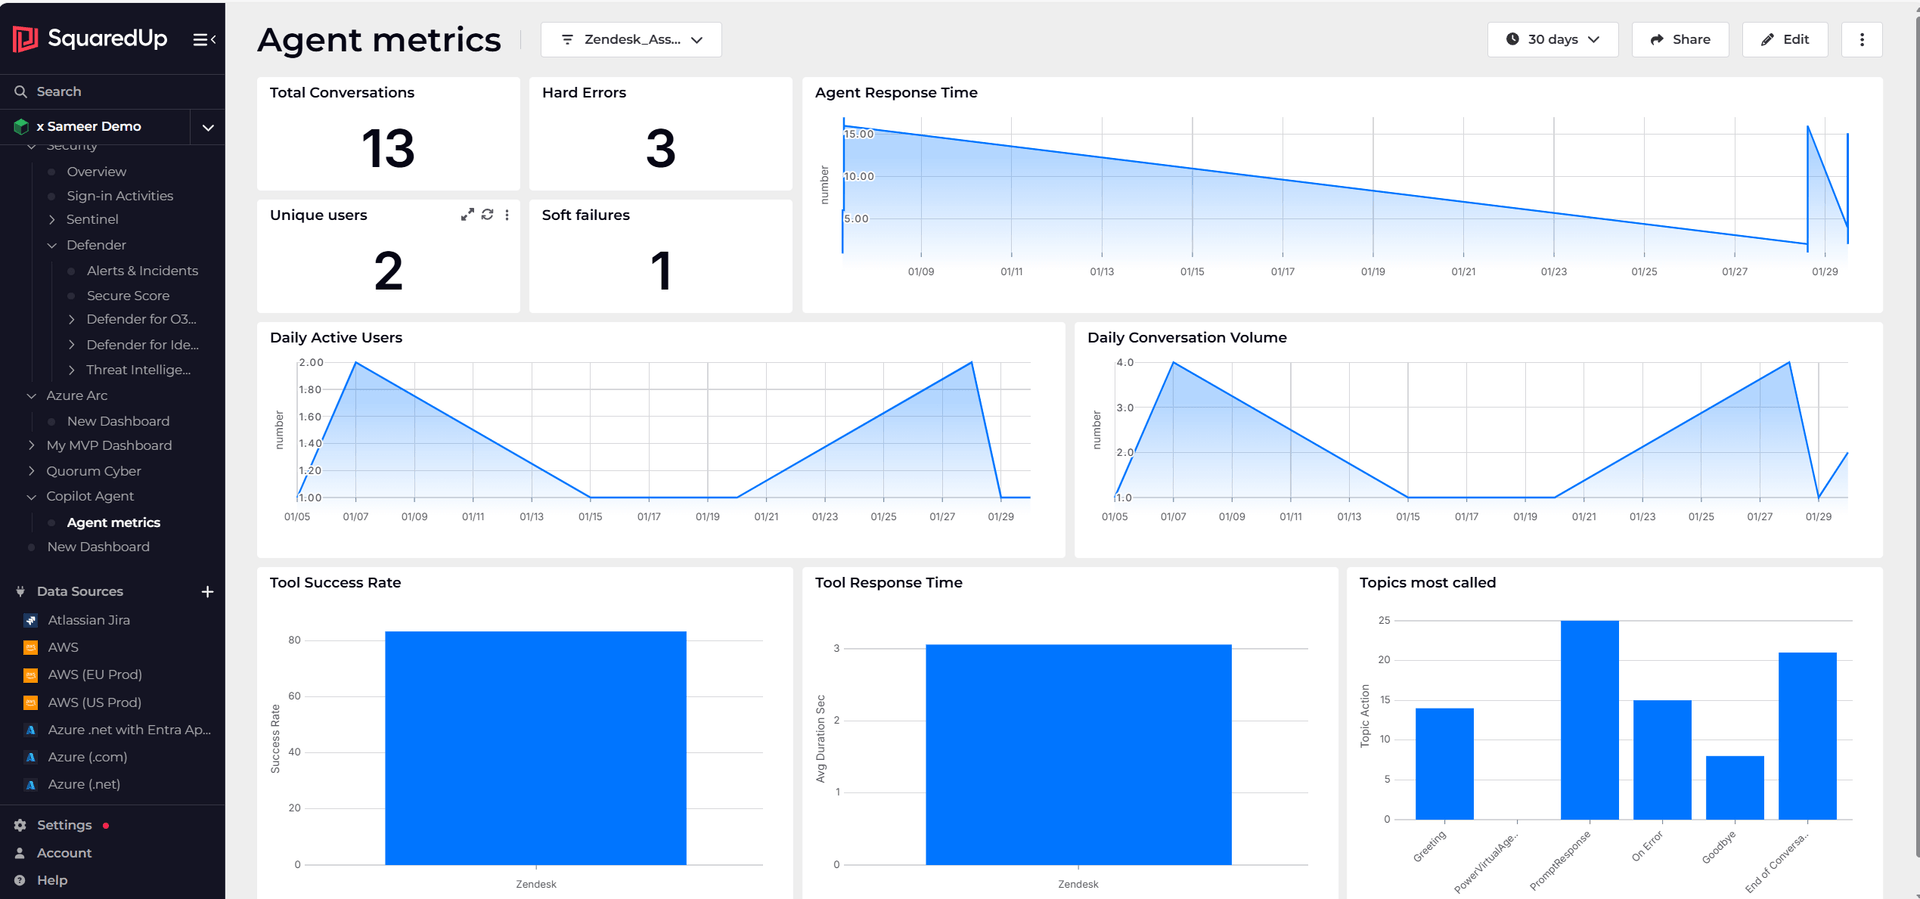
With SquaredUp, it is possible to implement a health model for your applications and resources across Azure services, create app‑centric dashboards, and quickly identify the root cause of issues without having to sift through dozens of charts and manually infer the overall state.
Grafana does not provide the roll-up capability.

As you can see, you can display dependencies within your app as well as make RCA easier by creating dashboards for each component of the app and building relationships between them.
Insights are of no real use if they can’t be shared with as many stakeholders as needed, without having to worry about losing the licenses.
SquaredUp and Grafana both allow you share the dashboards internally and externally, but in Grafana even simply reading the dashboard consumes a license. So if you want to share your dashboards with wider teams or stakeholders securely, the costs will scale with the numbers.
In SquaredUp, sharing the dashboard does not consume a license. It does not consume a license to simply see the dashboard securely so you can share it as much as you need.
Of course, chances that you are using other Microsoft products and technologies in your shop if you’re using are strong. Let's compare what other Microsoft-focused plugins are there in both platforms (besides the difference in Azure monitor plugin in Grafana and Azure plugin in SquaredUp we discussed above).
Azure DevOps - treated as a platform, not just telemetry
SQL server - allows running SQL queries on the database
SCOM - allows you to dashboard objects monitored in SCOM
M365 - built to help you monitor M365 services and products (Outlook, Exchange, SharePoint, Copilot, etc.) - the usage and adoption of M365 licenses, etc.
PowerShell - the PowerShell data source allows you to run PowerShell scripts “on the fly” directly from the SquaredUp portal and build dashboards based on data produced.
As you would have noticed, SquaredUp has a plethora of other, supporting plugins that a Microsoft shop would most likely also be using.
Both Grafana and SquaredUp can connect to Azure and surface the core observability data – metrics, logs, and traces.
However, if you are:
then SquaredUp’s Azure plugin is the better fit.
In short:
DevRel Engineer, SquaredUp & Microsoft MVP


Getting started with SquaredUp is free and easy. Our free tier includes: