John Hayes
Observability Advocate, SquaredUp

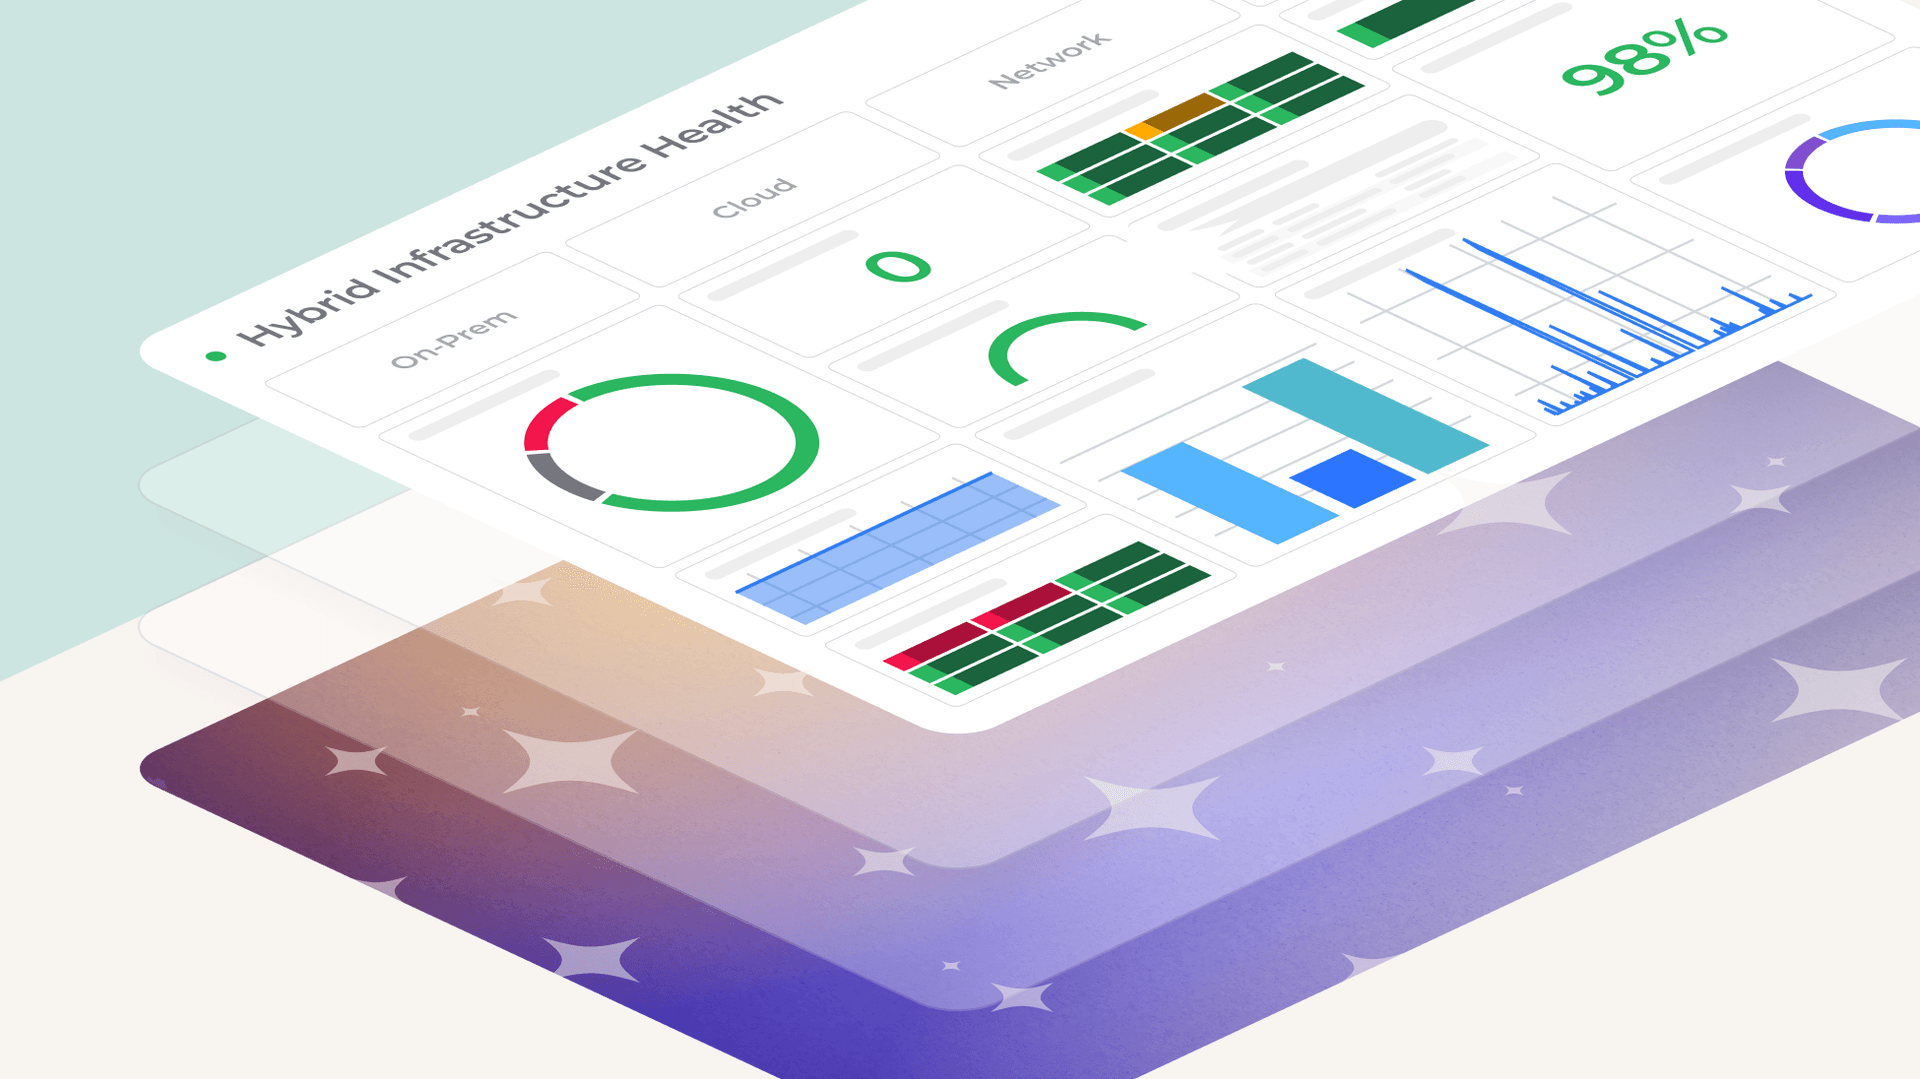
Use natural language prompts to generate stunning dashboards. Choose from 20 different visualisation types, rich customisation options and the ability to easily revert changes.
Earlier this year, our CEO, Richard Benwell, unveiled our roadmap for building AI into the SquaredUp platform. We are now excited to announce the general availability of SmartViz — our AI-powered tooling for generating dashboard visualisations using natural language commands. SmartViz also ships with a host of new visualisation types — including Sankey, diagrams, scattergrams, funnels, heatmaps and many more.
At SquaredUp, we believe that dashboards are not just static snapshots of isolated queries. Instead, they are radiators of the vital streams of information flowing through your enterprise. Our raft of new visualisations give you the tools to capture trends, patterns and correlations in your data, resulting in sharper insights and deeper understanding of your data and telemetry.
In this article, we will explore three of our new visualisation types:
And show how you can use SmartViz to generate and fine-tune them — either using natural language commands or selecting options in the control panel.
Heatmaps are a fantastic tool for easily identifying performance hotspots and bottlenecks in our applications and infrastructure. In the example below we have run a PromQL query to find the total number of HTTP 500 errors experienced by our production web services. The results have been grouped into four-hour time buckets.

When we are ready to create our visualisation we will see this button:

— inviting us to use SmartViz (naturally, you can still build your visualisations by hand if you wish). Let’s let the magic begin!
When you click on the button, SmartViz will evaluate your dataset and try to generate what it thinks might be the most appropriate visual. In our case, it originally chose a bar chart. This is a perfectly good choice for representing the overall pattern of our dataset. However, our specific aim is to have an at-a-glance view of the pain points in our systems, so we are going to select a heatmap from the dropdown list:

The initial result might look something like the image below:

SmartViz has automatically identified the correct X and Y axis mappings and has selected a default colour scheme. We can see straightaway that the payment-worker service is a real hotspot for errors between 12-4pm.
At the moment the visualisation is a little bit basic. I will make a few tweaks to increase its clarity and visual appeal:
We can either do this manually or we can type a command into the text box at the foot of the SmartViz pane:

And SmartViz will do all the knob-twiddling for us:

This is getting close to what I want, but I would like to make it really pop. What if I just give this prompt to SmartViz:

and let it get creative:

That is perfect — and I didn’t even know that I could format those cell borders. Naturally, SmartViz won’t get it right every time and it is limited to the options available in the underlying rendering engine. I did ask for labels to be formatted in bold, but that option was not available.
You will see that SmartViz displays a history of each transformation it makes. If you don’t like the latest version, you can easily revert to a previous one.

Sankey diagrams actually have a long history, dating back to 1898 when they were first used by Captain Matthew Sankey to show the energy inputs, outputs and efficiency of a steam engine. Today, they are ideal for purposes such as showing traffic flows across network infrastructures.
Below we have a dataset containing source and destination IP addresses for requests across a network. In tabular form this data is not particularly intuitive:

Using a Sankey diagram, however, it can really come to life. We get an instant picture of flows, density and potential bottlenecks.

This is a relatively simple example, but Sankey diagrams can show complex routing patterns across multiple intermediate steps. A really nice extra is that the canvas for the diagram is responsive, so that you can hover over individual nodes at any point in the graph and highlight the streams that traverse it:

Scattergrams are hugely helpful when querying diagnostic data and uncovering correlations between two related metrics. In this example, we are going to look at the relationship between database query execution time and the number of rows scanned — which will help us identify the potential need for query optimisation. The image below shows you the structure of our dataset:

The resulting scattergram really demonstrates how selecting the right visualisation can turn raw data into actionable insights. The trend lines for each series give us a good feel for the shape of our data and make it easy to spot outliers.

SmartViz is not just about simplicity – beneath the ease of use there is also a wealth of sophisticated configuration options. For the diagram above, we have given the original version a makeover by adding trendlines, defining custom colouring for a data series and changing the symbol for the data points. The possibilities are almost boundless.
In this article, we can really only scratch the surface of what you can achieve with SmartViz. There are now twenty visualisation types, each with its own rich set of formatting options. Naturally, you can find all the help you need in our docs, but the best way to discover SmartViz is to hit that big button, jump in and experience a new way of building dashboards.
SmartViz is one pillar of our AI strategy. Along with SmartMonitor, our Low Code Plugin framework and our MCP Server it forms part of our overall vision of allowing anyone to generate beautiful dashboards and gain deep insights from any data source with no coding knowledge.
SmartViz is available now and ships with every tier of the SquaredUp platform — including the free tier. If you don’t yet have a SquaredUp account, sign up now for our Free Forever tier and experience the next generation of dashboarding.
Observability Advocate, SquaredUp