Richard Benwell
Founder & CEO, SquaredUp

The scale, complexity, and change velocity of the systems we operate is exploding. Here’s our roadmap for a new generation of AI-powered operational intelligence to help you stay in control.
AI is set to transform our technology landscape. For many of us working in software, it already has — developers are now writing more code, building more features, and deploying more applications, faster. For the teams supporting IT and software services that means more applications to support, across a greater breadth of technologies, and with more complexity (that is probably less well understood by the developers who created it). Your operational tooling needs to keep pace.
Our mission from day one at SquaredUp has been to turn your operational data into actionable insights. AI is now supercharging that mission. But with so many wild claims about what AI can do, I wanted to share specifics about what we’re doing at SquaredUp to bring the benefits of AI to every team.
To be clear, this blog is not a look some distant vision of the future — the features I describe below are our short-term roadmap. The engineering team are busy readying these features for public release or private preview within the next three months. If you’d like to get early access or sign up for updates, I’ve included request links below.
Here is what’s coming:
That’s a lot to unpack. Let me take you through each one, explaining what we’re building and why.
All of your data. Zero barriers.
Tool sprawl has been cited as a challenge for as long as monitoring has been a discipline. Despite efforts to consolidate, engineering teams tend to add tools rather than reduce them. They adopt new solutions to fill gaps without de-provisioning old ones. Furthermore, the autonomy given to modern engineering teams means new tools are inevitably introduced to drive innovation.
In addition, the scope of monitoring and observability is growing. Modern operations teams are being asked for visibility across CI/CD pipelines, Cloud cost, security, DevOps metrics, customer experience and more.
At SquaredUp we solve the tool sprawl problem in a fundamentally different way to most observability and business intelligence tools: we create a data mesh, not a data warehouse. We do this by maintaining live connections to every tool via its API to provide on-demand, source-of-truth data.
We know that when customers ask for a ‘single pane of glass’, they’re looking for truly universal visibility across every tool and data source.
Here’s how we’re using AI to accelerate towards that goal.
Private Preview: Low Code Plugins
In May we announced our new AI-ready Low Code Plugin (LCP) framework. LCP is designed to provide secure, scalable, robust API connections, whilst providing a semantic layer that allows the API to be easily consumed and data correlated with other tools. The framework is low code because integrations can be built with UI or writing simple JSON in a text editor.
It has been a phenomenal success. We have released more integrations in the last two months than in the last two years, and that’s with Low Code Plugins still in private preview. Recent integrations added include HaloITSM, Huntress, Snowflake, NinjaOne, Vercel, Checkly, and Veeam, with the total now over 100 integrations.
Coming soon: AI toolkit (CLI + agent skills)
Our next goal is 1000+ integrations, and that’s not so far off, because since the release of LCP we’ve been building new integrations internally with Claude. To support building with Claude, we’ve created a comprehensive CLI tool and agent skills to make building plugins as effortless as possible.
The results have been astonishing. It can now take as little as one hour to go from initial prompt to a fully integrated data source — setup and authentication UI, object indexing, data streams wired up to API endpoints, and ready-made dashboards for common use cases.
To put this process to the test, I asked the LCP Product Manager to build a new plugin to announce in the keynote at our annual staff conference. The only problem was — he was enjoying a long weekend at Silverstone. No fear — hours before the keynote he had built and released our 100th plugin: OpenF1. Live race, driver and constructor stats with pre-built dashboards — all from one Claude prompt.
We’re excited to see what you’ll integrate into SquaredUp next.
→ Sign up to the LCP Private Preview
Magic ink for your dashboards
When I started SquaredUp I was inspired by the essay Magic Ink. The author, Bret Victor, marveled at the amazing capability we have using computers to instantly and dynamically draw anything on the screen — like magic ink — and contrasts this with how unintuitively most user interfaces show information to the user.
Following his essay, Bret went on to be hired by Apple to help design iOS for iPad, but data visualisation tools today are still too cumbersome for many users. Anything beyond a simple line chart often involves data wrangling that is unintuitive and requires learning new tools and query languages.
Data visualisation should be simple, and it should be self-service.
Today we have the technology to make this a reality. The visual capabilities of computers can now be complemented with AI smarts to finally make data insights available to all of us. Here’s how we’re using AI to bring a new era of ‘magic ink’ to your dashboards.
Available now: SmartAssist
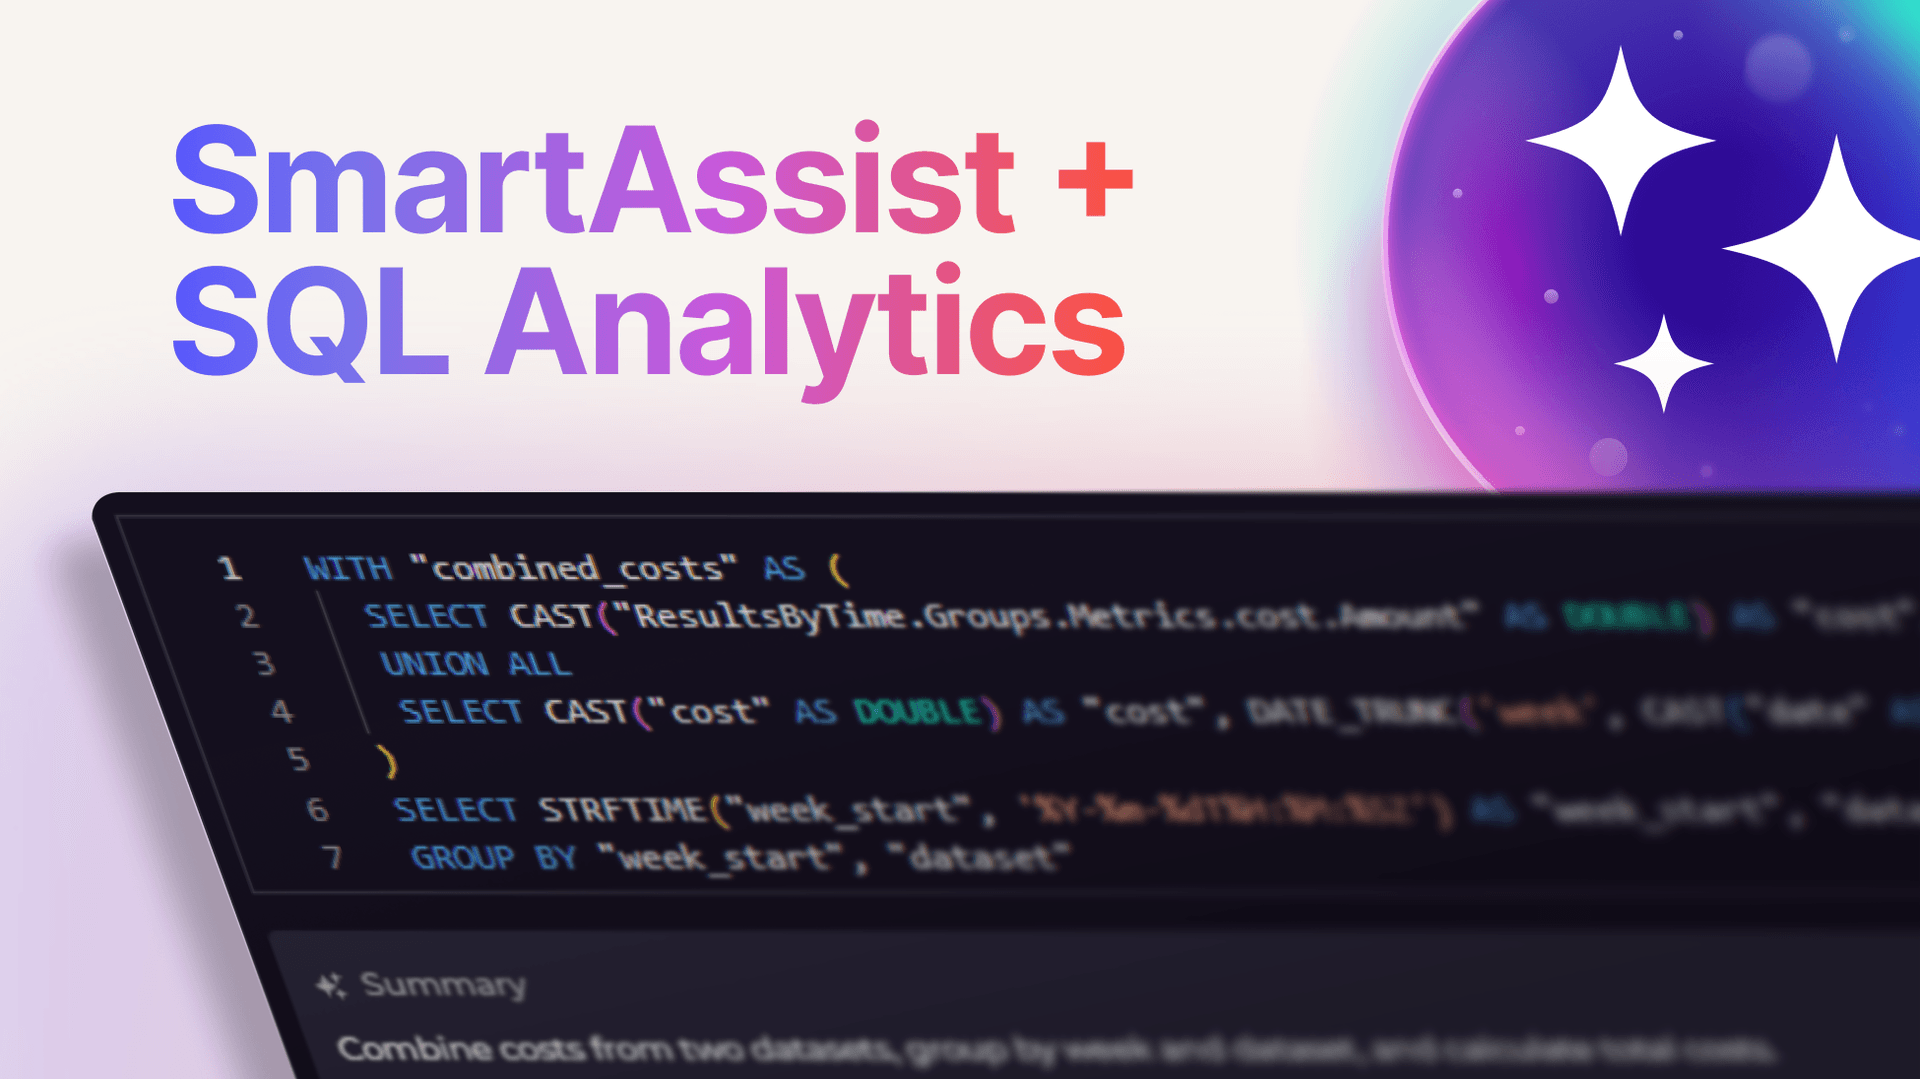
SmartAssist was our first introduction of AI services into SquaredUp, released in April. It takes the pain out of using custom query languages such as SQL, KQL, JQL and PromQL by providing a natural language chat interface.
With SmartAssist making SQL a breeze, we also chose to elevate our SQL Analytics feature into the regular dashboard authoring experience. It’s now easy to shape your data using natural language expressions like ‘show the average by month’ — no SQL experience needed, no searches or AI agents in another window.
But SmartAssist is not yet magic ink…
Coming soon: SmartViz
Our next step will deliver fully automatic, on-demand visualisation of any data from any tool. We’re calling this SmartViz.
First, we will be releasing an entirely new visualisation framework powered by Apache eCharts to support virtually every visualisation you could imagine. This means Sankey diagrams, bubble charts, and even entirely custom HTML visualisation are all coming to your SquaredUp dashboards soon.
Leveraging this new framework, SmartViz is a built-in AI that can turn any prompt into a data visualisation. SmartViz will select the right data source, configure the parameters, shape the data using SQL Analytics and customise the visualisation based on the data and the context.
Whether it’s building an executive report or understanding observability data on-the-fly, SmartViz will make it easy to turn your data into effective visualisations.
→ Sign up to the SmartViz Private Preview
AI analysing every signal, so you don’t have to
The “smart intern” analogy is a common way to view the current capabilities of AI agents — a tireless and capable worker that, despite needing a little guidance and oversight, can work through the most mundane of tasks with great diligence. (Our interns at SquaredUp get a little more… creative).
We’re putting the analogy to the test. What if someone was monitoring all of your dashboards — your metrics, your logs, your KPIs, your health indicators — on a 24x7 basis, digging into the details and summarising the points of interest that you need to know? Well, we’re about to find out.
Coming soon: SmartInsights
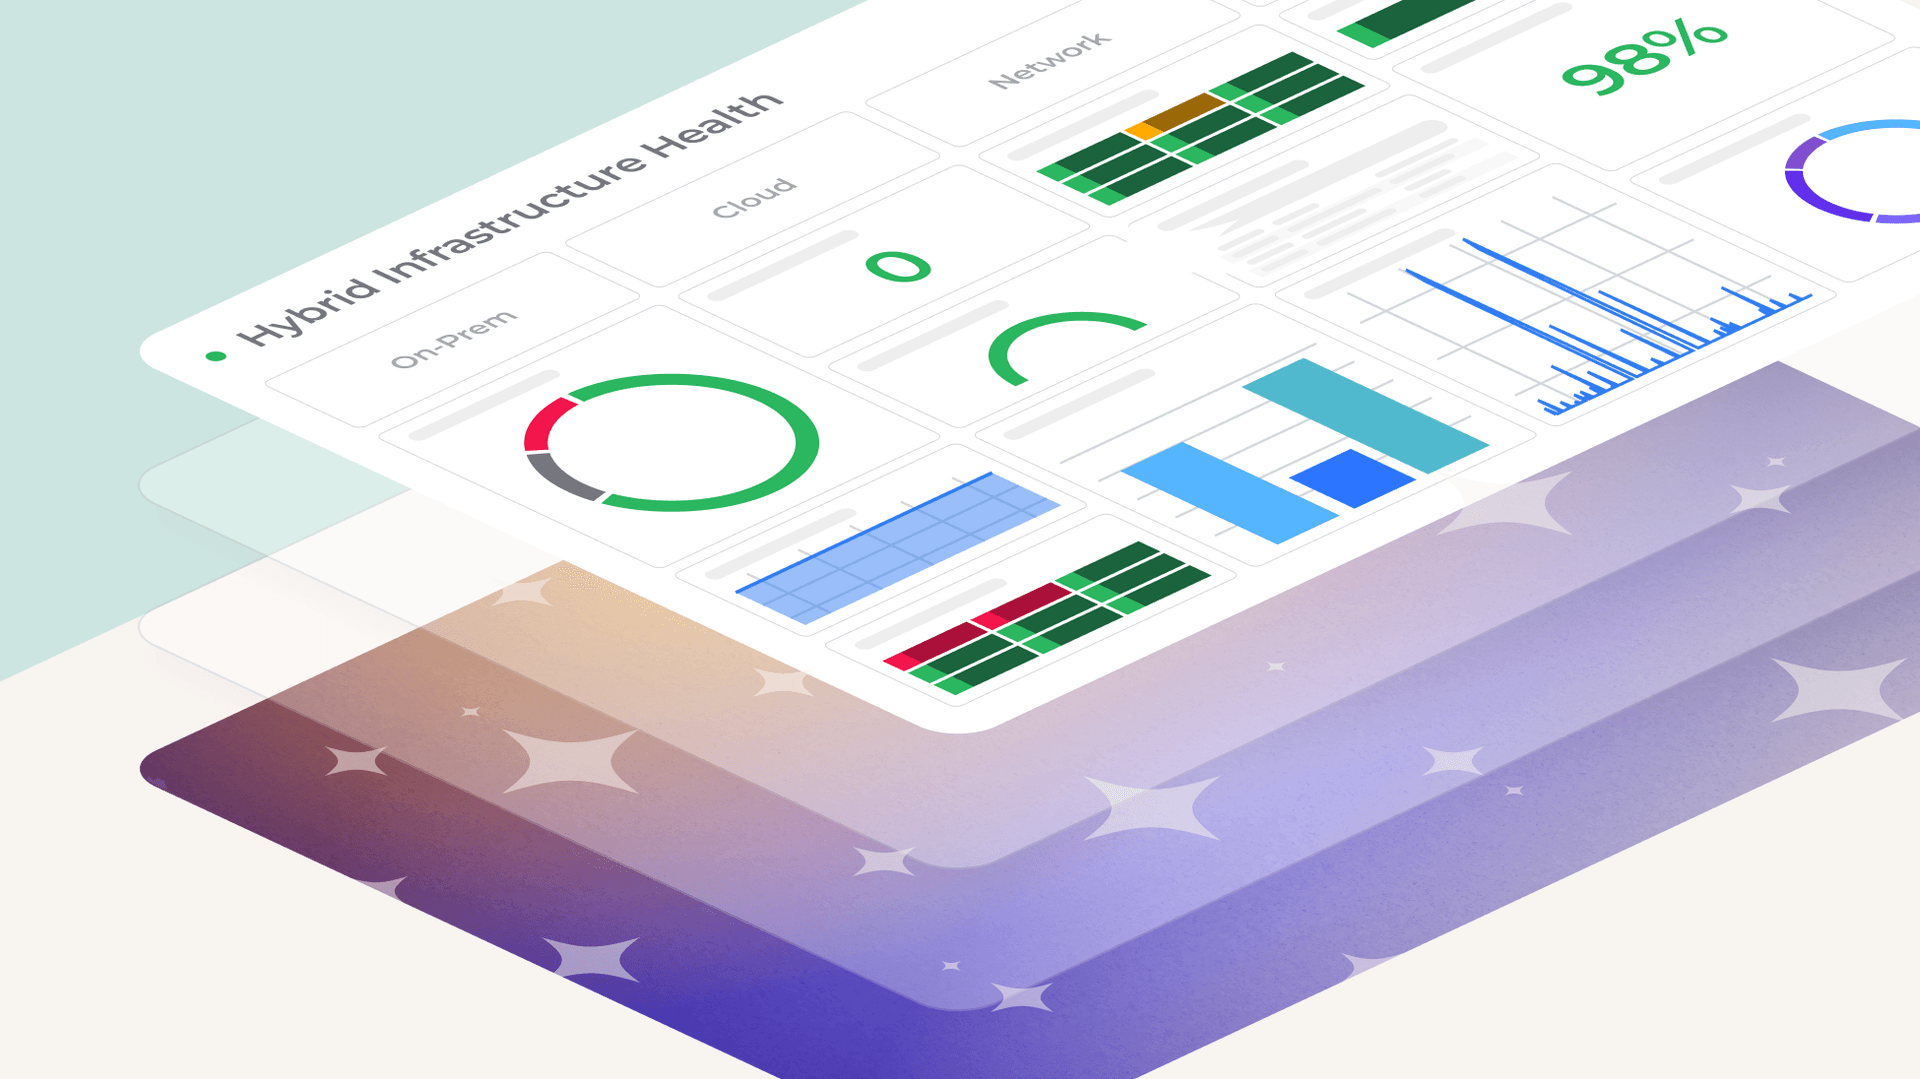
Smart insights is our next generation monitoring, leveraging AI. Either on demand or in the background, SmartInsights scans your dashboards looking for anomalies. This could be either in a daily briefing, a heightened awareness following a deployment, or as an initial pass after an incident.
These can be surfaced with a traditional red-amber-green status, but we’re also introducing a fourth colour: observation blue. This indicates an informational point of interest. Not necessarily good or bad, just something you might want to check out.
SmartInsights can be combined with our RollUp feature to deliver a summarised and curated view across your areas of concern — a little like a personalised news feed you’d find on your social media or a news app.
SmartInsights is not just limited to analysing static dashboards. By leveraging our knowledge graph and correlation engine (see below) it can provide deep contextual insights — tracing performance issues across application and infrastructure dependencies or correlating an incident with a recent CI/CD deployment.
We’ve already seen some impressive results in our internal environments and we’re excited to see this in the hands of our customers.
→Sign up to the SmartInsights Private Preview
Connecting the dots across your tools
Data is only as useful as the context it is placed within. A dashboard may tell you a metric has exceeded a threshold, but that’s of limited insight unless you know why that may be the case and what the impact might be. To understand both, you need context.
Context has always been what makes SquaredUp dashboards more than just dashboards. Two of the most popular features in our Dashboard Server product are VADA — a discovery tool that enables customer to map out application dependencies in complex enterprise environments — and object drilldowns — that allow deep, contextual exploration into the relationships and data behind the dashboards.
We created SquaredUp Cloud to extend contextual insights across every tool. Underpinning everything in SquaredUp Cloud is a knowledge graph — a database of every entity and the relationships between them. The more tools you connect, the more context you add.
Frankly, it was an ambitious goal, and we have only just started to realise the full potential. Thanks to AI, it is now quickly becoming a reality.
Coming soon: Correlation Engine v2
Our revamped Correlation Engine is designed to give you automatic correlation out of the box, without sacrificing the control and customisation needed in every unique environment. With a powerful new way to define relationships, entities can be easily merged, related, and grouped to reflect real-world relationships. In most cases, correlation will happen automatically using AI-generated rules to find connections across your environment.
Correlation is not just limited to technology domain. With integrations into customer, service desk, and development tools, SquaredUp can correlate technology with business contexts.
Here are some examples:
Our goal is to map everything from customer to code, putting your data into context and unlocking deeper insights.
-> Sign up to the Correlation Engine v2 Private Preview
Built for humans — and our AI assistants
Humans are at the heart of everything we do at SquaredUp. The products we build create better interfaces between humans and data, and the business we run is committed to people and planet, which we express via our B Corp certification. For the first time, our user is not just human — we’re also building for AI.
AI agents are increasingly being used to automate changes, perform diagnostics, and even build dashboards. With enough tokens AI agents can often tackle any task with a ‘brute force’ approach. But just like humans, they work better when using the right tools.
SquaredUp will empower your AI operations with:
Our interface for AI agents is the MCP server.
Private Preview: SquaredUp MCP
MCP (Model Context Protocol) is the current standard for enabling AI agents to easily perform actions on systems. We’ve made an MCP available for SquaredUp since the end of 2025 and over that time we’ve been building out the capabilities.
Customers are already using it to automate deployment of new workspaces and dashboards, and pulling KPIs into reports. But one area that has been a challenge is creating new dashboards on the fly — and that’s why we’ve built SmartViz. We’ll be rolling SmartViz into the MCP as soon as it’s ready, along with SmartInsights and the ability for AI agents to query knowledge graph.
SquaredUp is ultimately about providing humans with insights, but our AI helpers will be doing more of the leg work for us. We’re committed to building an operational intelligence platform that’s designed for both.
→ The MCP server is available to all enterprise customers. Sign up for access.
We’re excited to share what we’re building. And what better place to show it all off than SquaredUp Live in October — our annual virtual user conference where we showcase the latest features, solutions, and customer stories.
We’re just finalising the plans for this year’s SquaredUp Live — sign up below to be notified when details are available. Stay tuned.
Founder & CEO, SquaredUp